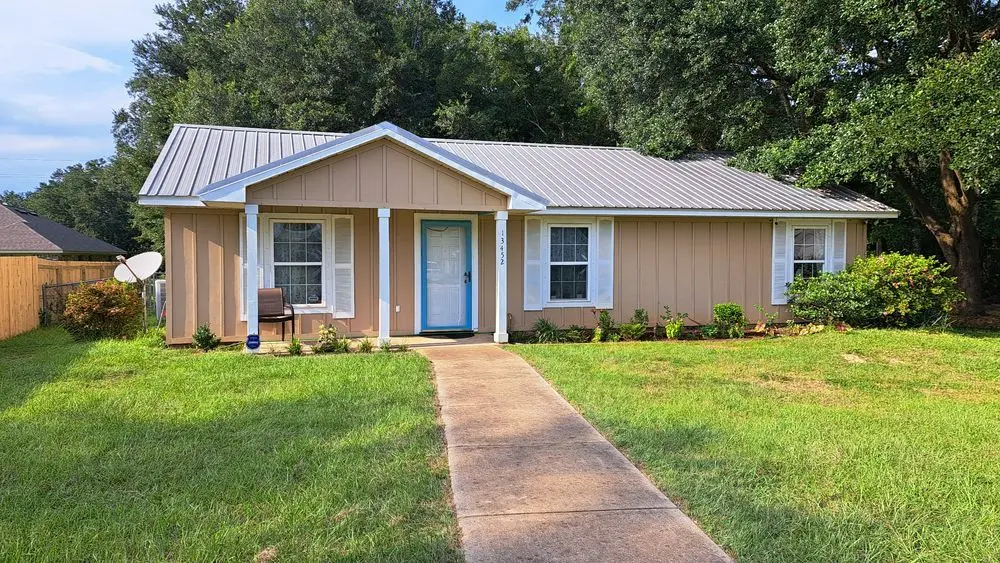
13452 Rooster Ln · Foley, AL
Flood risk 1/10 · Minimal
- FEMA flood zone
- X (unshaded)
- Chance of flooding over 30 yrs
- 0.0%
- Est. flood insurance / yr
- $507 – $1,088
Fire risk 3/10 · Minor
- Est. fire insurance / yr
- $916 – $1,700
Heat risk 10/10 · Severe
- Hot days now (above 105°F)
- 7 days/yr
- Hot days in 30 yrs
- 23 days/yr
Wind risk 9/10 · Severe
- Chance of severe wind over 30 yrs
- 99.0%
Air-quality risk 3/10 · Minor
- Unhealthy air days now
- 2 days/yr
- Unhealthy air days in 30 yrs
- 4 days/yr
Risk factors via First Street. Map © Google.
Why this score? — see what drove the C+ grade
The composite is a weighted blend of 9 inputs, each scored 0–100. Each bar is that input's sub-score; the figure is the points it added to the 100-point composite (weight × sub-score).
- Cash flow +24.2/30.0
- ARV discount +15.0/15.0
- DSCR +7.8/10.0
- 1% rule +4.9/10.0
- Schools +3.9/10.0
- Livability +3.1/5.0
- Rent growth +3.0/5.0
- Condition / age +2.5/5.0
- Appreciation +0.0/10.0
$210,000
🖨 Deal sheet 📄 Offer letter ✓ Due diligence
Listing remarks MLS
A charming 3 bedroom, 1.5 bathroom single-family house in Foley, AL is now available for sale! Come and enjoy the true Southern Coastal living! It is located in a cul-de-sac street with NO HOA and only 5 min away from the city center. You'll have access to shopping, entertainment and beautiful beaches just within minutes of driving. This home has a split floor plan with a cozy living room, open-concept dining area and a convenient kitchen. Stainless-steel appliances and also washer and dryer convey with the house. Stove and dishwasher are 3 years old. The house has a fenced backyard. A wooden shed gives you some extra storage space. Metal pergola on a wooden deck let you enjoy a shade. The large front yard with a long driveway has plenty of room for outdoor activities. House is being sold as-is, so that you have a unique opportunity to create your own dream home! Currently owner-occupied. Contact today to schedule the house showing to see your next Sweet Home here in Alabama! Terms: Cash / Conventional loan
Key facts
- Cul-de-sac street
- Access to shopping
- No hoa
Tags
Neighborhood map
What this means for you Summary
Snapshot
- This is a 3-bed/1.0-bath single-family listed at $210k.
Deal economics
- At list price, monthly cash flow is $418 ($5k/yr) — positive.
- The deal already cash-flows at list — no discount required.
- To meet the 1% rule (rent ≥ 1% of price), the offer needs to be $209k (0.7% below list).
- Recommended offer: $191k (9.0% below list) — sets the bar for market timing.
- Cap rate 8.7% vs local median 4.0% in Foley — top-decile yield for the area; either an underpriced asset or a hidden risk that comps aren't pricing in. Stress-test before assuming the spread holds.
Location & tenants
- Location reads 61/100 on livability (#241 in AL) — a middle-class / working-renter tenant base. Strengths: housing A+, cost of living A-, crime B; Watch: schools D+, employment D+, amenities F.
- Baldwin County (rural): math 33% / reading 57% proficiency, ranked #18 of 129 in AL (top 14%) — families likely to look elsewhere, expect single-tenant / working-renter base with shorter leases.
- Market conditions: Rents rising (+1.8%/yr); 875 active listings in the ZIP; 2 comparable units currently listed for rent nearby; 3,883 units permitted in Baldwin County in 2024 (481 in 5+ unit buildings).
- This rent runs 38% of the median local income ($67k/yr) — at the standard rent-burdened threshold; future hikes will face affordability resistance.
Forward outlook
- Local home prices are declining (-3.0%/yr); year-one equity from $1k of loan paydown is wiped out by about $6k of value loss. Plan a longer hold.
- Baldwin County population projected at +42% by 2050 — long-run rental-demand tailwind backs the buy-and-hold thesis.
Negotiation context
- It's been on market 99 days — a 9% lower offer ($191k) is reasonable based on typical stale-listing flexibility.
- 4 sale attempts since 8y ago; this cycle's ask has dropped $15k (7%) from the opening price — seller is motivated, your offer sets the floor, not the list.
- Current owner paid $167k; 26% above their basis — modest negotiation headroom, anchor on the comps not their cost.
Risks & watch-outs
- Climate carrying-cost: severe wind risk, 99% chance of damaging wind over 30y; extreme-heat days projected 7→23/yr by 2055 (HVAC capex compounding) — expect insurance premiums to compound above CPI over the hold.
Questions for the listing agent
- It's been on market 99 days. Have you received any prior offers? Is the seller open to a 9% concession, seller financing, or rate buy-down credit?
- Why hasn't it sold? Are there any deal-killer items the seller is aware of (foundation, flood, title, zoning, code violations)?
- Is there a deadline driving the sale (1031 exchange, divorce, estate, relocation)? That informs how much negotiation room exists.
- Schools are D-rated, which usually means shorter tenancies and higher turnover. Who's the typical renter profile here, and what's been the actual vacancy rate?
- What's the average days-on-market for RENTAL listings here right now (not sales)? A rising rental-DOM trend means longer vacancies and softer asking-rent achievability than the comps imply.
- What's the recent tenant-quality profile in this submarket — average credit score on applications, eviction rate, late-payment / NSF rate, and stable-employment percentage? A property-management company in the area should have these aggregated.
- How much new for-sale + rental construction is in the pipeline within 1–3 miles? Heavy new supply typically softens prices + rents 12–24 months out; constrained supply supports both.
Investment metrics
- 1% rule
- 0.99% ✗
- Cap rate
- 8.68%
- Cash-on-cash
- 8.53%
- DSCR
- 1.38
- GRM
- 8.4
CMA / ARV
- ARV (median comp)
- $253,210
- List price
- $210,000
- Delta
- -17.06%
- Verdict
- UNDERPRICED
- Comps
- 20 within 1.0 mi
Show comp detail 2 sales within ~0.75 mi
| Address | Dist | Beds/Ba | Sqft | Sold | Price | $/sf | Match |
|---|---|---|---|---|---|---|---|
| 13474 Rooster Ln | 0.02mi | 3/1.5 | 1,056 (-4%) | 10mo | $179,900 | $170 | 81 |
| 13633 Shea Cir | 0.75mi | 3/2.0 | 1,205 (+9%) | 3mo | $248,900 | $207 | 44 |
Match score weights: distance 35% · size 25% · config 20% · recency 20%. Top-matched comps best support the ARV.
Projected returns pro-forma
-3.0% appreciation · 1.81% rent growth · sell at horizon
- IRR
- -4.6%
- Equity multiple
- 0.83×
- Total profit
- $-9,979
- Equity at exit
- $31,312
- IRR
- 3.8%
- Equity multiple
- 1.26×
- Total profit
- $15,277
- Equity at exit
- $18,157
Cash invested: $58,800 (down + closing). Projections, not guarantees.
Landlord ↔ Tenant lean methodology
- Overall (STATE)
- 90 Strongly Landlord-Friendly
- State Alabama
- 90 Strongly Landlord-Friendly · R+15
- County
- — inherits STATE
- City
- — inherits STATE
ZIP-level market 36535
- Home prices YoY
- -24.9%
- Rents YoY
- 1.8%
- Active inventory
- 875
- Price-to-rent
- 8.4×
Monthly cashflow live
- Estimated rent
- $2,086 medium interval (Pro) →
- Mortgage (P&I)
- −$1,101
- Tax from tax record
- −$41 /mo · $496/yr
- Insurance
- −$88
- HOA
- −$0
- Vacancy / Maint / Mgmt
- −$438
- Net cashflow
- $418
Break-even live
UW: 25.0% down · 7.5% · 30yr · 1.5% tax · 5.0% vac · 8.0% maint · 8.0% mgmt
Financing live
Cash to close
- Down payment
- $52,500
- Closing costs
- $6,300
- Reserves months
- —
- Total cash needed
- —
Loan-product check · same deal, 3 products live
Conventional
25% down · 7.5% · 30yr
- Down + closing
- —
- Monthly P&I
- —
- Monthly cashflow
- —
- DSCR
- —
- Eligible?
- —
Personal DTI + credit; lowest rate.
DSCR
20% down · 8.5% · 30yr
- Down + closing
- —
- Monthly P&I
- —
- Monthly cashflow
- —
- DSCR
- —
- Eligible?
- —
No personal income docs; deal must DSCR.
Hard money
10% down · 12.0% · 12mo
- Down + closing
- —
- Monthly P&I
- —
- Monthly cashflow
- —
- DSCR
- —
- Eligible?
- —
Short-term bridge; refi at stabilization.
Rent comps 2 comps
| Address | Beds | Baths | Sqft | Rent | $/sqft | DOM | Units | Dist |
|---|---|---|---|---|---|---|---|---|
| 13634 Logan Pl , AL | 3.0 | 2.0 | 1281 | $1,895 | $1.48 | 21d | 1 | 0.83mi |
| 13691 Logan Pl , AL | 4.0 | 2.0 | 1417 | $1,995 | $1.41 | 21d | 1 | 0.84mi |
Listing history 28 events
-
2026-06-19days on market $210,000 Active 99 DOM
-
2026-06-18days on market $210,000 Active 98 DOM
-
2026-06-17days on market $210,000 Active 97 DOM
-
2026-06-16days on market $210,000 Active 96 DOM
-
2026-06-15days on market $210,000 Active 95 DOM
-
2026-06-14days on market $210,000 Active 93 DOM
-
2026-06-13days on market $210,000 Active 92 DOM
-
2026-06-10days on market $210,000 Active 90 DOM
-
2026-06-09days on market $210,000 Active 89 DOM
-
2026-06-08days on market $210,000 Active 88 DOM
-
2026-06-07pricedays on market $210,000 Active 87 DOM
-
2026-06-03days on market $225,000 Active 83 DOM
-
2026-06-02days on market $225,000 Active 82 DOM
-
2026-06-01days on market $225,000 Active 81 DOM
-
2026-05-31days on market $225,000 Active 80 DOM
-
2026-05-30days on market $225,000 Active 79 DOM
-
2026-03-12$225,000 Active 1024-char remark
Show marketing remark (1024 chars)
A charming 3 bedroom, 1.5 bathroom single-family house in Foley, AL is now available for sale! Come and enjoy the true Southern Coastal living! It is located in a cul-de-sac street with NO HOA and only 5 min away from the city center. You'll have access to shopping, entertainment and beautiful beaches just within minutes of driving. This home has a split floor plan with a cozy living room, open-concept dining area and a convenient kitchen. Stainless-steel appliances and also washer and dryer convey with the house. Stove and dishwasher are 3 years old. The house has a fenced backyard. A wooden shed gives you some extra storage space. Metal pergola on a wooden deck let you enjoy a shade. The large front yard with a long driveway has plenty of room for outdoor activities. House is being sold as-is, so that you have a unique opportunity to create your own dream home! Currently owner-occupied. Contact today to schedule the house showing to see your next Sweet Home here in Alabama! Terms: Cash / Conventional loan
-
2025-09-18price $221,000
-
2025-09-18price $221,000
-
2025-09-12price $223,000
-
2025-09-12price $223,000
-
2025-09-03$225,000 Active
-
2022-03-03soldstatus $167,000 Closed
-
2022-02-01status Pending
-
2022-01-26$169,000 Active
-
2018-04-27soldstatus $55,000
-
2018-02-27$69,900
-
2008-06-25soldstatus $93,943
ⓘ Source: listings_history table (triggers on properties + properties_extension) + one-shot
backfill from property_details.listing_events for pre-trigger history.
Tax reassessment forecast AL · Resets to sale price
- Current annual tax
- $496 · $41/mo
- Projected year-2 tax
- $861 · $72/mo
- Expected delta
- +$365/yr (+$30/mo · 73.5%)
ⓘ Screening estimate from a state-policy table — verify with the county assessor before closing.
Climate risk First Street
- Flood 1/10 Low FEMA zone X (unshaded) · 0% chance over 30 yrs
- Wildfire 3/10 Moderate
- Heat 10/10 Extreme 7 d/yr ≥105°F today · 23 d/yr by 30 yrs out
- Wind 9/10 Extreme 99% chance of damaging wind over 30 yrs
- Air quality 3/10 Moderate 2 unhealthy d/yr today · 4 by 30 yrs out
Nearby sold comps map
Loading sold comps map…
Walkable amenities ~0.75 mi
Loading nearby amenities…
Taxation est. · year 1
- Rental income
- $25,035
- − Mortgage interest
- −$11,763
- − Property taxes
- −$496
- − Insurance
- −$1,050
- − Repairs & maintenance
- −$2,003
- − Management
- −$2,003
- − Depreciation
- −$6,109
- Taxable income
- $1,611
- Est. tax owed @ 24.0%
- −$387
- After-tax cash flow
- $4,630/yr
For passive investors: Depreciation is non-cash, so a rental often shows a tax loss while cash-flowing — sheltering income. Rental losses are passive: they offset passive income freely, and up to $25,000/yr can offset ordinary (W-2) income if you actively participate and your MAGI is under $100k (phasing out to $0 by $150k); unused losses carry forward. On sale, claimed depreciation is recaptured at up to 25%, and gains may owe capital-gains tax (a 1031 exchange can defer both). Figures are a year-1 estimate at your 24.0% rate — not tax advice; consult a CPA.
Schools (NCES district)
- District
- Baldwin County
- NCES district ID
- 0100270
- Math proficiency
- 33% ▼ -26.00%
- Reading proficiency
- 57% ▲ 1.00%
- Median HH income
- $50,677
- Composite
- 38.61/100
- National rank
- #4157
- State rank
- #18 of 129 in AL
Livability — Foley
- Score
- 61/100
- State rank
- #241
- US rank
- #17616
Category grades
Schools grade is shown separately in the Schools card above.
Census & demographics
- Census place
- Foley, AL
- County
- Baldwin County · 181,514 people
- City population
- 40,628
- Metro
- Daphne-Fairhope-Foley, AL
- Population (ZIP)
- 40,628
- Household income
- $66,714
- Rent vs Own
- Severe rent burden
- 803.0
Population outlook (Baldwin County) Hauer SSP2
- Today (2025)
- 248,264 people
- By 2030
- 270,315 · +8.9%
- By 2040
- 312,967 · +26.1%
- By 2050
- 352,262 · +41.9%
- By 2075
- 438,841 · +76.8%
- By 2100
- 487,736 · +96.5%
Race, ethnicity, and origin ACS 2023
- Neighborhood character
- Predominantly White (78%)
- Race & ethnicity
- White 78% Hispanic / Latino 10% Two or more races 8% Black 5% Asian 2%
- Hispanic origin (detail)
- Mexican 6%
- Common ancestry
- Lithuanian 2% Romanian 2% Slovak 1%
- Foreign-born
- 6% · Canada, China
- Languages at home
- 89% English-only · Spanish 7% Other Indo-European 2% Chinese 1%
Political lean MEDSL · Baldwin
- 2024 margin
- Solid R (+58.2) · D 20.5% · R 78.7%
- 2008→2024 swing
- -6.7pp toward R · 2008: -51.5pp · 2024: -58.2pp
- All cycles
- 2024: R+58.2 2020: R+53.8 2016: R+57.8 2012: R+55.8 2008: R+51.5
Not yet ingested
- Civics
- —
Market trends
- HPI YoY
- ▼ -86.82%
- Current HPI
- 262.2796
- Rent YoY
- ▲ 1.81%
- Metro
- Daphne-Fairhope-Foley, AL
- State GDP YoY
- ▲ 2.94%
- F500 in state
- 4
Industry mix (Fortune 500 HQ in AL)
| Industry | F500 HQs | Revenue |
|---|---|---|
| Financial Services | 1 | $8B |
|
||
| Healthcare | 1 | $5B |
|
||
Price history
+139.5% since first listed12 events — show timeline
- 2026-03-12 Listed $225,000 ForSaleByOwner.com
- 2025-09-18 Price Changed $221,000 GCMLS AL
- 2025-09-18 Price Changed $221,000 BCAR
- 2025-09-12 Price Changed $223,000 GCMLS AL
- 2025-09-12 Price Changed $223,000 BCAR
- 2025-09-03 Listed $225,000 BCAR
- 2022-03-03 Sold (MLS) $167,000 BCAR
- 2022-02-01 Pending — BCAR
- 2022-01-26 Listed $169,000 BCAR
- 2018-04-27 Sold (MLS) $55,000 BCAR
- 2018-02-27 Listed $69,900 BCAR
- 2008-06-25 Sold (Public Records) $93,943 Public Records
Property tax history
+9.9%/yrLatest (2025): $496 · +25.6% YoY. Source: county tax records.
Cash-flow waterfall
monthlySold comps — $/sqft
last 12 mo · ≤1 miLoading sold comps…