 8-Plex
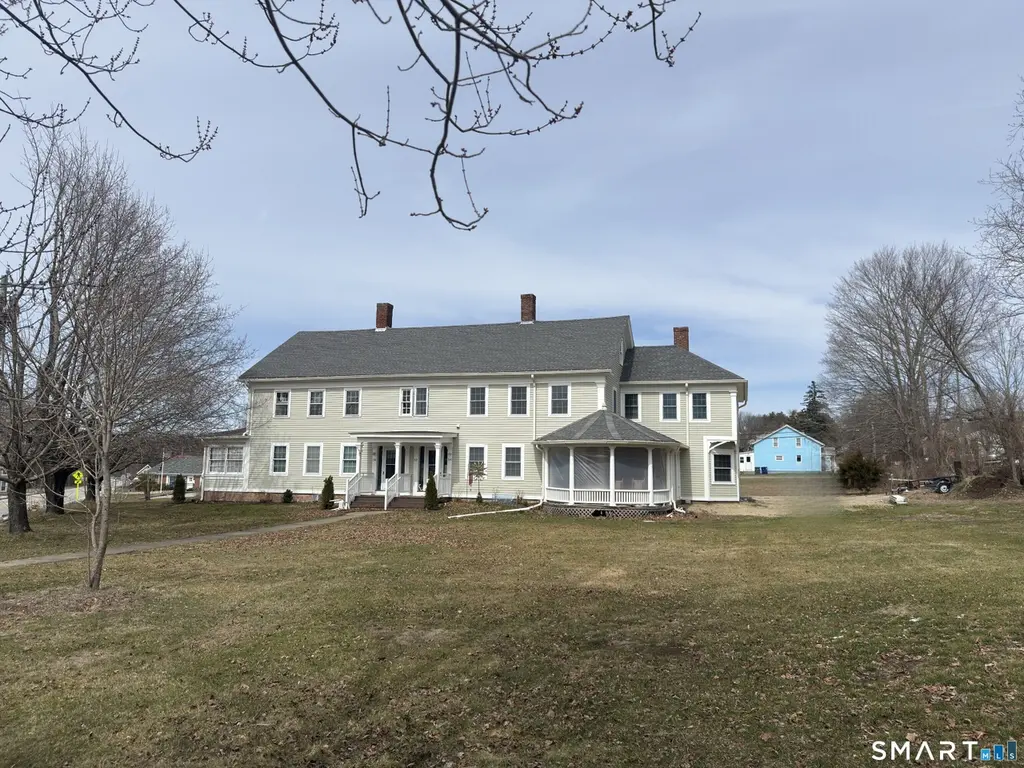
46-52 Wauregan Rd · Wauregan, CT
Flood risk 1/10 · Minimal
- FEMA flood zone
- X (unshaded)
- Chance of flooding over 30 yrs
- 0.0%
- Est. flood insurance / yr
- $507 – $1,088
Fire risk 3/10 · Minor
- Est. fire insurance / yr
- $829 – $1,539
Heat risk 5/10 · Moderate
- Hot days now (above 96°F)
- 7 days/yr
- Hot days in 30 yrs
- 16 days/yr
Wind risk 6/10 · Moderate
- Chance of severe wind over 30 yrs
- 62.0%
Air-quality risk 3/10 · Minor
- Unhealthy air days now
- 2 days/yr
- Unhealthy air days in 30 yrs
- 3 days/yr
Risk factors via First Street. Map © Google.
Why this score? — see what drove the B- grade
The composite is a weighted blend of 9 inputs, each scored 0–100. Each bar is that input's sub-score; the figure is the points it added to the 100-point composite (weight × sub-score).
- Cash flow +30.0/30.0
- 1% rule +10.0/10.0
- DSCR +10.0/10.0
- ARV discount +7.5/15.0
- Livability +3.3/5.0
- Schools +2.9/10.0
- Rent growth +2.5/5.0
- Condition / age +2.5/5.0
- Appreciation +0.0/10.0
$625,000
🖨 Deal sheet 📄 Offer letter ✓ Due diligence
Multi-family units
County records classify this as Multi-Family (5+ Unit). Listing-text estimate: 8 units. confirmed
5+ unit building — per-unit beds/baths from public records are typically unavailable; the breakdown below (if shown) is an estimate from the listing text.
Listing remarks
Exceptional investment opportunity with value add potential. This well maintained multifamily property is currently configured as 5 units with a possibility to convert to a 8 unit building. (Buyer to do due diligence). Many of the units have been updated or are in the process of being refreshed. Most are new windows, new floors paint appliances. The unit mix includes a spacious three bedroom two bath unit, a two bedroom two bath unit, two units are three bedrooms, one bathroom and 2 bedroom 1 bath. Whether you're looking to expand your portfolio or capitalize on a property with future development potential, this is a rare opportunity to step into a partially improved asset with room to grow
Key facts
- 0.82 acre lot
- Garage
- Built 1877
Neighborhood map
What this means for you Summary
Snapshot
- This is a 8 × 1-bed/?-bath units multifamily listed at $625k.
Deal economics
- At list price, monthly cash flow is $4k ($51k/yr) — positive. Per door: $529/mo.
- The deal already cash-flows at list — no discount required.
- Meets the 1% rule at list price ($11k rent vs $625k).
Location & tenants
- Location reads 66/100 on livability (#123 in CT) — a middle-class / working-renter tenant base. Strengths: crime A+, housing A+, cost of living A; Watch: health & safety D+, amenities F, commute F.
- Plainfield School District (town): math 24% / reading 41% proficiency, ranked #117 of 153 in CT (top 76%) — families likely to look elsewhere, expect single-tenant / working-renter base with shorter leases.
- Zoned schools: Plainfield High School (math 17% / reading 42%, grade F, #139 of 194 statewide, top 74%, 535 students, 49% FRL).
- Market conditions: 54 active listings in the ZIP; 149 units permitted in Northeastern Connecticut Planning Region in 2024 (0 in 5+ unit buildings).
Forward outlook
- Local home prices are declining (-3.0%/yr); year-one equity from $4k of loan paydown is wiped out by about $19k of value loss. Plan a longer hold.
- At projected returns (-3.0% appreciation + 3.0% rent growth), your $175k cash investment doubles in ~5 years — after that, you're playing with house money.
Negotiation context
- Only 9 days on market — expect competitive offers; lowballing is unlikely to land.
Risks & watch-outs
- Watch-outs: built in 1877 — expect roof / HVAC / electrical / plumbing capex.
- Climate carrying-cost: major wind risk, 62% chance of damaging wind over 30y; extreme-heat days projected 7→16/yr by 2055 (HVAC capex compounding) — expect insurance premiums to compound above CPI over the hold.
Questions for the listing agent
- Can we see the unit-by-unit rent roll, current vacancy, and any below-market leases? What's the average tenancy length?
- What capital expenditures (roof, boiler, parking lot, exteriors) have been made in the last 5 years, and what's planned in the next 2?
- Built in 1877 — when were the roof, HVAC, electrical panel, plumbing, and water heater last replaced?
- Is there a deadline driving the sale (1031 exchange, divorce, estate, relocation)? That informs how much negotiation room exists.
- Schools are F-rated, which usually means shorter tenancies and higher turnover. Who's the typical renter profile here, and what's been the actual vacancy rate?
- What's the average days-on-market for RENTAL listings here right now (not sales)? A rising rental-DOM trend means longer vacancies and softer asking-rent achievability than the comps imply.
- What's the recent tenant-quality profile in this submarket — average credit score on applications, eviction rate, late-payment / NSF rate, and stable-employment percentage? A property-management company in the area should have these aggregated.
- How much new apartment / multifamily construction is in the pipeline within 1–3 miles? Heavy new supply (>2% of stock underway) typically softens rents 12–24 months out; light construction supports rent growth.
Investment metrics
- 1% rule
- 1.68% ✓
- Cap rate
- 14.42%
- Cash-on-cash
- 29.03%
- DSCR
- 2.29
- GRM
- 4.9
CMA / ARV
No comps found within radius.
Projected returns pro-forma
-3.0% appreciation · 3.0% rent growth · sell at horizon
- IRR
- 23.4%
- Equity multiple
- 1.96×
- Total profit
- $168,375
- Equity at exit
- $93,190
- IRR
- 31.3%
- Equity multiple
- 3.82×
- Total profit
- $493,880
- Equity at exit
- $54,039
Cash invested: $175,000 (down + closing). Projections, not guarantees.
Landlord ↔ Tenant lean methodology
- Overall (STATE)
- 27 Tenant-Leaning
- State Connecticut
- 27 Tenant-Leaning · D+7
- County
- — inherits STATE
- City
- — inherits STATE
ZIP-level market 06234
- Home prices YoY
- -8.6%
- Active inventory
- 54
- Price-to-rent
- 39.6×
Monthly cashflow live
- Estimated rent
- $10,530 medium interval (Pro) →
- Mortgage (P&I)
- −$3,278
- Tax from tax record
- −$547 /mo · $6,566/yr
- Insurance
- −$260
- HOA
- −$0
- Vacancy / Maint / Mgmt
- −$2,211
- Net cashflow
- $4,234
Break-even live
8-unit breakdown (identical units grouped — click to expand)
| Units | Beds | Baths | Est. rent |
|---|---|---|---|
| 8× units | 1 | — | $10,528 |
| #1 | 1 | — | $1,316 |
| #2 | 1 | — | $1,316 |
| #3 | 1 | — | $1,316 |
| #4 | 1 | — | $1,316 |
| #5 | 1 | — | $1,316 |
| #6 | 1 | — | $1,316 |
| #7 | 1 | — | $1,316 |
| #8 | 1 | — | $1,316 |
| Total (8 units) | $10,530 | ||
UW: 25.0% down · 7.5% · 30yr · 1.5% tax · 5.0% vac · 8.0% maint · 8.0% mgmt
Financing live
Cash to close
- Down payment
- $156,250
- Closing costs
- $18,750
- Reserves months
- —
- Total cash needed
- —
Loan-product check · same deal, 3 products live
Conventional
25% down · 7.5% · 30yr
- Down + closing
- —
- Monthly P&I
- —
- Monthly cashflow
- —
- DSCR
- —
- Eligible?
- —
Personal DTI + credit; lowest rate.
DSCR
20% down · 8.5% · 30yr
- Down + closing
- —
- Monthly P&I
- —
- Monthly cashflow
- —
- DSCR
- —
- Eligible?
- —
No personal income docs; deal must DSCR.
Hard money
10% down · 12.0% · 12mo
- Down + closing
- —
- Monthly P&I
- —
- Monthly cashflow
- —
- DSCR
- —
- Eligible?
- —
Short-term bridge; refi at stabilization.
Listing history 3 events
-
2026-04-09status Under Contract
-
2026-04-01$625,000 Active
-
2026-03-29historical $625,000
ⓘ Source: listings_history table (triggers on properties + properties_extension) + one-shot
backfill from property_details.listing_events for pre-trigger history.
Tax reassessment forecast CT · Partial reset (capped growth)
- Current annual tax
- $6,566 · $547/mo
- Projected year-2 tax
- $9,970 · $831/mo
- Expected delta
- +$3,404/yr (+$284/mo · 51.9%)
ⓘ Screening estimate from a state-policy table — verify with the county assessor before closing.
Climate risk First Street
- Flood 1/10 Low FEMA zone X (unshaded) · 0% chance over 30 yrs
- Wildfire 3/10 Moderate
- Heat 5/10 Major 7 d/yr ≥96°F today · 16 d/yr by 30 yrs out
- Wind 6/10 Major 62% chance of damaging wind over 30 yrs
- Air quality 3/10 Moderate 2 unhealthy d/yr today · 3 by 30 yrs out
Nearby sold comps map
Loading sold comps map…
Walkable amenities ~0.75 mi
Loading nearby amenities…
Taxation est. · year 1
- Rental income
- $126,360
- − Mortgage interest
- −$35,010
- − Property taxes
- −$6,566
- − Insurance
- −$3,125
- − Repairs & maintenance
- −$10,109
- − Management
- −$10,109
- − Depreciation
- −$18,182
- Taxable income
- $43,260
- Est. tax owed @ 24.0%
- −$10,382
- After-tax cash flow
- $40,420/yr
For passive investors: Depreciation is non-cash, so a rental often shows a tax loss while cash-flowing — sheltering income. Rental losses are passive: they offset passive income freely, and up to $25,000/yr can offset ordinary (W-2) income if you actively participate and your MAGI is under $100k (phasing out to $0 by $150k); unused losses carry forward. On sale, claimed depreciation is recaptured at up to 25%, and gains may owe capital-gains tax (a 1031 exchange can defer both). Figures are a year-1 estimate at your 24.0% rate — not tax advice; consult a CPA.
Schools (NCES district)
- District
- Plainfield School District
- NCES district ID
- 0903270
- Math proficiency
- 24% ▼ -16.00%
- Reading proficiency
- 41% ▼ -17.00%
- Median HH income
- $62,056
- Composite
- 29.36/100
- National rank
- #6531
- State rank
- #117 of 153 in CT
Livability — Wauregan
- Score
- 66/100
- State rank
- #123
- US rank
- #12351
Category grades
Schools grade is shown separately in the Schools card above.
Census & demographics
- Census place
- Wauregan, CT
- City population
- 184
- Population (ZIP)
- 8,526
Population outlook (Northeastern Connecticut County) Hauer SSP2
- By 2040
- 104,160
Race, ethnicity, and origin ACS 2023
- Neighborhood character
- Predominantly White (88%)
- Race & ethnicity
- White 88% Two or more races 5% Hispanic / Latino 5% Asian 2%
- Common ancestry
- Russian 8% Lithuanian 7% Slovak 4%
- Foreign-born
- 4% · Canada, China
- Languages at home
- 93% English-only · Spanish 4% Chinese 1% Tagalog/Filipino 1%
Political lean MEDSL · Northeastern Connecticut
- 2024 margin
- R (+15.4) · D 41.5% · R 57.0% · Other 1.5%
- All cycles
- 2024: R+15.4
Not yet ingested
- Civics
- —
Market trends
- HPI YoY
- ▼ -20.97%
- Current HPI
- 224.2789
- Rent YoY
- —
- Metro
- —
- State GDP YoY
- ▲ 1.06%
- F500 in state
- 38
Industry mix (Fortune 500 HQ in CT)
| Industry | F500 HQs | Revenue |
|---|---|---|
| Industrial Machinery | 4 | $38B |
|
||
| Insurance | 3 | $71B |
|
||
| Financial Services | 2 | $25B |
|
||
| Transportation / Logistics | 2 | $18B |
|
||
| Healthcare | 1 | $247B |
|
||
| Telecommunications | 1 | $55B |
|
||
Price history
+0.0% since first listed3 events — show timeline
- 2026-04-09 Pending — Smart MLS
- 2026-04-01 Listed $625,000 Smart MLS
- 2026-03-29 Coming Soon $625,000 Smart MLS
Property tax history
+2.0%/yrLatest (2022): $6,566 · -1.0% YoY. Source: county tax records.
Cash-flow waterfall
monthlySold comps — $/sqft
last 12 mo · ≤1 miLoading sold comps…