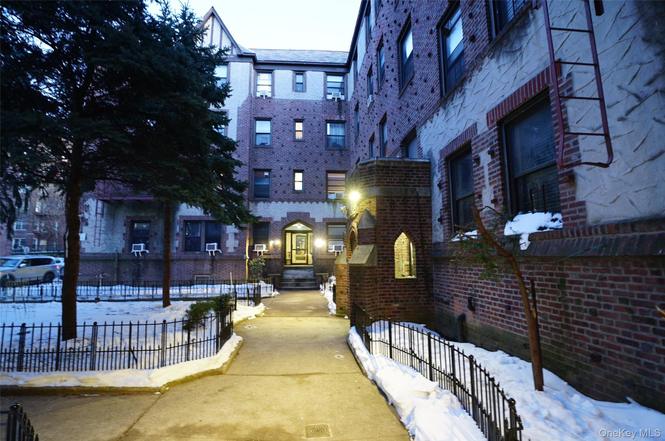
61-40 Saunders St Unit A12 · New York, NY
Flood risk 5/10 · Moderate
- FEMA flood zone
- X (unshaded)
- Chance of flooding over 30 yrs
- 0.24%
- Est. flood insurance / yr
- $507 – $1,088
Fire risk 1/10 · Minimal
- Est. fire insurance / yr
- $691 – $1,283
Heat risk 7/10 · Major
- Hot days now (above 99°F)
- 7 days/yr
- Hot days in 30 yrs
- 15 days/yr
Wind risk 6/10 · Moderate
- Chance of severe wind over 30 yrs
- 27.0%
Air-quality risk 5/10 · Moderate
- Unhealthy air days now
- 6 days/yr
- Unhealthy air days in 30 yrs
- 8 days/yr
Risk factors via First Street. Map © Google.
Why this score? — see what drove the F grade
The composite is a weighted blend of 9 inputs, each scored 0–100. Each bar is that input's sub-score; the figure is the points it added to the 100-point composite (weight × sub-score).
- ARV discount +7.5/15.0
- 1% rule +5.0/10.0
- Schools +5.0/10.0
- Livability +3.8/5.0
- Cash flow +3.6/30.0
- Rent growth +2.9/5.0
- Condition / age +2.5/5.0
- DSCR +0.0/10.0
- Appreciation +0.0/10.0
$268,000
🖨 Deal sheet 📄 Offer letter ✓ Due diligence
Listing remarks
A garden-style building located on a tranquil, tree-lined street in the heart of Rego Park. The unit is on the 2nd Floor with approximately 800 square feet. Conveniently close to Costco and Macy's Shopping Mall. Walking distance to the M & R subway lines. Suitable for both rental income and owner occupancy, a great option for either living or investment. Located in the Prime 28 school district. Apartment can be sublet immediately, owners pay a 15% subletting fee on the maintenance charges.
Key facts
- Tree-lined street
- Built 1930
- Listed 135 days
Tags
Property features AI
Finance
- Other: Living area reported by appraiser
- Financial info: Financial details not provided
- HOA & community: HOA/maintenance details not provided
Exterior
- Parking: No carport; No designated parking
- Security: Security details not provided
- Utilities: Public sewer; Cable connected; Electricity connected; Natural gas connected; Sewer connected
- Home design: Stock cooperative; Entry level: 2; Two levels
- Construction: Brick construction; Year built not provided
- Exterior features: Brick construction; Not waterfront
Interior
- Kitchen: Gas range; Refrigerator
- Bedrooms: Two-level unit with rooms on two levels; Total of 3 rooms
- Flooring: Flooring details not provided
- Bathrooms: 1 full bathroom
- Heating & cooling: Steam heating; Wall/window air conditioning units
- Interior features: Eat-in kitchen; Entrance foyer; High ceilings; Finished basement
- Laundry & utility: Washer/dryer details not provided
Neighborhood map
What this means for you Summary
Snapshot
- This is a 1-bed/1.0-bath condo listed at $268k.
Deal economics
- At list price, monthly cash flow is $-793 ($-10k/yr) — negative.
- The deal already cash-flows at list — no discount required.
- To meet the 1% rule (rent ≥ 1% of price), the offer needs to be $268k (0.1% below list).
- Recommended offer: $236k (12.0% below list) — sets the bar for market timing.
Location & tenants
- Location reads 75/100 on livability (#268 in NY, #4,188 nationally) — a middle-class / working-renter tenant base. Strengths: amenities A+, commute A+, health & safety A; Watch: crime F, cost of living F.
- Market conditions: Rents rising (+1.7%/yr); 345 active listings in the ZIP; 40 comparable units currently listed for rent nearby; rentals at typical pace (median 17d on market — plan ~3-4 weeks tenant-placement turnaround); solid renter incomes; 5,302 units permitted in Queens County in 2024 (4,918 in 5+ unit buildings).
- This rent runs 35% of the median local income ($91k/yr) — at the standard rent-burdened threshold; future hikes will face affordability resistance.
Forward outlook
- Local home prices are declining (-3.0%/yr); year-one equity from $2k of loan paydown is wiped out by about $8k of value loss. Plan a longer hold.
- Queens County population projected at +16% by 2050 — long-run rental-demand tailwind backs the buy-and-hold thesis.
Negotiation context
- It's been on market 135 days — a 12% lower offer ($236k) is reasonable based on typical stale-listing flexibility.
Risks & watch-outs
- Watch-outs: HOA is 39% of rent; built in 1930 — expect roof / HVAC / electrical / plumbing capex.
- Climate carrying-cost: moderate flood risk; major wind risk, 27% chance of damaging wind over 30y; extreme-heat days projected 7→15/yr by 2055 (HVAC capex compounding) — expect insurance premiums to compound above CPI over the hold.
Questions for the listing agent
- What do current leases actually rent for vs. the listed asking? Can we see a recent rent roll and the last 12 months of T-12 income?
- It's been on market 135 days. Have you received any prior offers? Is the seller open to a 12% concession, seller financing, or rate buy-down credit?
- Built in 1930 — when were the roof, HVAC, electrical panel, plumbing, and water heater last replaced?
- What does the HOA fee cover, when was the last increase, and are there any pending special assessments or reserve-fund shortfalls?
- Any open or pending special assessments — roof, HVAC, plumbing, elevator, façade? What's the per-unit balance and payoff schedule, and is the seller paying it off at close or rolling it to the buyer?
- Why hasn't it sold? Are there any deal-killer items the seller is aware of (foundation, flood, title, zoning, code violations)?
- Is there a deadline driving the sale (1031 exchange, divorce, estate, relocation)? That informs how much negotiation room exists.
- Schools are B-rated — typically a magnet for longer-tenancy family renters. What's the average tenant stay here, and is there a school-zone premium baked into asking?
- Crime grade is F in this area — have there been break-ins, vandalism, or insurance claims at this property in the last 3 years? What carrier currently insures it and at what premium?
- The area grade is low — what's the realistic commute time and amenity access for the typical tenant pool here? Any planned neighborhood developments (good or bad) we should know about?
- What's the average days-on-market for RENTAL listings here right now (not sales)? A rising rental-DOM trend means longer vacancies and softer asking-rent achievability than the comps imply.
- What's the recent tenant-quality profile in this submarket — average credit score on applications, eviction rate, late-payment / NSF rate, and stable-employment percentage? A property-management company in the area should have these aggregated.
- How much new apartment / multifamily construction is in the pipeline within 1–3 miles? Heavy new supply (>2% of stock underway) typically softens rents 12–24 months out; light construction supports rent growth.
Investment metrics
- 1% rule
- 1.00% ✗
- Cap rate
- 2.74%
- Cash-on-cash
- -12.68%
- DSCR
- 0.44
- GRM
- 8.3
CMA / ARV
No comps found within radius.
Projected returns pro-forma
-3.0% appreciation · 1.74% rent growth · sell at horizon
- IRR
- -42.0%
- Equity multiple
- -0.29×
- Total profit
- $-96,593
- Equity at exit
- $39,960
- IRR
- -86.0%
- Equity multiple
- -1.13×
- Total profit
- $-159,753
- Equity at exit
- $23,172
Cash invested: $75,040 (down + closing). Projections, not guarantees.
Landlord ↔ Tenant lean methodology
- Overall (CITY)
- 0 Strongly Tenant-Friendly
- State New York
- 15 Strongly Tenant-Friendly · D+10
- County
- — inherits STATE
- City New York
- 0 Strongly Tenant-Friendly · D+34
ZIP-level market 11374
- Rents YoY
- 1.7%
- Active inventory
- 345
- Price-to-rent
- 8.3×
Monthly cashflow live
- Estimated rent
- $2,677 high interval (Pro) →
- Mortgage (P&I)
- −$1,405
- Tax est. 1.5%
- −$335 /mo · $4,020/yr
- Insurance
- −$112
- HOA est. from 1 same-building comp
- −$1,056
- Vacancy / Maint / Mgmt
- −$562
- Net cashflow
- $-793
Break-even live
UW: 25.0% down · 7.5% · 30yr · 1.5% tax · 5.0% vac · 8.0% maint · 8.0% mgmt
Financing live
Cash to close
- Down payment
- $67,000
- Closing costs
- $8,040
- Reserves months
- —
- Total cash needed
- —
Loan-product check · same deal, 3 products live
Conventional
25% down · 7.5% · 30yr
- Down + closing
- —
- Monthly P&I
- —
- Monthly cashflow
- —
- DSCR
- —
- Eligible?
- —
Personal DTI + credit; lowest rate.
DSCR
20% down · 8.5% · 30yr
- Down + closing
- —
- Monthly P&I
- —
- Monthly cashflow
- —
- DSCR
- —
- Eligible?
- —
No personal income docs; deal must DSCR.
Hard money
10% down · 12.0% · 12mo
- Down + closing
- —
- Monthly P&I
- —
- Monthly cashflow
- —
- DSCR
- —
- Eligible?
- —
Short-term bridge; refi at stabilization.
Rent comps 40 comps
| Address | Beds | Baths | Sqft | Rent | $/sqft | DOM | Units | Dist |
|---|---|---|---|---|---|---|---|---|
| 6347 Booth St Unit 3C Rego Park, NY | 1.0 | 1.0 | 700 | $3,400 | $4.86 | 24d | 1 | 0.26mi |
| 86-16 60th Ave Unit 1K Queens, NY | 1.0 | 1.0 | 750 | $2,300 | $3.07 | 24d | 1 | 0.27mi |
| 9430 58th Ave Unit 3A Elmhurst, NY | — | 1.0 | 530 | $1,800 | $3.40 | 10d | 1 | 0.34mi |
| 6125 97th St Unit 4D Rego Park, NY | — | 1.0 | 650 | $2,300 | $3.54 | 4d | 1 | 0.36mi |
| 9710 62nd Dr Unit 9F Rego Park, NY | 1.0 | 1.0 | 750 | $2,700 | $3.60 | 3d | 1 | 0.38mi |
| 9707 63rd Rd Unit 15B Rego Park, NY | 1.0 | 1.0 | 700 | $2,300 | $3.29 | 1d | 1 | 0.39mi |
| 9725 64th Ave Rego Park, NY | 1.0 | 1.0 | 760 | $1,800 | $2.37 | 18d | 1 | 0.44mi |
| 6155 98th St Unit 8B Rego Park, NY | 1.0 | 1.0 | 700 | $2,500 | $3.57 | 4d | 1 | 0.48mi |
| 9810 64th Ave Unit 3A Rego Park, NY | 1.0 | 1.0 | 850 | $2,450 | $2.88 | 2d | 1 | 0.52mi |
| 6145 98th St Rego Park, NY | 1.0–3.0 | 1.0 | 825 | $2,500 | $3.03 | 24d | 3 | 0.52mi |
| 6145 98th St Rego Park, NY | 1.0–3.0 | 1.0 | 825 | $2,350 | $2.85 | 2d | 3 | 0.52mi |
| 9810 64th Ave Rego Park, NY | 1.0 | 1.0 | 825 | $2,125 | $2.58 | 17d | 2 | 0.52mi |
| 97-12 65th Rd Unit 4-C Rego Park, NY | 1.0 | 1.0 | 650 | $3,350 | $5.15 | 5d | 1 | 0.55mi |
| 9825 64th Rd Unit 8F Rego Park, NY | 2.0 | 1.0 | 850 | $2,400 | $2.82 | 1d | 1 | 0.56mi |
| 97-12 65th Rd Apt 5D Rego Park, NY | 1.0 | 1.0 | 800 | $3,395 | $4.24 | 5d | 1 | 0.59mi |
| 63127 Fitchett St Rego Park, NY | 1.0 | 1.0 | 900 | $2,800 | $3.11 | 1d | 1 | 0.61mi |
| 63-127 Fitchett St Unit 1FL Rego Park, NY | 2.0 | 1.0 | 1100 | $3,800 | $3.45 | 1d | 1 | 0.61mi |
| 9876 Queens Blvd Unit 3A Rego Park, NY | 1.0 | 1.0 | 820 | $2,900 | $3.54 | 24d | 1 | 0.69mi |
| 9941 64th Ave Rego Park, NY | 1.0–2.0 | 1.0 | 975 | $2,400 | $2.46 | 18d | 2 | 0.70mi |
| 66-01 Burns St Apt 3v Rego Park, NY | 1.0 | 1.0 | 820 | $2,300 | $2.80 | 20d | 1 | 0.70mi |
| 98-81 Queens Blvd Unit 15E Rego Park, NY | 1.0 | 1.0 | 700 | $3,335 | $4.76 | 5d | 1 | 0.71mi |
| 98-81 Queens Blvd Unit 14K Rego Park, NY | 2.0 | 2.0 | 950 | $4,490 | $4.73 | 12d | 1 | 0.71mi |
| 6620 Wetherole St Rego Park, NY | 1.0–2.0 | 1.0–2.0 | 700 | $2,400 | $3.43 | 24d | 2 | 0.72mi |
| 102-06 63rd Ave #2 Queens, NY | 2.0 | 1.0 | 1000 | $3,000 | $3.00 | 24d | 1 | 0.72mi |
| 6615 Thornton Pl Rego Park, NY | 1.0 | 1.0 | 700 | $2,672 | $3.82 | 4d | 3 | 0.76mi |
| 102-45 62nd Rd Unit 7J Forest Hills, NY | 1.0 | 1.0 | 770 | $2,950 | $3.83 | 24d | 1 | 0.78mi |
| 54-40 80th St Unit 1 Elmhurst, NY | 2.0 | 2.0 | 956 | $3,000 | $3.14 | 24d | 1 | 0.80mi |
| 5440 80th St Elmhurst, NY | 2.0 | 2.0 | 996 | $3,000 | $3.01 | 2d | 1 | 0.80mi |
| 67-13 Austin St Unit 2A Flushing, NY | 1.0 | 1.0 | 600 | $2,595 | $4.33 | 16d | 1 | 0.83mi |
| 67-19 Austin St Unit 4C Flushing, NY | 2.0 | 1.0 | 800 | $3,500 | $4.38 | 13d | 1 | 0.84mi |
| 10025 Queens Blvd Unit 3M Forest Hills, NY | 2.0 | 1.0 | 925 | $2,900 | $3.14 | 24d | 1 | 0.86mi |
| 10010 67th Rd Unit 6L Forest Hills, NY | 1.0 | 1.0 | 845 | $2,700 | $3.20 | 21d | 1 | 0.86mi |
| 6405 Yellowstone Blvd Unit 403S Forest Hills, NY | 1.0 | 1.0 | 720 | $3,100 | $4.31 | 24d | 1 | 0.88mi |
| 6405 Yellowstone Blvd Flushing, NY | 1.0 | 1.0–1.5 | 920 | $3,075 | $3.34 | 24d | 2 | 0.88mi |
| 102-39 66th Ave Unit 1 Flushing, NY | 2.0 | 1.0 | 981 | $3,000 | $3.06 | 1d | 1 | 0.91mi |
| 6739 Clyde St Ph -H Forest Hills, NY | 2.0 | 2.0 | 1100 | $4,100 | $3.73 | 24d | 1 | 0.91mi |
| 6725 Dartmouth St Unit 3L Forest Hills, NY | 2.0 | 1.0 | 800 | $2,700 | $3.38 | 24d | 1 | 0.92mi |
| 6435 Yellowstone Blvd Unit 6G Forest Hills, NY | — | 1.0 | 575 | $1,900 | $3.30 | 18d | 1 | 0.92mi |
| 10525 65th Ave Unit 4F Forest Hills, NY | 2.0 | 1.0 | 980 | $3,998 | $4.08 | 14d | 1 | 0.93mi |
| 6750 Thornton Pl Unit 2U Forest Hills, NY | — | 1.0 | 550 | $1,900 | $3.45 | 7d | 1 | 0.94mi |
HOA detail condo
- Monthly dues
- $0 · $0/yr
- Assessments
- None detected in remarks — confirm with the listing agent.
Listing history 11 events
-
2026-06-18days on market $268,000 Active 135 DOM
-
2026-06-17days on market $268,000 Active 134 DOM
-
2026-06-15days on market $268,000 Active 132 DOM
-
2026-06-13days on market $268,000 Active 130 DOM
-
2026-06-10days on market $268,000 Active 126 DOM
-
2026-06-08days on market $268,000 Active 125 DOM
-
2026-06-04days on market $268,000 Active 121 DOM
-
2026-06-03days on market $268,000 Active 120 DOM
-
2026-06-01days on market $268,000 Active 118 DOM
-
2026-05-31days on market $268,000 Active 117 DOM
-
2026-02-01$268,000 Active
ⓘ Source: listings_history table (triggers on properties + properties_extension) + one-shot
backfill from property_details.listing_events for pre-trigger history.
Climate risk First Street
- Flood 5/10 Major FEMA zone X (unshaded) · 24% chance over 30 yrs
- Wildfire 1/10 Low
- Heat 7/10 Severe 7 d/yr ≥99°F today · 15 d/yr by 30 yrs out
- Wind 6/10 Major 27% chance of damaging wind over 30 yrs
- Air quality 5/10 Major 6 unhealthy d/yr today · 8 by 30 yrs out
Nearby sold comps map
Loading sold comps map…
Walkable amenities ~0.75 mi
Loading nearby amenities…
Taxation est. · year 1
- Rental income
- $32,129
- − Mortgage interest
- −$15,012
- − Property taxes
- −$4,020
- − Insurance
- −$1,340
- − Repairs & maintenance
- −$2,570
- − Management
- −$2,570
- − HOA
- −$12,672
- − Depreciation
- −$7,796
- Taxable loss
- −$13,852
- Est. tax savings @ 24.0%
- +$3,325
- After-tax cash flow
- $-6,191/yr
For passive investors: Depreciation is non-cash, so a rental often shows a tax loss while cash-flowing — sheltering income. Rental losses are passive: they offset passive income freely, and up to $25,000/yr can offset ordinary (W-2) income if you actively participate and your MAGI is under $100k (phasing out to $0 by $150k); unused losses carry forward. On sale, claimed depreciation is recaptured at up to 25%, and gains may owe capital-gains tax (a 1031 exchange can defer both). Figures are a year-1 estimate at your 24.0% rate — not tax advice; consult a CPA.
Schools (NCES district)
No district data.
Livability — New York
- Score
- 75/100
- State rank
- #268
- US rank
- #4188
Category grades
Schools grade is shown separately in the Schools card above.
Census & demographics
- Census place
- New York, NY
- County
- Queens County · 1,914,869 people
- City population
- 7,731,280
- Metro
- New York-Newark-Jersey City, NY-NJ-PA
- Population (ZIP)
- 46,989
- Household income
- $90,631
- Rent vs Own
- Severe rent burden
- 3149.0
Population outlook (Queens County) Hauer SSP2
- Today (2025)
- 2,546,320 people
- By 2030
- 2,643,059 · +3.8%
- By 2040
- 2,815,563 · +10.6%
- By 2050
- 2,944,423 · +15.6%
- By 2075
- 3,123,338 · +22.7%
- By 2100
- 3,098,688 · +21.7%
Race, ethnicity, and origin ACS 2023
- Neighborhood character
- Highly diverse neighborhood (Simpson 0.72)
- Race & ethnicity
- White 38% Asian 29% Hispanic / Latino 22% Two or more races 13% Black 4%
- Hispanic origin (detail)
- Mexican 1% Puerto Rican 3% Dominican 3%
- Common ancestry
- Scotch-Irish 6% Romanian 2% Subsaharan African 1%
- Foreign-born
- 54% · Canada, China, Jamaica
- Languages at home
- 28% English-only · Spanish 18% Russian/Polish/Slavic 15% Chinese 13%
Political lean MEDSL · Queens
- 2024 margin
- Strong D (+24.6) · D 62.3% · R 37.7%
- 2008→2024 swing
- -26.2pp toward R · 2008: 50.8pp · 2024: 24.6pp
- All cycles
- 2024: D+24.6 2020: D+45.2 2016: D+53.4 2012: D+58.5 2008: D+50.8
Not yet ingested
- Civics
- —
Market trends
- HPI YoY
- ▼ -163.20%
- Current HPI
- 207.1869
- Rent YoY
- ▲ 1.74%
- Metro
- New York-Newark-Jersey City, NY-NJ-PA
- State GDP YoY
- ▲ 2.60%
- F500 in state
- 92
Industry mix (Fortune 500 HQ in NY)
| Industry | F500 HQs | Revenue |
|---|---|---|
| Financial Services | 10 | $950B |
|
||
| Consumer Goods | 9 | $162B |
|
||
| Insurance | 4 | $225B |
|
||
| Telecommunications | 2 | $144B |
|
||
| Pharmaceuticals | 2 | $112B |
|
||
| Media / Entertainment | 2 | $69B |
|
||
Price history
1 event — show timeline
- 2026-02-01 Listed $268,000 OneKey® MLS as Distributed by MLS Grid
Cash-flow waterfall
monthlySold comps — $/sqft
last 12 mo · ≤1 miLoading sold comps…