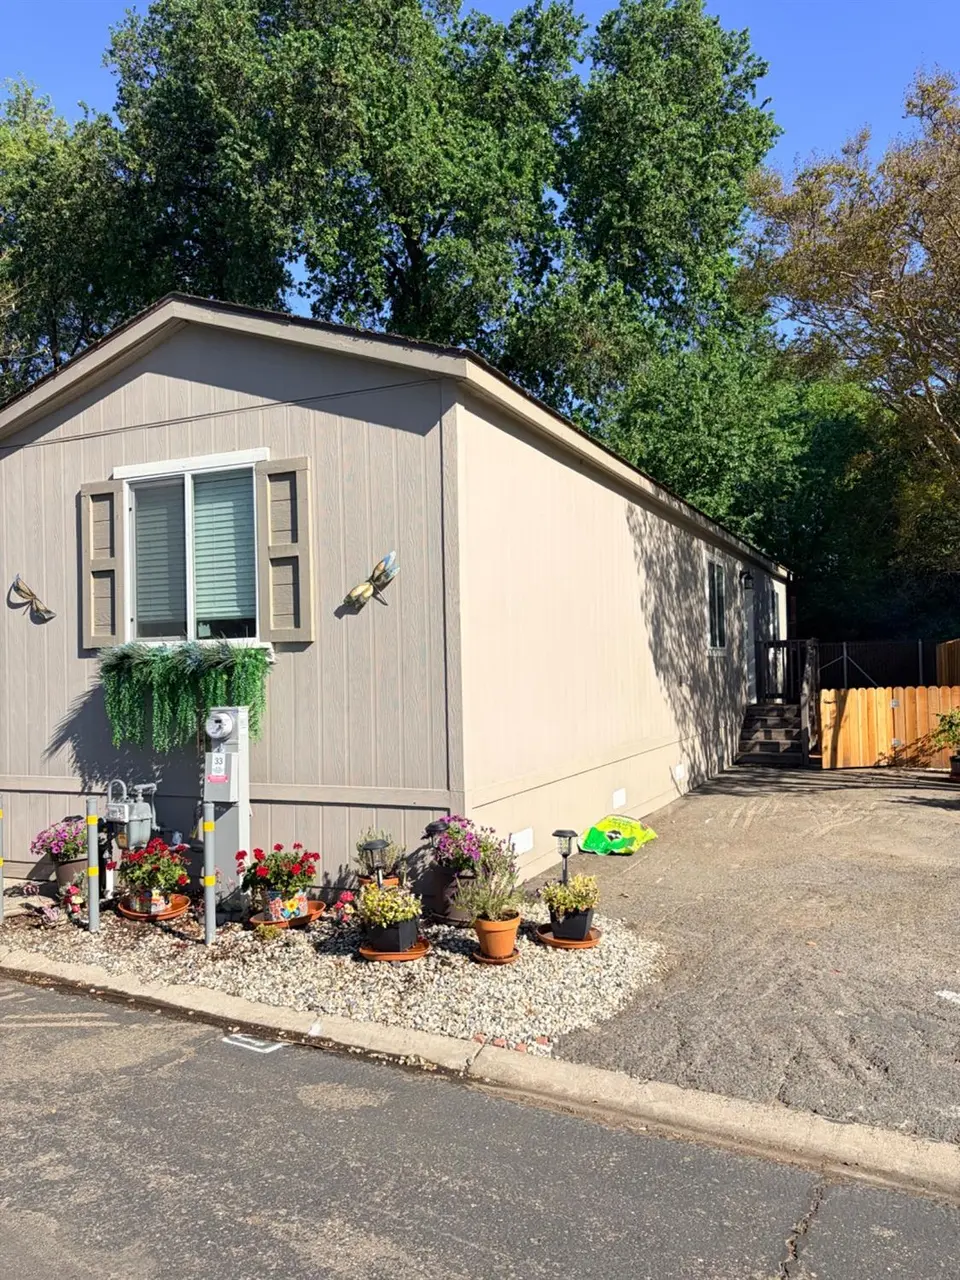
1050 West Capitol Ave #33 · West Sacramento, CA
Flood risk 7/10 · Major
- FEMA flood zone
- —
- Chance of flooding over 30 yrs
- 0.77%
- Est. flood insurance / yr
- —
Fire risk 1/10 · Minimal
- Est. fire insurance / yr
- $659 – $1,223
Heat risk 7/10 · Major
- Hot days now (above 103°F)
- 7 days/yr
- Hot days in 30 yrs
- 15 days/yr
Wind risk 1/10 · Minimal
- Chance of severe wind over 30 yrs
- —
Air-quality risk 10/10 · Severe
- Unhealthy air days now
- 27 days/yr
- Unhealthy air days in 30 yrs
- 33 days/yr
Risk factors via First Street. Map © Google.
Why this score? — see what drove the B grade
The composite is a weighted blend of 9 inputs, each scored 0–100. Each bar is that input's sub-score; the figure is the points it added to the 100-point composite (weight × sub-score).
- Cash flow +30.0/30.0
- 1% rule +10.0/10.0
- DSCR +10.0/10.0
- ARV discount +7.5/15.0
- Condition / age +4.0/5.0
- Schools +3.8/10.0
- Livability +3.7/5.0
- Rent growth +3.0/5.0
- Appreciation +0.0/10.0
$124,900
🖨 Deal sheet 📄 Offer letter ✓ Due diligence
Listing remarks
Welcome to this beautifully maintained 2023-built mobile home in West Sacramento! This charming 2-bedroom, 1-bath residence features a bright open-concept layout, perfect for comfortable everyday living and entertaining. The home offers a private fenced yard, ideal for relaxing or outdoor gatherings, along with added security and peace of mind with an installed security camera system. Residents enjoy access to community amenities including a clubhouse and sparkling pool. Conveniently located just minutes from Old Sacramento, with easy access to Davis and the Yolo Bypass Wildlife Area, this home offers the perfect blend of comfort, convenience, and lifestyle. Don't miss this move-in ready op
Key facts
- Clubhouse
- Community amenities
- Easy access to davis
Tags
Property features AI
Finance
- Other: Located in West Sacramento, CA (95691); Address: 1050 West Capitol Ave #33
- HOA & community: No homeowners association; Not a senior community; Land lease: No (listed land lease amount present)
Exterior
- Parking: Off-street parking
- Utilities: Cable available; Natural gas connected; 220V in laundry; Public water; Public sewer
- Home design: Manufactured in-park home; Single wide; Built in 2023
- Construction: Clayton manufactured home; Wood skirt; Composition roof; Built on foundation suitable for manufactured homes
- Exterior features: Fenced yard; Front landscaping; Close to clubhouse
Interior
- Kitchen: Free-standing gas range; Dishwasher; Microwave; Kitchen island
- Bedrooms: 2 bedrooms
- Flooring: Carpet; Laminate; Wood
- Bathrooms: 1 full bathroom with tub/shower combo
- Heating & cooling: Central heating (natural gas); Central cooling and wall unit(s)
- Interior features: Dual-pane full windows; Porch steps; Great room living area; Kitchen island; Breakfast nook and dining bar
- Laundry & utility: Washer and dryer included (stacked, inside laundry room)
Neighborhood map
What this means for you Summary
Snapshot
- This is a 2-bed/1.0-bath manufactured listed at $125k. Condition is rated good.
Deal economics
- At list price, monthly cash flow is $1k ($12k/yr) — positive.
- The deal already cash-flows at list — no discount required.
- Meets the 1% rule at list price ($2k rent vs $125k).
- Recommended offer: $117k (6.0% below list) — sets the bar for market timing.
Location & tenants
- Location reads 73/100 on livability (#164 in CA) — a middle-class / working-renter tenant base. Strengths: housing A+, commute A, employment A-; Watch: cost of living F.
- Washington Unified (suburban): math 30% / reading 57% proficiency, ranked #197 of 517 in CA (top 38%) — families likely to look elsewhere, expect single-tenant / working-renter base with shorter leases.
- Market conditions: Rents rising (+1.9%/yr); 151 active listings in the ZIP; 12 comparable units currently listed for rent nearby; rentals leasing fast (median 5d on market — plan ~1-2 weeks tenant-placement turnaround); 42% of comp listings sitting > 30 days — soft ceiling on asking rent; solid renter incomes; 721 units permitted in Yolo County in 2024 (260 in 5+ unit buildings).
Forward outlook
- Local home prices are declining (-3.0%/yr); year-one equity from $864 of loan paydown is wiped out by about $4k of value loss. Plan a longer hold.
- Yolo County population projected at +31% by 2050 — long-run rental-demand tailwind backs the buy-and-hold thesis.
- At projected returns (-3.0% appreciation + 1.9% rent growth), your $35k cash investment doubles in ~4 years — after that, you're playing with house money.
Negotiation context
- It's been on market 89 days — a 6% lower offer ($117k) is reasonable based on typical stale-listing flexibility.
Risks & watch-outs
- Climate carrying-cost: major flood risk; extreme-heat days projected 7→15/yr by 2055 (HVAC capex compounding) — expect insurance premiums to compound above CPI over the hold.
Questions for the listing agent
- It's been on market 89 days. Have you received any prior offers? Is the seller open to a 6% concession, seller financing, or rate buy-down credit?
- Why hasn't it sold? Are there any deal-killer items the seller is aware of (foundation, flood, title, zoning, code violations)?
- Is there a deadline driving the sale (1031 exchange, divorce, estate, relocation)? That informs how much negotiation room exists.
- What's the average days-on-market for RENTAL listings here right now (not sales)? A rising rental-DOM trend means longer vacancies and softer asking-rent achievability than the comps imply.
- What's the recent tenant-quality profile in this submarket — average credit score on applications, eviction rate, late-payment / NSF rate, and stable-employment percentage? A property-management company in the area should have these aggregated.
- How much new for-sale + rental construction is in the pipeline within 1–3 miles? Heavy new supply typically softens prices + rents 12–24 months out; constrained supply supports both.
Investment metrics
- 1% rule
- 1.91% ✓
- Cap rate
- 16.09%
- Cash-on-cash
- 34.97%
- DSCR
- 2.56
- GRM
- 4.4
CMA / ARV
No comps found within radius.
Projected returns pro-forma
-3.0% appreciation · 1.87% rent growth · sell at horizon
- IRR
- 29.2%
- Equity multiple
- 2.20×
- Total profit
- $42,037
- Equity at exit
- $18,623
- IRR
- 35.9%
- Equity multiple
- 4.13×
- Total profit
- $109,598
- Equity at exit
- $10,799
Cash invested: $34,972 (down + closing). Projections, not guarantees.
Landlord ↔ Tenant lean methodology
- Overall (STATE)
- 18 Strongly Tenant-Friendly
- State California
- 18 Strongly Tenant-Friendly · D+13
- County
- — inherits STATE
- City
- — inherits STATE
ZIP-level market 95691
- Home prices YoY
- -35.0%
- Rents YoY
- 1.9%
- Active inventory
- 151
- Price-to-rent
- 4.4×
Monthly cashflow live
- Estimated rent
- $2,383 high interval (Pro) →
- Mortgage (P&I)
- −$655
- Tax est. 1.5%
- −$156 /mo · $1,874/yr
- Insurance
- −$52
- HOA
- −$0
- Vacancy / Maint / Mgmt
- −$500
- Net cashflow
- $1,019
Break-even live
UW: 25.0% down · 7.5% · 30yr · 1.5% tax · 5.0% vac · 8.0% maint · 8.0% mgmt
Financing live
Cash to close
- Down payment
- $31,225
- Closing costs
- $3,747
- Reserves months
- —
- Total cash needed
- —
Loan-product check · same deal, 3 products live
Conventional
25% down · 7.5% · 30yr
- Down + closing
- —
- Monthly P&I
- —
- Monthly cashflow
- —
- DSCR
- —
- Eligible?
- —
Personal DTI + credit; lowest rate.
DSCR
20% down · 8.5% · 30yr
- Down + closing
- —
- Monthly P&I
- —
- Monthly cashflow
- —
- DSCR
- —
- Eligible?
- —
No personal income docs; deal must DSCR.
Hard money
10% down · 12.0% · 12mo
- Down + closing
- —
- Monthly P&I
- —
- Monthly cashflow
- —
- DSCR
- —
- Eligible?
- —
Short-term bridge; refi at stabilization.
Rent comps 12 comps
| Address | Beds | Baths | Sqft | Rent | $/sqft | DOM | Units | Dist |
|---|---|---|---|---|---|---|---|---|
| 777 5th St West Sacramento, CA | 2.0 | 1.0–2.0 | 878 | $10,000 | $11.38 | 1d | 15 | 0.57mi |
| 500 Douglas St West Sacramento, CA | 3.0 | 1.0–2.0 | 874 | $2,597 | $2.97 | 3d | 22 | 0.92mi |
| 1451 3rd St Sacramento, CA | 3.0 | 1.0–2.5 | 1044 | $2,717 | $2.60 | 4d | 1 | 1.11mi |
| 1900 3rd St Sacramento, CA | 2.0 | 1.0–2.0 | 687 | $2,999 | $4.36 | 43d | 1 | 1.16mi |
| 305 U St #100 Sacramento, CA | 1.0 | 1.0 | 500 | $1,400 | $2.80 | 43d | 1 | 1.24mi |
| 2115 3rd St Sacramento, CA | 1.0 | 1.0 | 700 | $1,800 | $2.57 | 43d | 1 | 1.25mi |
| 1421 5th St Sacramento, CA | 2.0 | 1.0–2.0 | 1040 | $4,171 | $4.01 | 1d | 45 | 1.27mi |
| 515 P St Sacramento, CA | 1.0 | 1.0 | 700 | $1,618 | $2.31 | 43d | 1 | 1.28mi |
| 609 Capitol Mall Sacramento, CA | 1.0 | 1.0 | 662 | $2,670 | $4.03 | 1d | 11 | 1.31mi |
| 1500 7th St Sacramento, CA | 2.0 | 1.0–2.0 | 833 | $3,038 | $3.64 | 3d | 29 | 1.32mi |
| 601 T St Unit 2 Sacramento, CA | 1.0 | 1.0 | 484 | $1,600 | $3.31 | 43d | 1 | 1.40mi |
| 230 Broadway Sacramento, CA | 1.0–2.0 | 1.0–2.0 | 722 | $2,170 | $3.00 | 2d | 29 | 1.40mi |
Listing history 16 events
-
2026-06-19days on market $124,900 Active 89 DOM
-
2026-06-18days on market $124,900 Active 88 DOM
-
2026-06-17days on market $124,900 Active 87 DOM
-
2026-06-16days on market $124,900 Active 86 DOM
-
2026-06-15days on market $124,900 Active 85 DOM
-
2026-06-14days on market $124,900 Active 83 DOM
-
2026-06-12days on market $124,900 Active 82 DOM
-
2026-06-09days on market $124,900 Active 79 DOM
-
2026-06-08days on market $124,900 Active 78 DOM
-
2026-06-07days on market $124,900 Active 77 DOM
-
2026-06-07days on market $124,900 Active 76 DOM
-
2026-06-04days on market $124,900 Active 73 DOM
-
2026-06-02days on market $124,900 Active 72 DOM
-
2026-06-01days on market $124,900 Active 71 DOM
-
2026-05-31remarks 699-char remark
-
2026-05-31$124,900 Active 70 DOM
ⓘ Source: listings_history table (triggers on properties + properties_extension) + one-shot
backfill from property_details.listing_events for pre-trigger history.
Climate risk First Street
- Flood 7/10 Severe 77% chance over 30 yrs
- Wildfire 1/10 Low
- Heat 7/10 Severe 7 d/yr ≥103°F today · 15 d/yr by 30 yrs out
- Wind 1/10 Low
- Air quality 10/10 Extreme 27 unhealthy d/yr today · 33 by 30 yrs out
Nearby sold comps map
Loading sold comps map…
Walkable amenities ~0.75 mi
Loading nearby amenities…
Taxation est. · year 1
- Rental income
- $28,594
- − Mortgage interest
- −$6,996
- − Property taxes
- −$1,874
- − Insurance
- −$624
- − Repairs & maintenance
- −$2,288
- − Management
- −$2,288
- − Depreciation
- −$3,633
- Taxable income
- $10,891
- Est. tax owed @ 24.0%
- −$2,614
- After-tax cash flow
- $9,618/yr
For passive investors: Depreciation is non-cash, so a rental often shows a tax loss while cash-flowing — sheltering income. Rental losses are passive: they offset passive income freely, and up to $25,000/yr can offset ordinary (W-2) income if you actively participate and your MAGI is under $100k (phasing out to $0 by $150k); unused losses carry forward. On sale, claimed depreciation is recaptured at up to 25%, and gains may owe capital-gains tax (a 1031 exchange can defer both). Figures are a year-1 estimate at your 24.0% rate — not tax advice; consult a CPA.
Condition & rehab AI · 12 photos
This move-in ready mobile home in West Sacramento offers a good condition with modern amenities and a well-maintained exterior. It's located in a desirable area with easy access to Old Sacramento and community amenities.
Value-add opportunities
- Both landscaping — enhances curb appeal and adds value
- Both smart home integration — increases convenience and marketability
Renovation cost estimate screening
Value-add ROI direction
- Both landscaping — enhances curb appeal and adds value ↑
- Both smart home integration — increases convenience and marketability ↑
ⓘ Cost ranges are severity-bucket heuristics (US national rule-of-thumb). Get contractor quotes + a written scope before underwriting a rehab budget.
Schools (NCES district)
- District
- Washington Unified
- NCES district ID
- 0641580
- Math proficiency
- 30% ▼ -2.00%
- Reading proficiency
- 57% ▲ 12.00%
- Median HH income
- $55,207
- Composite
- 37.79/100
- National rank
- #4339
- State rank
- #197 of 517 in CA
Livability — West Sacramento
- Score
- 73/100
- State rank
- #164
- US rank
- #5389
Category grades
Schools grade is shown separately in the Schools card above.
Census & demographics
- Census place
- West Sacramento, CA
- County
- Yolo County · 212,115 people
- City population
- 55,039
- Metro
- Sacramento-Roseville-Folsom, CA
- Population (ZIP)
- 40,143
- Household income
- $104,750
- Rent vs Own
- Severe rent burden
- 1109.0
Population outlook (Yolo County) Hauer SSP2
- Today (2025)
- 242,183 people
- By 2030
- 257,662 · +6.4%
- By 2040
- 288,050 · +18.9%
- By 2050
- 318,202 · +31.4%
- By 2075
- 392,736 · +62.2%
- By 2100
- 438,150 · +80.9%
Race, ethnicity, and origin ACS 2023
- Neighborhood character
- Diverse neighborhood (Simpson 0.69)
- Race & ethnicity
- White 45% Hispanic / Latino 29% Two or more races 17% Asian 14% Black 3% Native American 1%
- Hispanic origin (detail)
- Mexican 24%
- Common ancestry
- Italian 4% Scotch-Irish 3% Lithuanian 2%
- Foreign-born
- 19% · Canada, China, Vietnam
- Languages at home
- 69% English-only · Spanish 15% Other Indo-European 6% Russian/Polish/Slavic 3%
Political lean MEDSL · Yolo
- 2024 margin
- Solid D (+36.2) · D 66.3% · R 30.1% · Other 3.6%
- 2008→2024 swing
- 0.0pp no change · 2008: 36.2pp · 2024: 36.2pp
- All cycles
- 2024: D+36.2 2020: D+41.4 2016: D+42.0 2012: D+33.2 2008: D+36.2
Not yet ingested
- Civics
- —
Market trends
- HPI YoY
- ▼ -170.47%
- Current HPI
- 316.9399
- Rent YoY
- ▲ 1.87%
- Metro
- Sacramento-Roseville-Folsom, CA
- State GDP YoY
- ▲ 3.21%
- F500 in state
- 116
Industry mix (Fortune 500 HQ in CA)
| Industry | F500 HQs | Revenue |
|---|---|---|
| Technology | 27 | $1,492B |
|
||
| Financial Services | 3 | $174B |
|
||
| Retail | 3 | $44B |
|
||
| Insurance | 3 | $26B |
|
||
| Media / Entertainment | 2 | $115B |
|
||
| Pharmaceuticals / Biotech | 2 | $62B |
|
||
Cash-flow waterfall
monthlySold comps — $/sqft
last 12 mo · ≤1 miLoading sold comps…