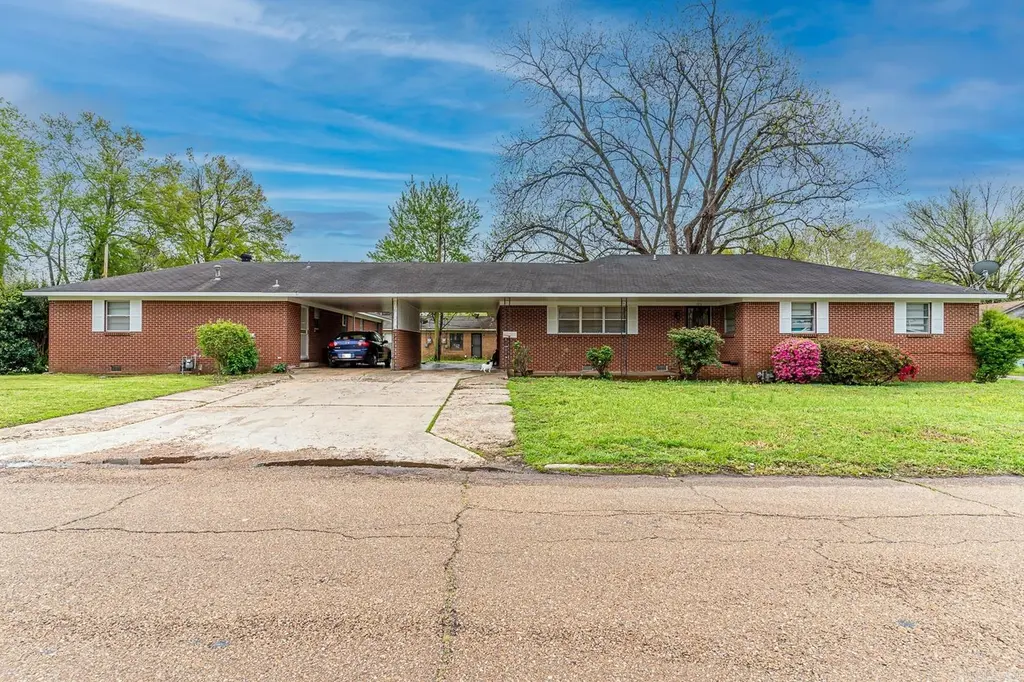
1047 N Rosser St · Forrest City, AR
Flood risk 1/10 · Minimal
- FEMA flood zone
- X
- Chance of flooding over 30 yrs
- 0.0%
- Est. flood insurance / yr
- $507 – $1,088
Fire risk 3/10 · Minor
- Est. fire insurance / yr
- $1,499 – $2,785
Heat risk 6/10 · Moderate
- Hot days now (above 109°F)
- 7 days/yr
- Hot days in 30 yrs
- 20 days/yr
Wind risk 4/10 · Minor
- Chance of severe wind over 30 yrs
- 14.0%
Air-quality risk 1/10 · Minimal
- Unhealthy air days now
- 0 days/yr
- Unhealthy air days in 30 yrs
- 0 days/yr
Risk factors via First Street. Map © Google.
Why this score? — see what drove the C grade
The composite is a weighted blend of 9 inputs, each scored 0–100. Each bar is that input's sub-score; the figure is the points it added to the 100-point composite (weight × sub-score).
- Cash flow +26.8/30.0
- DSCR +9.2/10.0
- 1% rule +7.2/10.0
- ARV discount +3.3/15.0
- Livability +3.0/5.0
- Rent growth +2.5/5.0
- Condition / age +2.2/5.0
- Appreciation +1.6/10.0
- Schools +0.9/10.0
$114,900
🖨 Deal sheet (PDF) 📄 Offer letter ✓ Due diligence
Listing remarks MLS
Welcome to Market 1047 N Rosser St. & 122 E Arkansas Ave. of Forrest City, Arkansas. Opportunity Knocks! Here is your chance to house hack with one side rented and one side vacant or secure a second tenant. Situated on a . 34 +/- corner lot, are 2 all brick houses for the price of 1. Unit 1 has 3 beds, 1 bath, Unit 2 has 3 beds, 1.5 baths. Both units are 1,736 sf. Current tenant pays $750 per month, utilities, and maintains lawn. Conveniently located near favorite local amenities and within walking distance to the school. Just 20 minutes to Wynne, AR and 45 minutes to Memphis, TN. Call today to make a double investment in tomorrow.
Key facts
- All brick houses
- Corner lot
- Near local amenities
Tags
Neighborhood map
What this means for you Summary
Snapshot
- This is a 6-bed/2.5-bath condo listed at $115k. Condition is rated fair.
Deal economics
- At list price, monthly cash flow is $314 ($4k/yr) — positive.
- The deal already cash-flows at list — no discount required.
- Meets the 1% rule at list price ($1k rent vs $115k).
- Recommended offer: $108k (6.0% below list) — sets the bar for market timing.
Location & tenants
- Location reads 59/100 on livability (#297 in AR) — a working-class tenant base; expect higher turnover. Strengths: cost of living A+, health & safety A+, housing A-; Watch: schools F, crime F, amenities F.
- Forrest City School District (town): math 12% / reading 11% proficiency, ranked #230 of 238 in AR (top 97%) — low school quality limits family demand, transient renter base, plan for 1-2y turnover; 93% free/reduced lunch — lower-income household profile, screen leases tightly.
- Market conditions: 66 active listings in the ZIP; 3 units permitted in St. Francis County in 2024 (0 in 5+ unit buildings).
Forward outlook
- Local home prices are declining (-3.0%/yr); year-one equity from $794 of loan paydown is wiped out by about $3k of value loss. Plan a longer hold.
- St. Francis County population projected at -21% by 2050 — secular population decline; favor cash flow + early exit over multi-decade hold.
- At projected returns (-3.0% appreciation + 3.0% rent growth), your $32k cash investment doubles in ~10 years — after that, you're playing with house money.
Negotiation context
- It's been on market 76 days — a 6% lower offer ($108k) is reasonable based on typical stale-listing flexibility.
- 7 sale attempts with the ask held roughly flat each time — persistent listings suggest the price (not the market) is what's stuck; bring a comps-based counter.
Risks & watch-outs
- Climate carrying-cost: extreme-heat days projected 7→20/yr by 2055 (HVAC capex compounding) — expect insurance premiums to compound above CPI over the hold.
Questions for the listing agent
- It's been on market 76 days. Have you received any prior offers? Is the seller open to a 6% concession, seller financing, or rate buy-down credit?
- Have any recent inspections been done? Can we get a copy of the seller's disclosures and any deferred-maintenance estimates?
- Any open or pending special assessments — roof, HVAC, plumbing, elevator, façade? What's the per-unit balance and payoff schedule, and is the seller paying it off at close or rolling it to the buyer?
- Why hasn't it sold? Are there any deal-killer items the seller is aware of (foundation, flood, title, zoning, code violations)?
- Is there a deadline driving the sale (1031 exchange, divorce, estate, relocation)? That informs how much negotiation room exists.
- Schools are F-rated, which usually means shorter tenancies and higher turnover. Who's the typical renter profile here, and what's been the actual vacancy rate?
- Crime grade is F in this area — have there been break-ins, vandalism, or insurance claims at this property in the last 3 years? What carrier currently insures it and at what premium?
- What's the average days-on-market for RENTAL listings here right now (not sales)? A rising rental-DOM trend means longer vacancies and softer asking-rent achievability than the comps imply.
- What's the recent tenant-quality profile in this submarket — average credit score on applications, eviction rate, late-payment / NSF rate, and stable-employment percentage? A property-management company in the area should have these aggregated.
- How much new apartment / multifamily construction is in the pipeline within 1–3 miles? Heavy new supply (>2% of stock underway) typically softens rents 12–24 months out; light construction supports rent growth.
Investment metrics
- 1% rule
- 1.22% ✓
- Cap rate
- 9.57%
- Cash-on-cash
- 11.71%
- DSCR
- 1.52
- GRM
- 6.8
CMA / ARV
- ARV (median comp)
- $105,011
- List price
- $114,900
- Delta
- 9.42%
- Verdict
- FAIR
- Comps
- 1 within 2.0 mi
Projected returns pro-forma
-3.0% appreciation · 3.0% rent growth · sell at horizon
- IRR
- 1.1%
- Equity multiple
- 1.04×
- Total profit
- $1,395
- Equity at exit
- $17,132
- IRR
- 10.8%
- Equity multiple
- 1.84×
- Total profit
- $27,043
- Equity at exit
- $9,934
Cash invested: $32,172 (down + closing). Projections, not guarantees.
Landlord ↔ Tenant lean methodology
- Overall (STATE)
- 92 Strongly Landlord-Friendly
- State Arkansas
- 92 Strongly Landlord-Friendly · R+14
- County
- — inherits STATE
- City
- — inherits STATE
ZIP-level market 72335
- Home prices YoY
- -4.9%
- Active inventory
- 66
- Price-to-rent
- 6.8×
Monthly cashflow live
- Estimated rent
- $1,402 medium interval (Pro) →
- Mortgage (P&I)
- −$603
- Tax est. 1.5%
- −$144 /mo · $1,724/yr
- Insurance
- −$48
- HOA
- −$0
- Vacancy / Maint / Mgmt
- −$295
- Net cashflow
- $314
Break-even live
Sensitivity live
| Price | -10% $393 | -5% $354 | +0% $314 | +5% $274 | +10% $234 |
|---|---|---|---|---|---|
| Rent | -10% $203 | -5% $258 | +0% $314 | +5% $369 | +10% $425 |
| Rate | -1.0pp $372 | -0.5pp $343 | base $314 | +0.5pp $284 | +1.0pp $254 |
UW: 25.0% down · 7.5% · 30yr · 1.5% tax · 5.0% vac · 8.0% maint · 8.0% mgmt
Financing live
Cash to close
- Down payment
- $28,725
- Closing costs
- $3,447
- Reserves months
- —
- Total cash needed
- —
Loan-product check · same deal, 3 products live
Conventional
25% down · 7.5% · 30yr
- Down + closing
- —
- Monthly P&I
- —
- Monthly cashflow
- —
- DSCR
- —
- Eligible?
- —
Personal DTI + credit; lowest rate.
DSCR
20% down · 8.5% · 30yr
- Down + closing
- —
- Monthly P&I
- —
- Monthly cashflow
- —
- DSCR
- —
- Eligible?
- —
No personal income docs; deal must DSCR.
Hard money
10% down · 12.0% · 12mo
- Down + closing
- —
- Monthly P&I
- —
- Monthly cashflow
- —
- DSCR
- —
- Eligible?
- —
Short-term bridge; refi at stabilization.
HOA detail condo
- Monthly dues
- $0 · $0/yr
- Assessments
- None detected in remarks — confirm with the listing agent.
Listing history 31 events
-
2026-06-19days on market $114,900 Active 76 DOM
-
2026-06-18days on market $114,900 Active 75 DOM
-
2026-06-17days on market $114,900 Active 74 DOM
-
2026-06-16days on market $114,900 Active 73 DOM
-
2026-06-15days on market $114,900 Active 72 DOM
-
2026-06-14days on market $114,900 Active 70 DOM
-
2026-06-12days on market $114,900 Active 69 DOM
-
2026-06-09days on market $114,900 Active 66 DOM
-
2026-06-08days on market $114,900 Active 65 DOM
-
2026-06-07days on market $114,900 Active 64 DOM
-
2026-06-07days on market $114,900 Active 63 DOM
-
2026-06-04days on market $114,900 Active 60 DOM
-
2026-06-02days on market $114,900 Active 59 DOM
-
2026-06-01days on market $114,900 Active 58 DOM
-
2026-05-31days on market $114,900 Active 57 DOM
-
2026-05-31days on market $114,900 Active 56 DOM
-
2026-04-14price $114,900 644-char remark
Show marketing remark (644 chars)
Welcome to Market 1047 N Rosser St. & 122 E Arkansas Ave. of Forrest City, Arkansas. Opportunity Knocks! Here is your chance to house hack with one side rented and one side vacant or secure a second tenant. Situated on a . 34 +/- corner lot, are 2 all brick houses for the price of 1. Unit 1 has 3 beds, 1 bath, Unit 2 has 3 beds, 1.5 baths. Both units are 1,736 sf. Current tenant pays $750 per month, utilities, and maintains lawn. Conveniently located near favorite local amenities and within walking distance to the school. Just 20 minutes to Wynne, AR and 45 minutes to Memphis, TN. Call today to make a double investment in tomorrow.
-
2026-04-13price $114,900 676-char remark
Show marketing remark (676 chars)
Welcome to Market 1047 N Rosser St. & 122 E Arkansas Ave. of Forrest City, Arkansas. Opportunity Knocks! Investors here is your chance to house hack with one side rented and one side vacant or secure a second tenant and clear the 1% rule. Situated on a . 34 +/- corner lot, are 2 all brick houses for the price of 1. Unit 1 has 3 beds, 1 bath, Unit 2 has 3 beds, 1.5 baths. Both units are 1,736 sf. Current tenant pays $750 per month, utilities, and maintains lawn. Conveniently located near favorite local amenities and within walking distance to the school. Just 20 minutes to Wynne, AR and 45 minutes to Memphis, TN. Call today to make a double investment in tomorrow.
-
2026-04-05$119,900 Active 676-char remark
Show marketing remark (676 chars)
Welcome to Market 1047 N Rosser St. & 122 E Arkansas Ave. of Forrest City, Arkansas. Opportunity Knocks! Investors here is your chance to house hack with one side rented and one side vacant or secure a second tenant and clear the 1% rule. Situated on a . 34 +/- corner lot, are 2 all brick houses for the price of 1. Unit 1 has 3 beds, 1 bath, Unit 2 has 3 beds, 1.5 baths. Both units are 1,736 sf. Current tenant pays $750 per month, utilities, and maintains lawn. Conveniently located near favorite local amenities and within walking distance to the school. Just 20 minutes to Wynne, AR and 45 minutes to Memphis, TN. Call today to make a double investment in tomorrow.
-
2026-04-04$119,900 New Listing 644-char remark
Show marketing remark (644 chars)
Welcome to Market 1047 N Rosser St. & 122 E Arkansas Ave. of Forrest City, Arkansas. Opportunity Knocks! Here is your chance to house hack with one side rented and one side vacant or secure a second tenant. Situated on a . 34 +/- corner lot, are 2 all brick houses for the price of 1. Unit 1 has 3 beds, 1 bath, Unit 2 has 3 beds, 1.5 baths. Both units are 1,736 sf. Current tenant pays $750 per month, utilities, and maintains lawn. Conveniently located near favorite local amenities and within walking distance to the school. Just 20 minutes to Wynne, AR and 45 minutes to Memphis, TN. Call today to make a double investment in tomorrow.
-
2026-03-15historical
-
2026-03-15status Under Contract
-
2026-03-14historical
-
2026-01-07status Active
-
2026-01-07status Back on Market
-
2025-11-30historical
-
2025-11-30historical Take Backups
-
2025-09-29$119,900 Active
-
2025-09-29$119,900 New Listing
-
2025-09-29historical
-
2025-04-03$120,000 New Listing
ⓘ Source: listings_history table (triggers on properties + properties_extension) + one-shot
backfill from property_details.listing_events for pre-trigger history.
Climate risk First Street
- Flood 1/10 Low FEMA zone X · 0% chance over 30 yrs
- Wildfire 3/10 Moderate
- Heat 6/10 Major 7 d/yr ≥109°F today · 20 d/yr by 30 yrs out
- Wind 4/10 Moderate 14% chance of damaging wind over 30 yrs
- Air quality 1/10 Low 0 unhealthy d/yr today · 0 by 30 yrs out
Nearby sold comps map
Loading sold comps map…
Walkable amenities ~0.75 mi
Loading nearby amenities…
Taxation est. · year 1
- Rental income
- $16,830
- − Mortgage interest
- −$6,436
- − Property taxes
- −$1,724
- − Insurance
- −$574
- − Repairs & maintenance
- −$1,346
- − Management
- −$1,346
- − Depreciation
- −$3,343
- Taxable income
- $2,060
- Est. tax owed @ 24.0%
- −$494
- After-tax cash flow
- $3,272/yr
For passive investors: Depreciation is non-cash, so a rental often shows a tax loss while cash-flowing — sheltering income. Rental losses are passive: they offset passive income freely, and up to $25,000/yr can offset ordinary (W-2) income if you actively participate and your MAGI is under $100k (phasing out to $0 by $150k); unused losses carry forward. On sale, claimed depreciation is recaptured at up to 25%, and gains may owe capital-gains tax (a 1031 exchange can defer both). Figures are a year-1 estimate at your 24.0% rate — not tax advice; consult a CPA.
Condition & rehab AI · 12 photos
This property requires moderate renovations to improve its condition and increase its value. The kitchen and bathrooms are in poor condition and need major repairs. Landscaping and curb appeal also need attention. Upgrading these areas will significantly boost its resale and rental value.
Repairs flagged
- Major kitchen cabinets — severely outdated and cluttered
- Major bathroom fixtures — dated and worn out
- Major landscaping — overgrown areas need trimming
Value-add opportunities
- Both update kitchen cabinets and countertops — modernizing the kitchen will increase both resale and rental value
- Both replace bathroom fixtures — modernizing the bathrooms will increase both resale and rental value
- Both landscaping and curb appeal — improving the landscaping will increase both resale and rental value
Renovation cost estimate screening
| Repair item | Severity | Est. cost |
|---|---|---|
| kitchen cabinets · severely outdated and cluttered | Major | $15,000–50,000 |
| bathroom fixtures · dated and worn out | Major | $15,000–50,000 |
| landscaping · overgrown areas need trimming | Major | $15,000–50,000 |
| Total estimated repair cost · 3 items | $45,000–150,000 |
Value-add ROI direction
- Both update kitchen cabinets and countertops — modernizing the kitchen will increase both resale and rental value ↑
- Both replace bathroom fixtures — modernizing the bathrooms will increase both resale and rental value ↑
- Both landscaping and curb appeal — improving the landscaping will increase both resale and rental value ↑
ⓘ Cost ranges are severity-bucket heuristics (US national rule-of-thumb). Get contractor quotes + a written scope before underwriting a rehab budget.
Schools (NCES district)
- District
- Forrest City School District
- NCES district ID
- 0506270
- Math proficiency
- 12% ▼ -8.00%
- Reading proficiency
- 11% ▼ -7.00%
- Median HH income
- $31,153
- Composite
- 9.07/100
- National rank
- #9871
- State rank
- #230 of 238 in AR
Livability — Forrest City
- Score
- 59/100
- State rank
- #297
- US rank
- #20349
Category grades
Schools grade is shown separately in the Schools card above.
Census & demographics
- Census place
- Forrest City, AR
- Population (ZIP)
- 16,514
Population outlook (St. Francis County) Hauer SSP2
- Today (2025)
- 24,387 people
- By 2030
- 23,269 · -4.6%
- By 2040
- 21,122 · -13.4%
- By 2050
- 19,281 · -20.9%
- By 2075
- 15,222 · -37.6%
- By 2100
- 11,449 · -53.1%
Race, ethnicity, and origin ACS 2023
- Neighborhood character
- Majority Black (62%)
- Race & ethnicity
- Black 62% White 32% Hispanic / Latino 3% Two or more races 2%
- Common ancestry
- Italian 1% Lithuanian 1% Slovak 1%
- Foreign-born
- 2% · Canada
- Languages at home
- 96% English-only · Spanish 3%
Political lean MEDSL · St. Francis
- 2024 margin
- Toss-up / Even · D 49.4% · R 48.6% · Other 2.0%
- 2008→2024 swing
- -15.8pp toward R · 2008: 16.5pp · 2024: 0.7pp
- All cycles
- 2024: D+0.7 2020: D+5.1 2016: D+11.3 2012: D+17.0 2008: D+16.5
Not yet ingested
- Civics
- —
Market trends
- HPI YoY
- ▼ -6.86%
- Current HPI
- 133.8115
- Rent YoY
- —
- Metro
- —
- State GDP YoY
- ▲ 3.80%
- F500 in state
- 10
Industry mix (Fortune 500 HQ in AR)
| Industry | F500 HQs | Revenue |
|---|---|---|
| Retail | 1 | $681B |
|
||
| Food / Agriculture | 1 | $53B |
|
||
| Retail / Energy | 1 | $22B |
|
||
| Transportation / Logistics | 1 | $12B |
|
||
| Energy | 1 | $4B |
|
||
Price history
-4.2% since first listed15 events — show timeline
- 2026-04-14 Price Changed $114,900 CARMLS
- 2026-04-13 Price Changed $114,900 NEABOR MLS
- 2026-04-05 Listed $119,900 NEABOR MLS
- 2026-04-04 Listed $119,900 CARMLS
- 2026-03-15 Delisted — NEABOR MLS
- 2026-03-15 Pending — CARMLS
- 2026-03-14 Listing Removed — CARMLS
- 2026-01-07 Relisted — NEABOR MLS
- 2026-01-07 Relisted — CARMLS
- 2025-11-30 Delisted — NEABOR MLS
- 2025-11-30 Contingent — CARMLS
- 2025-09-29 Listed $119,900 NEABOR MLS
- 2025-09-29 Listing Removed — CARMLS
- 2025-09-29 Listed $119,900 CARMLS
- 2025-04-03 Listed $120,000 CARMLS
Cash-flow waterfall
monthlySold comps — $/sqft
last 12 mo · ≤1 miLoading sold comps…