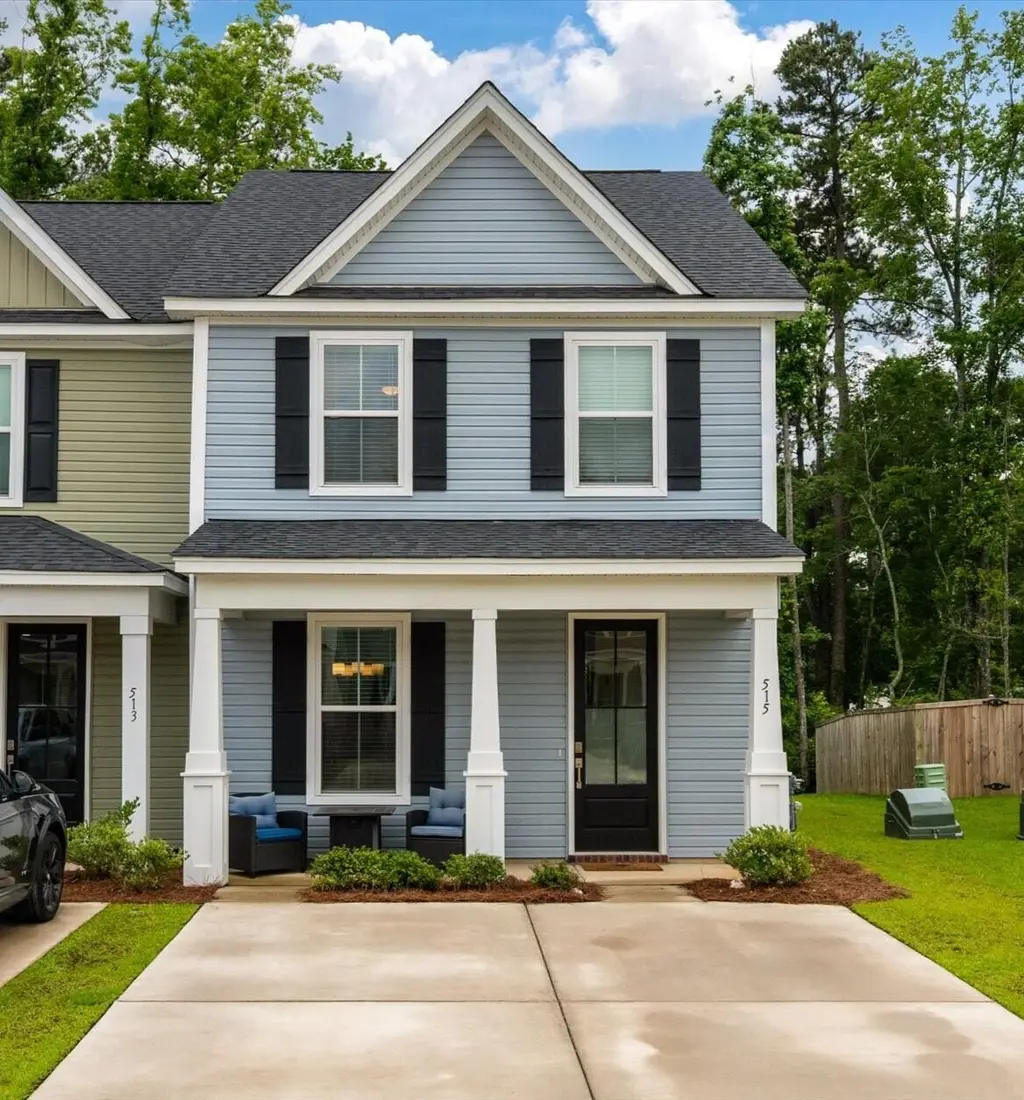
515 Green Fern Dr · Summerville, SC
Flood risk No data
- FEMA flood zone
- —
- Chance of flooding over 30 yrs
- —
- Est. flood insurance / yr
- —
Fire risk No data
- Est. fire insurance / yr
- —
Heat risk No data
- Hot days now (above threshold)
- —
- Hot days in 30 yrs
- —
Wind risk No data
- Chance of severe wind over 30 yrs
- —
Air-quality risk No data
- Unhealthy air days now
- —
- Unhealthy air days in 30 yrs
- —
Risk factors via First Street. Map © Google.
Why this score? — see what drove the D- grade
The composite is a weighted blend of 9 inputs, each scored 0–100. Each bar is that input's sub-score; the figure is the points it added to the 100-point composite (weight × sub-score).
- Cash flow +12.6/30.0
- ARV discount +7.8/15.0
- DSCR +3.8/10.0
- Schools +3.6/10.0
- Livability +3.2/5.0
- Rent growth +2.9/5.0
- 1% rule +2.5/10.0
- Condition / age +2.5/5.0
- Appreciation +0.0/10.0
$299,900
🖨 Deal sheet 📄 Offer letter ✓ Due diligence
Listing remarks MLS
Price reflects current incentive. Incentive is tied to Preferred Lender and Closing attorney.See Agent for details.MOVE IN READY END UNIT!! The Meadowbrook is a 1450sq.ft. plan featuring three bedrooms and two and a half bathrooms. Open Concept first story with 9 ft ceilings, 8 foot doors and 6 ft windows. Kitchen features solid stone countertops, backsplash and upgraded cabinets. Master Bath features large 5ft tiled shower and spacious solid stone vanity. GORGEOUS Finishes! Price is all in Price reflecting structural options, Design Finishes, Plan and Lot Premium.
Key facts
- Private backyard
- Community amenities
- Spacious kitchen
Tags
Property features AI
Finance
- HOA & community: Annual association fee; Community features include dog park and park
Exterior
- Parking: Off-street parking
- Utilities: Public sewer; Dominion Energy service; Dorchester County water and sewer
- Home design: Single-family attached (townhouse); Two levels; Fee simple ownership
- Construction: Architectural roof
- Exterior features: Partial fencing; 0–0.5 acre lot
Interior
- Kitchen: Dishwasher; Disposal; Gas range; Microwave; ENERGY STAR qualified appliances; Tankless water heater
- Bedrooms: 3 bedrooms; Primary bedroom on upper level with ceiling fan and walk-in closet
- Flooring: Carpet; Ceramic tile
- Bathrooms: 2.5 bathrooms
- Heating & cooling: Central air conditioning; Natural gas heating
- Interior features: Smooth ceilings; High ceilings; Ceiling fans; Walk-in closet(s); Eat-in kitchen; Separate dining area
- Laundry & utility: Washer hookup; Electric dryer hookup
Neighborhood map
What this means for you Summary
Snapshot
- This is a 3-bed/2.5-bath townhouse listed at $300k.
Deal economics
- At list price, monthly cash flow is $-38 ($-459/yr) — negative.
- To cash-flow at today's rent, offer at most $293k (2.3% below list).
- To meet the 1% rule (rent ≥ 1% of price), the offer needs to be $223k (25.5% below list).
- Recommended offer: $223k (25.5% below list) — sets the bar for 1% rule.
- Cap rate 6.1% vs local median 4.0% in Summerville — top-decile yield for the area; either an underpriced asset or a hidden risk that comps aren't pricing in. Stress-test before assuming the spread holds.
Location & tenants
- Location reads 63/100 on livability (#167 in SC) — a middle-class / working-renter tenant base. Strengths: housing A+, cost of living B+; Watch: amenities F, commute F, health & safety F.
- Berkeley 01 (suburban): math 35% / reading 48% proficiency, ranked #30 of 80 in SC (top 38%) — families likely to look elsewhere, expect single-tenant / working-renter base with shorter leases.
- Zoned schools: Nexton Elementary (math 52% / reading 55%, grade C, #137 of 597 statewide, top 23%, 1,025 students, 38% FRL); Cane Bay Middle (math 29% / reading 47%, grade F, #86 of 229 statewide, top 39%, 1,487 students, 30% FRL); Cane Bay High (math 50% / reading 84%, grade B, #73 of 196 statewide, top 41%, 2,158 students, 28% FRL) — zoned schools average 32% FRL vs 48% district-wide (17 pts lower); this property's tenant base skews higher-income than the district average.
- Market conditions: Rents rising (+1.4%/yr); 741 active listings in the ZIP; 5 comparable units currently listed for rent nearby; rentals at typical pace (median 23d on market — plan ~3-4 weeks tenant-placement turnaround); solid renter incomes; 3,183 units permitted in Berkeley County in 2024 (580 in 5+ unit buildings).
- This rent runs 31% of the median local income ($86k/yr) — at the standard rent-burdened threshold; future hikes will face affordability resistance.
Forward outlook
- Local home prices are declining (-3.0%/yr); year-one equity from $2k of loan paydown is wiped out by about $9k of value loss. Plan a longer hold.
- Berkeley County population projected at +48% by 2050 — long-run rental-demand tailwind backs the buy-and-hold thesis.
Negotiation context
- It's been on market 15 days — a 2% lower offer ($295k) is reasonable based on typical stale-listing flexibility.
- 2 sale attempts since 3y ago with the ask held roughly flat each time — persistent listings suggest the price (not the market) is what's stuck; bring a comps-based counter.
Questions for the listing agent
- What do current leases actually rent for vs. the listed asking? Can we see a recent rent roll and the last 12 months of T-12 income?
- Is there a deadline driving the sale (1031 exchange, divorce, estate, relocation)? That informs how much negotiation room exists.
- Schools are B-rated — typically a magnet for longer-tenancy family renters. What's the average tenant stay here, and is there a school-zone premium baked into asking?
- The area grade is low — what's the realistic commute time and amenity access for the typical tenant pool here? Any planned neighborhood developments (good or bad) we should know about?
- What's the average days-on-market for RENTAL listings here right now (not sales)? A rising rental-DOM trend means longer vacancies and softer asking-rent achievability than the comps imply.
- What's the recent tenant-quality profile in this submarket — average credit score on applications, eviction rate, late-payment / NSF rate, and stable-employment percentage? A property-management company in the area should have these aggregated.
- How much new for-sale + rental construction is in the pipeline within 1–3 miles? Heavy new supply typically softens prices + rents 12–24 months out; constrained supply supports both.
Investment metrics
- 1% rule
- 0.75% ✗
- Cap rate
- 6.14%
- Cash-on-cash
- -0.55%
- DSCR
- 0.98
- GRM
- 11.2
CMA / ARV
- ARV (on-the-fly)
- $301,804
- Comps found
- 12
Show comp detail 12 sales within ~0.75 mi
| Address | Dist | Beds/Ba | Sqft | Sold | Price | $/sf | Match |
|---|---|---|---|---|---|---|---|
| 277 Mcclellan Way | 0.28mi | 3/2.5 | 1,580 (+3%) | 1mo | $302,000 | $191 | 81 |
| 314 Green Fern Dr | 0.09mi | 3/2.5 | 1,450 (-5%) | 13mo | $315,000 | $217 | 76 |
| 497 Green Fern | 0.04mi | 3/2.5 | 1,450 (-5%) | 16mo | $284,716 | $196 | 76 |
| 504 Green Fern Dr | 0.03mi | 3/2.5 | 1,450 (-5%) | 18mo | $284,371 | $196 | 75 |
| 485 Green Fern Dr | 0.06mi | 3/2.5 | 1,450 (-5%) | 16mo | $284,276 | $196 | 75 |
| 468 Green Fern Dr | 0.10mi | 3/2.5 | 1,450 (-5%) | 16mo | $292,000 | $201 | 73 |
| 480 Green Fern Dr | 0.08mi | 3/2.0 | 1,450 (-5%) | 16mo | $285,380 | $197 | 72 |
| 518 Green Fern Dr | 0.45mi | 3/2.5 | 1,532 (0%) | 13mo | $311,314 | $203 | 68 |
| 490 Green Fern Dr | 0.06mi | 2/2.5 (-1) | 1,304 (-15%) | 17mo | $273,536 | $210 | 53 |
| 478 Green Fern Dr | 0.08mi | 2/2.5 (-1) | 1,304 (-15%) | 17mo | $264,800 | $203 | 52 |
| 511 Green Fern Dr | 0.45mi | 2/2.5 (-1) | 1,304 (-15%) | 1mo | $256,000 | $196 | 48 |
| 316 Green Fern Dr | 0.45mi | 2/2.5 (-1) | 1,304 (-15%) | 5mo | $249,990 | $192 | 45 |
Match score weights: distance 35% · size 25% · config 20% · recency 20%. Top-matched comps best support the ARV.
Projected returns pro-forma
-3.0% appreciation · 1.45% rent growth · sell at horizon
- IRR
- -18.8%
- Equity multiple
- 0.35×
- Total profit
- $-54,594
- Equity at exit
- $44,716
- IRR
- -14.3%
- Equity multiple
- 0.23×
- Total profit
- $-64,858
- Equity at exit
- $25,930
Cash invested: $83,972 (down + closing). Projections, not guarantees.
Landlord ↔ Tenant lean methodology
- Overall (STATE)
- 90 Strongly Landlord-Friendly
- State South Carolina
- 90 Strongly Landlord-Friendly · R+6
- County
- — inherits STATE
- City
- — inherits STATE
ZIP-level market 29483
- Home prices YoY
- -34.6%
- Rents YoY
- 1.4%
- Active inventory
- 741
- Price-to-rent
- 11.2×
Monthly cashflow live
- Estimated rent
- $2,234 high interval (Pro) →
- Mortgage (P&I)
- −$1,573
- Tax from tax record
- −$106 /mo · $1,268/yr
- Insurance
- −$125
- HOA
- −$0
- Vacancy / Maint / Mgmt
- −$469
- Net cashflow
- $-38
Break-even live
UW: 25.0% down · 7.5% · 30yr · 1.5% tax · 5.0% vac · 8.0% maint · 8.0% mgmt
Financing live
Cash to close
- Down payment
- $74,975
- Closing costs
- $8,997
- Reserves months
- —
- Total cash needed
- —
Loan-product check · same deal, 3 products live
Conventional
25% down · 7.5% · 30yr
- Down + closing
- —
- Monthly P&I
- —
- Monthly cashflow
- —
- DSCR
- —
- Eligible?
- —
Personal DTI + credit; lowest rate.
DSCR
20% down · 8.5% · 30yr
- Down + closing
- —
- Monthly P&I
- —
- Monthly cashflow
- —
- DSCR
- —
- Eligible?
- —
No personal income docs; deal must DSCR.
Hard money
10% down · 12.0% · 12mo
- Down + closing
- —
- Monthly P&I
- —
- Monthly cashflow
- —
- DSCR
- —
- Eligible?
- —
Short-term bridge; refi at stabilization.
Rent comps 5 comps
| Address | Beds | Baths | Sqft | Rent | $/sqft | DOM | Units | Dist |
|---|---|---|---|---|---|---|---|---|
| 506 Green Fern Dr Summerville, SC | 3.0 | 2.5 | 1986 | $2,300 | $1.16 | 23d | 1 | 0.04mi |
| 462 Green Fern Dr Summerville, SC | 3.0 | 2.5 | 1998 | $2,100 | $1.05 | 14d | 1 | 0.10mi |
| 412 Aberdeen Cir Summerville, SC | 4.0 | 2.5 | 2189 | $2,200 | $1.01 | 2d | 1 | 1.07mi |
| 69 Blue Jasmine Ln Summerville, SC | 3.0 | 2.0 | 1120 | $2,150 | $1.92 | 23d | 1 | 1.27mi |
| 115 Tyron Rd Summerville, SC | 3.0 | 2.0 | 1452 | $2,200 | $1.52 | 23d | 1 | 1.35mi |
Listing history 11 events
-
2026-06-18days on market $299,900 Active 15 DOM
-
2026-06-17days on market $299,900 Active 14 DOM
-
2026-06-16days on market $299,900 Active 13 DOM
-
2026-06-15days on market $299,900 Active 12 DOM
-
2026-06-13days on market $299,900 Active 10 DOM
-
2026-06-13days on market $299,900 Active 9 DOM
-
2026-06-10days on market $299,900 Active 7 DOM
-
2026-06-09days on market $299,900 Active 6 DOM
-
2026-06-08days on market $299,900 Active 5 DOM
-
2026-06-07remarks 699-char remark
-
2026-06-07$299,900 Active 4 DOM
ⓘ Source: listings_history table (triggers on properties + properties_extension) + one-shot
backfill from property_details.listing_events for pre-trigger history.
Tax reassessment forecast SC · Resets to sale price
- Current annual tax
- $1,268 · $106/mo
- Projected year-2 tax
- $1,709 · $142/mo
- Expected delta
- +$441/yr (+$37/mo · 34.8%)
ⓘ Screening estimate from a state-policy table — verify with the county assessor before closing.
Nearby sold comps map
Loading sold comps map…
Walkable amenities ~0.75 mi
Loading nearby amenities…
Taxation est. · year 1
- Rental income
- $26,812
- − Mortgage interest
- −$16,799
- − Property taxes
- −$1,268
- − Insurance
- −$1,500
- − Repairs & maintenance
- −$2,145
- − Management
- −$2,145
- − Depreciation
- −$8,724
- Taxable loss
- −$5,769
- Est. tax savings @ 24.0%
- +$1,385
- After-tax cash flow
- $926/yr
For passive investors: Depreciation is non-cash, so a rental often shows a tax loss while cash-flowing — sheltering income. Rental losses are passive: they offset passive income freely, and up to $25,000/yr can offset ordinary (W-2) income if you actively participate and your MAGI is under $100k (phasing out to $0 by $150k); unused losses carry forward. On sale, claimed depreciation is recaptured at up to 25%, and gains may owe capital-gains tax (a 1031 exchange can defer both). Figures are a year-1 estimate at your 24.0% rate — not tax advice; consult a CPA.
Schools (NCES district)
- District
- Berkeley 01
- NCES district ID
- 4501170
- Math proficiency
- 35% ▼ -8.00%
- Reading proficiency
- 48% ▼ -2.00%
- Median HH income
- $52,724
- Composite
- 35.95/100
- National rank
- #4799
- State rank
- #30 of 80 in SC
Livability — Summerville
- Score
- 63/100
- State rank
- #167
- US rank
- #15058
Category grades
Schools grade is shown separately in the Schools card above.
Census & demographics
- County
- Dorchester County · 182,866 people
- City population
- 171,668
- Metro
- Charleston-North Charleston, SC
- Population (ZIP)
- 59,186
- Household income
- $85,750
- Rent vs Own
- Severe rent burden
- 1309.0
Population outlook (Berkeley County) Hauer SSP2
- Today (2025)
- 254,184 people
- By 2030
- 279,677 · +10.0%
- By 2040
- 329,379 · +29.6%
- By 2050
- 375,557 · +47.8%
- By 2075
- 476,740 · +87.6%
- By 2100
- 535,945 · +110.8%
Race, ethnicity, and origin ACS 2023
- Neighborhood character
- Predominantly White (68%)
- Race & ethnicity
- White 68% Black 19% Hispanic / Latino 7% Two or more races 6% Asian 1%
- Hispanic origin (detail)
- Mexican 3% Puerto Rican 1%
- Common ancestry
- Slovak 3% Lithuanian 3% Romanian 3%
- Foreign-born
- 5% · Canada
- Languages at home
- 93% English-only · Spanish 4%
Political lean MEDSL · Berkeley
- 2024 margin
- R (+16.3) · D 41.1% · R 57.4% · Other 1.4%
- 2008→2024 swing
- -3.2pp toward R · 2008: -13.1pp · 2024: -16.3pp
- All cycles
- 2024: R+16.3 2020: R+11.7 2016: R+17.4 2012: R+18.9 2008: R+13.1
Not yet ingested
- Civics
- —
Market trends
- HPI YoY
- ▼ -131.42%
- Current HPI
- 248.8406
- Rent YoY
- ▲ 1.45%
- Metro
- Charleston-North Charleston, SC
- State GDP YoY
- ▲ 4.51%
- F500 in state
- 2
Industry mix (Fortune 500 HQ in SC)
| Industry | F500 HQs | Revenue |
|---|---|---|
| Packaging | 1 | $7B |
|
||
Price history
-1.8% since first listed10 events — show timeline
- 2026-06-03 Listed $299,900 Charleston Trident MLS
- 2024-02-20 Sold (Public Records) $285,244 Public Records
- 2024-02-20 Sold (MLS) $285,244 Charleston Trident MLS
- 2024-01-19 Pending — Charleston Trident MLS
- 2023-12-01 Sold (Public Records) $580,000 Public Records
- 2023-11-14 Price Changed $285,244 Charleston Trident MLS
- 2023-10-18 Price Changed $290,244 Charleston Trident MLS
- 2023-10-18 Price Changed $275,244 Charleston Trident MLS
- 2023-08-23 Price Changed $300,244 Charleston Trident MLS
- 2023-07-25 Listed $305,244 Charleston Trident MLS
Property tax history
+232.6%/yrLatest (2025): $1,268 · -70.8% YoY. Source: county tax records.
Cash-flow waterfall
monthlySold comps — $/sqft
last 12 mo · ≤1 miLoading sold comps…