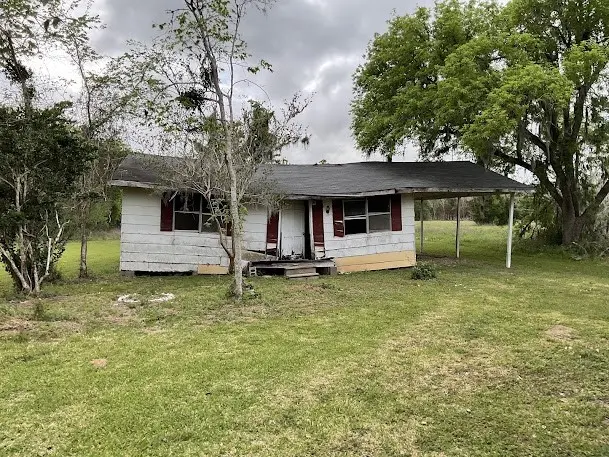
1857 County Road 318 · Brazoria, TX
Flood risk 6/10 · Moderate
- FEMA flood zone
- X (shaded)
- Chance of flooding over 30 yrs
- 0.54%
- Est. flood insurance / yr
- $507 – $1,088
Fire risk 3/10 · Minor
- Est. fire insurance / yr
- $1,222 – $2,270
Heat risk 10/10 · Severe
- Hot days now (above 116°F)
- 7 days/yr
- Hot days in 30 yrs
- 25 days/yr
Wind risk 9/10 · Severe
- Chance of severe wind over 30 yrs
- 99.0%
Air-quality risk 4/10 · Minor
- Unhealthy air days now
- 3 days/yr
- Unhealthy air days in 30 yrs
- 4 days/yr
Risk factors via First Street. Map © Google.
Why this score? — see what drove the B+ grade
The composite is a weighted blend of 9 inputs, each scored 0–100. Each bar is that input's sub-score; the figure is the points it added to the 100-point composite (weight × sub-score).
- Cash flow +30.0/30.0
- 1% rule +10.0/10.0
- DSCR +10.0/10.0
- Appreciation +10.0/10.0
- ARV discount +7.5/15.0
- Schools +3.1/10.0
- Livability +3.1/5.0
- Rent growth +2.5/5.0
- Condition / age +2.5/5.0
$49,999
🖨 Deal sheet (PDF) 📄 Offer letter ✓ Due diligence
Listing remarks MLS
JUST LISTED This FIXER UPPER on a 0.36-acre parcel in Brazoria, Texas. The house is rough and is being sold AS IS but the lot is big and has a lot of potential. This is a solid opportunity for renovation or a fresh start in a small-town setting. Located in the 77422 area with proximity to local roads and neighborhood services. WE MAKE IT EASY TO OWN. This is a great opportunity! Don't wait, call us today to get more information on the owner's easy terms and smooth process that may be able to put the deed in your name and make this your dream property. When you call us be sure and ask about the other properties that we have available in the Brazoria Texas Area.
Key facts
- Big lot
- 0.36-acre parcel
- Small-town setting
Tags
Neighborhood map
What this means for you Summary
Snapshot
- This is a 1-bed/1.0-bath single-family listed at $50k.
Deal economics
- At list price, monthly cash flow is $541 ($6k/yr) — positive.
- The deal already cash-flows at list — no discount required.
- Meets the 1% rule at list price ($1k rent vs $50k).
- Recommended offer: $44k (12.0% below list) — sets the bar for market timing.
- Cap rate 19.3% vs local median 3.1% in Brazoria — top-decile yield for the area; either an underpriced asset or a hidden risk that comps aren't pricing in. Stress-test before assuming the spread holds.
Location & tenants
- Location reads 61/100 on livability (#1,001 in TX) — a middle-class / working-renter tenant base. Strengths: cost of living A+, housing A+, crime B+; Watch: amenities F, commute F, employment F.
- Sweeny ISD (town): math 32% / reading 40% proficiency, ranked #480 of 826 in TX (top 58%) — families likely to look elsewhere, expect single-tenant / working-renter base with shorter leases.
- Zoned schools: Sweeny El (math 34% / reading 41%, grade F, #1,744 of 4,322 statewide, top 41%, 864 students, 67% FRL); Sweeny J H (math 29% / reading 36%, grade F, #947 of 1,662 statewide, top 58%, 445 students, 57% FRL); Sweeny H S (math 37% / reading 47%, grade F, #730 of 1,632 statewide, top 47%, 589 students, 51% FRL).
- Market conditions: 212 active listings in the ZIP; 3,960 units permitted in Brazoria County in 2024 (593 in 5+ unit buildings).
Forward outlook
- In year one you build about $5k of equity ($345 loan paydown + $5k appreciation (10.0% local appreciation)).
- Brazoria County population projected at +44% by 2050 — long-run rental-demand tailwind backs the buy-and-hold thesis.
- At projected returns (10.0% appreciation + 3.0% rent growth), your $14k cash investment doubles in ~2 years — after that, you're playing with house money.
- By year 6, paydown + projected appreciation supports a ~$31k cash-out refi (75% LTV) — recoverable capital for the next deal without selling this one.
Negotiation context
- It's been on market 133 days — a 12% lower offer ($44k) is reasonable based on typical stale-listing flexibility.
Risks & watch-outs
- Watch-outs: built in 1952 — expect roof / HVAC / electrical / plumbing capex.
- Climate carrying-cost: major flood risk; severe wind risk, 99% chance of damaging wind over 30y; extreme-heat days projected 7→25/yr by 2055 (HVAC capex compounding) — expect insurance premiums to compound above CPI over the hold.
Questions for the listing agent
- It's been on market 133 days. Have you received any prior offers? Is the seller open to a 12% concession, seller financing, or rate buy-down credit?
- Built in 1952 — when were the roof, HVAC, electrical panel, plumbing, and water heater last replaced?
- Why hasn't it sold? Are there any deal-killer items the seller is aware of (foundation, flood, title, zoning, code violations)?
- Is there a deadline driving the sale (1031 exchange, divorce, estate, relocation)? That informs how much negotiation room exists.
- Schools are F-rated, which usually means shorter tenancies and higher turnover. Who's the typical renter profile here, and what's been the actual vacancy rate?
- What's the average days-on-market for RENTAL listings here right now (not sales)? A rising rental-DOM trend means longer vacancies and softer asking-rent achievability than the comps imply.
- What's the recent tenant-quality profile in this submarket — average credit score on applications, eviction rate, late-payment / NSF rate, and stable-employment percentage? A property-management company in the area should have these aggregated.
- How much new for-sale + rental construction is in the pipeline within 1–3 miles? Heavy new supply typically softens prices + rents 12–24 months out; constrained supply supports both.
Investment metrics
- 1% rule
- 2.20% ✓
- Cap rate
- 19.27%
- Cash-on-cash
- 46.35%
- DSCR
- 3.06
- GRM
- 3.8
CMA / ARV
No comps found within radius.
Projected returns pro-forma
10.0% appreciation · 3.0% rent growth · sell at horizon
- IRR
- 60.5%
- Equity multiple
- 5.41×
- Total profit
- $61,677
- Equity at exit
- $45,043
- IRR
- 54.0%
- Equity multiple
- 12.04×
- Total profit
- $154,558
- Equity at exit
- $97,137
Cash invested: $14,000 (down + closing). Projections, not guarantees.
Landlord ↔ Tenant lean methodology
- Overall (STATE)
- 87 Strongly Landlord-Friendly
- State Texas
- 87 Strongly Landlord-Friendly · R+5
- County
- — inherits STATE
- City
- — inherits STATE
ZIP-level market 77422
- Home prices YoY
- 5.1%
- Active inventory
- 212
- Price-to-rent
- 3.8×
Monthly cashflow live
- Estimated rent
- $1,102 medium interval (Pro) →
- Mortgage (P&I)
- −$262
- Tax from tax record
- −$47 /mo · $559/yr
- Insurance
- −$21
- HOA
- −$0
- Vacancy / Maint / Mgmt
- −$231
- Net cashflow
- $541
Break-even live
Sensitivity live
| Price | -10% $569 | -5% $555 | +0% $541 | +5% $527 | +10% $512 |
|---|---|---|---|---|---|
| Rent | -10% $454 | -5% $497 | +0% $541 | +5% $584 | +10% $628 |
| Rate | -1.0pp $566 | -0.5pp $553 | base $541 | +0.5pp $528 | +1.0pp $515 |
UW: 25.0% down · 7.5% · 30yr · 1.5% tax · 5.0% vac · 8.0% maint · 8.0% mgmt
Financing live
Cash to close
- Down payment
- $12,500
- Closing costs
- $1,500
- Reserves months
- —
- Total cash needed
- —
Loan-product check · same deal, 3 products live
Conventional
25% down · 7.5% · 30yr
- Down + closing
- —
- Monthly P&I
- —
- Monthly cashflow
- —
- DSCR
- —
- Eligible?
- —
Personal DTI + credit; lowest rate.
DSCR
20% down · 8.5% · 30yr
- Down + closing
- —
- Monthly P&I
- —
- Monthly cashflow
- —
- DSCR
- —
- Eligible?
- —
No personal income docs; deal must DSCR.
Hard money
10% down · 12.0% · 12mo
- Down + closing
- —
- Monthly P&I
- —
- Monthly cashflow
- —
- DSCR
- —
- Eligible?
- —
Short-term bridge; refi at stabilization.
Listing history 19 events
-
2026-06-22days on market $49,999 Active 133 DOM
-
2026-06-21days on market $49,999 Active 132 DOM
-
2026-06-19days on market $49,999 Active 130 DOM
-
2026-06-18days on market $49,999 Active 129 DOM
-
2026-06-17days on market $49,999 Active 128 DOM
-
2026-06-16days on market $49,999 Active 127 DOM
-
2026-06-15days on market $49,999 Active 126 DOM
-
2026-06-14days on market $49,999 Active 124 DOM
-
2026-06-12days on market $49,999 Active 123 DOM
-
2026-06-09days on market $49,999 Active 120 DOM
-
2026-06-08days on market $49,999 Active 119 DOM
-
2026-06-07days on market $49,999 Active 118 DOM
-
2026-06-07days on market $49,999 Active 117 DOM
-
2026-06-03days on market $49,999 Active 114 DOM
-
2026-06-02days on market $49,999 Active 113 DOM
-
2026-06-01days on market $49,999 Active 112 DOM
-
2026-05-31days on market $49,999 Active 111 DOM
-
2026-05-30days on market $49,999 Active 110 DOM
-
2026-02-09$49,999 Active 670-char remark
Show marketing remark (670 chars)
JUST LISTED This FIXER UPPER on a 0.36-acre parcel in Brazoria, Texas. The house is rough and is being sold AS IS but the lot is big and has a lot of potential. This is a solid opportunity for renovation or a fresh start in a small-town setting. Located in the 77422 area with proximity to local roads and neighborhood services. WE MAKE IT EASY TO OWN. This is a great opportunity! Don't wait, call us today to get more information on the owner's easy terms and smooth process that may be able to put the deed in your name and make this your dream property. When you call us be sure and ask about the other properties that we have available in the Brazoria Texas Area.
ⓘ Source: listings_history table (triggers on properties + properties_extension) + one-shot
backfill from property_details.listing_events for pre-trigger history.
Tax reassessment forecast TX · Resets to sale price
- Current annual tax
- $559 · $47/mo
- Projected year-2 tax
- $915 · $76/mo
- Expected delta
- +$356/yr (+$30/mo · 63.8%)
ⓘ Screening estimate from a state-policy table — verify with the county assessor before closing.
Climate risk First Street
- Flood 6/10 Major FEMA zone X (shaded) · 54% chance over 30 yrs
- Wildfire 3/10 Moderate
- Heat 10/10 Extreme 7 d/yr ≥116°F today · 25 d/yr by 30 yrs out
- Wind 9/10 Extreme 99% chance of damaging wind over 30 yrs
- Air quality 4/10 Moderate 3 unhealthy d/yr today · 4 by 30 yrs out
Nearby sold comps map
Loading sold comps map…
Walkable amenities ~0.75 mi
Loading nearby amenities…
Taxation est. · year 1
- Rental income
- $13,220
- − Mortgage interest
- −$2,801
- − Property taxes
- −$559
- − Insurance
- −$250
- − Repairs & maintenance
- −$1,058
- − Management
- −$1,058
- − Depreciation
- −$1,455
- Taxable income
- $6,041
- Est. tax owed @ 24.0%
- −$1,450
- After-tax cash flow
- $5,039/yr
For passive investors: Depreciation is non-cash, so a rental often shows a tax loss while cash-flowing — sheltering income. Rental losses are passive: they offset passive income freely, and up to $25,000/yr can offset ordinary (W-2) income if you actively participate and your MAGI is under $100k (phasing out to $0 by $150k); unused losses carry forward. On sale, claimed depreciation is recaptured at up to 25%, and gains may owe capital-gains tax (a 1031 exchange can defer both). Figures are a year-1 estimate at your 24.0% rate — not tax advice; consult a CPA.
Schools (NCES district)
- District
- Sweeny ISD
- NCES district ID
- 4841970
- Math proficiency
- 32% ▼ -12.00%
- Reading proficiency
- 40% ▼ -1.00%
- Median HH income
- $53,607
- Composite
- 31.49/100
- National rank
- #5975
- State rank
- #480 of 826 in TX
Livability — Brazoria
- Score
- 61/100
- State rank
- #1001
- US rank
- #17755
Category grades
Schools grade is shown separately in the Schools card above.
Census & demographics
- Population (ZIP)
- 14,548
Population outlook (Brazoria County) Hauer SSP2
- Today (2025)
- 420,414 people
- By 2030
- 457,585 · +8.8%
- By 2040
- 532,232 · +26.6%
- By 2050
- 605,399 · +44.0%
- By 2075
- 779,358 · +85.4%
- By 2100
- 883,759 · +110.2%
Race, ethnicity, and origin ACS 2023
- Neighborhood character
- Majority White (64%)
- Race & ethnicity
- White 64% Hispanic / Latino 21% Two or more races 15% Black 10%
- Hispanic origin (detail)
- Mexican 18%
- Common ancestry
- Lithuanian 3% Slovak 2% Italian 2%
- Foreign-born
- 7% · Canada
- Languages at home
- 86% English-only · Spanish 13%
Political lean MEDSL · Brazoria
- 2024 margin
- R (+19.7) · D 39.5% · R 59.2% · Other 1.3%
- 2008→2024 swing
- +9.9pp toward D · 2008: -29.6pp · 2024: -19.7pp
- All cycles
- 2024: R+19.7 2020: R+18.2 2016: R+24.6 2012: R+34.2 2008: R+29.6
Not yet ingested
- Civics
- —
Market trends
- HPI YoY
- ▲ 14.41%
- Current HPI
- 296.0632
- Rent YoY
- —
- Metro
- —
- State GDP YoY
- ▲ 3.95%
- F500 in state
- 110
Industry mix (Fortune 500 HQ in TX)
| Industry | F500 HQs | Revenue |
|---|---|---|
| Energy | 16 | $1,198B |
|
||
| Technology | 5 | $198B |
|
||
| Engineering / Construction | 4 | $72B |
|
||
| Energy Services | 3 | $60B |
|
||
| Utilities | 3 | $41B |
|
||
| Healthcare | 2 | $330B |
|
||
Price history
1 event — show timeline
- 2026-02-09 Listed $49,999 HARMLS
Property tax history
+3.1%/yrLatest (2025): $559 · -18.0% YoY. Source: county tax records.
Cash-flow waterfall
monthlySold comps — $/sqft
last 12 mo · ≤1 miLoading sold comps…