9089 Fulton St SE · Forest Hills, MI
Flood risk 9/10 · Severe
- FEMA flood zone
- X (unshaded)
- Chance of flooding over 30 yrs
- 0.99%
- Est. flood insurance / yr
- $473 – $860
Fire risk 2/10 · Minimal
- Est. fire insurance / yr
- $784 – $1,456
Heat risk 2/10 · Minimal
- Hot days now (above 96°F)
- 7 days/yr
- Hot days in 30 yrs
- 16 days/yr
Wind risk 2/10 · Minimal
- Chance of severe wind over 30 yrs
- —
Air-quality risk 2/10 · Minimal
- Unhealthy air days now
- 1 days/yr
- Unhealthy air days in 30 yrs
- 1 days/yr
Risk factors via First Street. Map © Google.
Why this score? — see what drove the D+ grade
The composite is a weighted blend of 9 inputs, each scored 0–100. Each bar is that input's sub-score; the figure is the points it added to the 100-point composite (weight × sub-score).
- ARV discount +15.0/15.0
- Cash flow +12.7/30.0
- Schools +6.3/10.0
- DSCR +3.8/10.0
- Livability +3.8/5.0
- 1% rule +3.2/10.0
- Rent growth +2.5/5.0
- Condition / age +2.5/5.0
- Appreciation +0.0/10.0
$329,900
🖨 Deal sheet 📄 Offer letter ✓ Due diligence
Listing remarks MLS
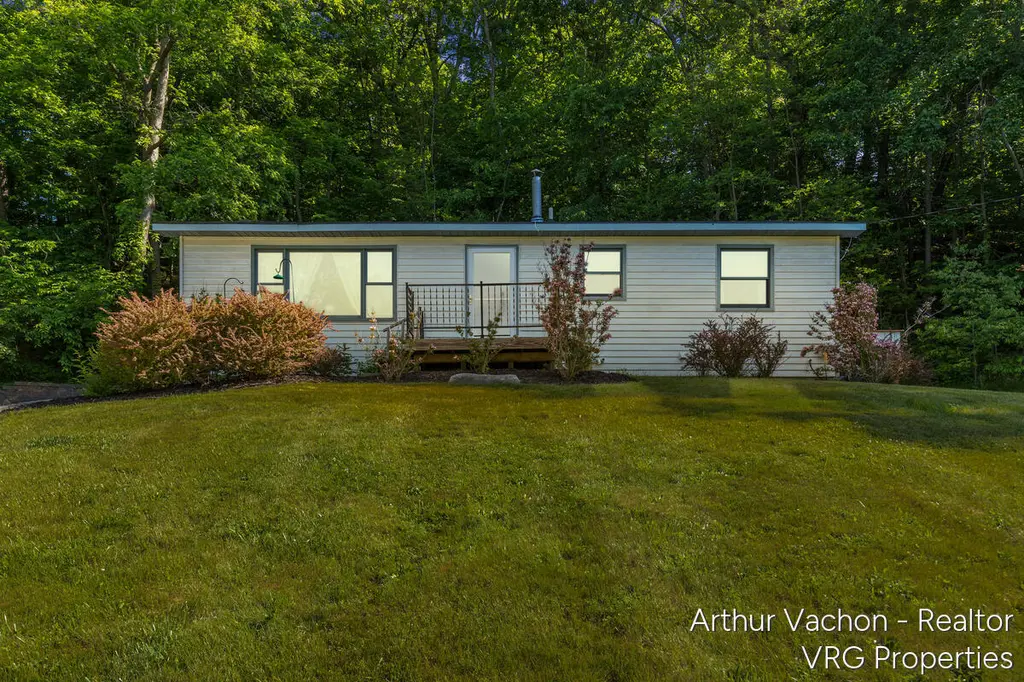
Welcome to 9098 Fulton St. E in Ada! Set on over 2 acres in the highly sought-after Forest Hills Schools, this move-in ready home combines space, style, and convenience. Just minutes from Ada Village, Cascade shopping, coffee spots, and the Thornapple River, you'll love the balance of privacy and proximity to local hot spots. Inside, enjoy fresh paint, newer flooring, and an updated kitchen perfect for entertaining. Bedrooms feature generous closets, while the finished basement offers a large family room and newer half bath. Relax on the expansive back deck overlooking a landscaped yard with room for a pool. With a newer high-efficiency furnace and all appliances included, this home is ready for you to move right in!
Key facts
- Finished basement
- Over 2 acres
- Landscaped yard
Tags
Property features AI
Exterior
- Parking: Detached parking
- Utilities: Well water; Natural gas connected; Cable connected; Electric water heater
- Home design: Ranch-style single family residence; Built in 1976
- Construction: Aluminum siding; Composition roof; Full basement
- Exterior features: Wooded lot; Paved road access
Interior
- Kitchen: Range; Refrigerator; Eat-in kitchen layout
- Bedrooms: Total of 6 rooms (bedroom count not specified)
- Bathrooms: 1 full bathroom; 1 half bathroom
- Heating & cooling: Forced air heating
- Interior features: Eat-in kitchen; Screens and window treatments
- Laundry & utility: Washer; Dryer; Electric water heater
Neighborhood map
What this means for you Summary
Snapshot
- This is a 3-bed/1.5-bath single-family listed at $330k.
Deal economics
- At list price, monthly cash flow is $-92 ($-1k/yr) — negative.
- To cash-flow at today's rent, offer at most $314k (4.9% below list).
- To meet the 1% rule (rent ≥ 1% of price), the offer needs to be $269k (18.5% below list).
- Recommended offer: $269k (18.5% below list) — sets the bar for 1% rule.
- Cap rate 6.2% vs local median 2.8% in Forest Hills — top-decile yield for the area; either an underpriced asset or a hidden risk that comps aren't pricing in. Stress-test before assuming the spread holds.
Location & tenants
- Location reads 76/100 on livability (#139 in MI, #3,404 nationally) — a middle-class / working-renter tenant base. Strengths: schools A+, employment A+, housing A+; Watch: cost of living C-, amenities F, commute F.
- Forest Hills Public Schools (suburban): math 65% / reading 74% proficiency, ranked #11 of 540 in MI (top 2%) — acceptable for families but not a draw, mixed tenant base, ~2y average lease; only 8% free/reduced lunch — higher-income household profile.
- Market conditions: 120 active listings in the ZIP; 2,253 units permitted in Kent County in 2024 (969 in 5+ unit buildings).
Forward outlook
- Local home prices are declining (-3.0%/yr); year-one equity from $2k of loan paydown is wiped out by about $10k of value loss. Plan a longer hold.
- Kent County population projected at +22% by 2050 — long-run rental-demand tailwind backs the buy-and-hold thesis.
Negotiation context
- Only 7 days on market — expect competitive offers; lowballing is unlikely to land.
- 8 sale attempts since 7y ago with the ask held roughly flat each time — persistent listings suggest the price (not the market) is what's stuck; bring a comps-based counter.
- Current owner paid $232k; 42% above their basis — modest negotiation headroom, anchor on the comps not their cost.
Risks & watch-outs
- Watch-outs: flood insurance adds $56/mo.
- Climate carrying-cost: severe flood risk — expect insurance premiums to compound above CPI over the hold.
Questions for the listing agent
- What do current leases actually rent for vs. the listed asking? Can we see a recent rent roll and the last 12 months of T-12 income?
- Built in 1976 — when were the roof, HVAC, electrical panel, plumbing, and water heater last replaced?
- What's the actual annual flood-insurance premium (NFIP or private), and is the property in a SFHA with mandatory coverage?
- Is there a deadline driving the sale (1031 exchange, divorce, estate, relocation)? That informs how much negotiation room exists.
- Schools are A-rated — typically a magnet for longer-tenancy family renters. What's the average tenant stay here, and is there a school-zone premium baked into asking?
- The area grade is low — what's the realistic commute time and amenity access for the typical tenant pool here? Any planned neighborhood developments (good or bad) we should know about?
- What's the average days-on-market for RENTAL listings here right now (not sales)? A rising rental-DOM trend means longer vacancies and softer asking-rent achievability than the comps imply.
- What's the recent tenant-quality profile in this submarket — average credit score on applications, eviction rate, late-payment / NSF rate, and stable-employment percentage? A property-management company in the area should have these aggregated.
- How much new for-sale + rental construction is in the pipeline within 1–3 miles? Heavy new supply typically softens prices + rents 12–24 months out; constrained supply supports both.
Investment metrics
- 1% rule
- 0.82% ✗
- Cap rate
- 6.16%
- Cash-on-cash
- -0.48%
- DSCR
- 0.98
- GRM
- 10.2
CMA / ARV
- ARV (on-the-fly)
- $553,284
- Comps found
- 2
Show comp detail 2 sales within ~0.75 mi
| Address | Dist | Beds/Ba | Sqft | Sold | Price | $/sf | Match |
|---|---|---|---|---|---|---|---|
| 8619 Fulton St E | 0.67mi | 3/2.5 | 1,628 (-4%) | 0mo | $532,600 | $327 | 58 |
| 1300 Sargent Ave SE | 0.51mi | 3/1.5 | 1,914 (+13%) | 17mo | $445,000 | $232 | 40 |
Match score weights: distance 35% · size 25% · config 20% · recency 20%. Top-matched comps best support the ARV.
Projected returns pro-forma
-3.0% appreciation · 3.0% rent growth · sell at horizon
- IRR
- -18.3%
- Equity multiple
- 0.36×
- Total profit
- $-59,326
- Equity at exit
- $49,189
- IRR
- -10.6%
- Equity multiple
- 0.36×
- Total profit
- $-59,210
- Equity at exit
- $28,524
Cash invested: $92,372 (down + closing). Projections, not guarantees.
Landlord ↔ Tenant lean methodology
- Overall (STATE)
- 62 Landlord-Friendly
- State Michigan
- 62 Landlord-Friendly · EVEN
- County
- — inherits STATE
- City
- — inherits STATE
ZIP-level market 49301
- Home prices YoY
- -30.8%
- Active inventory
- 120
- Price-to-rent
- 10.2×
Monthly cashflow live
- Estimated rent
- $2,690 medium interval (Pro) →
- Mortgage (P&I)
- −$1,730
- Tax from tax record
- −$294 /mo · $3,532/yr
- Insurance
- −$137
- Flood insurance flood zone
- −$56 /mo · $666/yr
- HOA
- −$0
- Vacancy / Maint / Mgmt
- −$565
- Net cashflow
- $-92
Break-even live
UW: 25.0% down · 7.5% · 30yr · 1.5% tax · 5.0% vac · 8.0% maint · 8.0% mgmt
Financing live
Cash to close
- Down payment
- $82,475
- Closing costs
- $9,897
- Reserves months
- —
- Total cash needed
- —
Loan-product check · same deal, 3 products live
Conventional
25% down · 7.5% · 30yr
- Down + closing
- —
- Monthly P&I
- —
- Monthly cashflow
- —
- DSCR
- —
- Eligible?
- —
Personal DTI + credit; lowest rate.
DSCR
20% down · 8.5% · 30yr
- Down + closing
- —
- Monthly P&I
- —
- Monthly cashflow
- —
- DSCR
- —
- Eligible?
- —
No personal income docs; deal must DSCR.
Hard money
10% down · 12.0% · 12mo
- Down + closing
- —
- Monthly P&I
- —
- Monthly cashflow
- —
- DSCR
- —
- Eligible?
- —
Short-term bridge; refi at stabilization.
Listing history 7 events
-
2026-06-14status $329,900 Pending 7 DOM
-
2026-06-10days on market $329,900 Active 7 DOM
-
2026-06-09days on market $329,900 Active 6 DOM
-
2026-06-08days on market $329,900 Active 5 DOM
-
2026-06-07days on market $329,900 Active 4 DOM
-
2026-06-03remarks 699-char remark
Show marketing remark (726 chars)
Welcome to 9098 Fulton St. E in Ada! Set on over 2 acres in the highly sought-after Forest Hills Schools, this move-in ready home combines space, style, and convenience. Just minutes from Ada Village, Cascade shopping, coffee spots, and the Thornapple River, you'll love the balance of privacy and proximity to local hot spots. Inside, enjoy fresh paint, newer flooring, and an updated kitchen perfect for entertaining. Bedrooms feature generous closets, while the finished basement offers a large family room and newer half bath. Relax on the expansive back deck overlooking a landscaped yard with room for a pool. With a newer high-efficiency furnace and all appliances included, this home is ready for you to move right in!
-
2026-06-03$329,900 Active 1 DOM
Show marketing remark (726 chars)
Welcome to 9098 Fulton St. E in Ada! Set on over 2 acres in the highly sought-after Forest Hills Schools, this move-in ready home combines space, style, and convenience. Just minutes from Ada Village, Cascade shopping, coffee spots, and the Thornapple River, you'll love the balance of privacy and proximity to local hot spots. Inside, enjoy fresh paint, newer flooring, and an updated kitchen perfect for entertaining. Bedrooms feature generous closets, while the finished basement offers a large family room and newer half bath. Relax on the expansive back deck overlooking a landscaped yard with room for a pool. With a newer high-efficiency furnace and all appliances included, this home is ready for you to move right in!
ⓘ Source: listings_history table (triggers on properties + properties_extension) + one-shot
backfill from property_details.listing_events for pre-trigger history.
Tax reassessment forecast MI · Partial reset (capped growth)
- Current annual tax
- $3,532 · $294/mo
- Projected year-2 tax
- $4,306 · $359/mo
- Expected delta
- +$774/yr (+$65/mo · 21.9%)
ⓘ Screening estimate from a state-policy table — verify with the county assessor before closing.
Climate risk First Street
- Flood 9/10 Extreme FEMA zone X (unshaded) · 99% chance over 30 yrs
- Wildfire 2/10 Low
- Heat 2/10 Low 7 d/yr ≥96°F today · 16 d/yr by 30 yrs out
- Wind 2/10 Low
- Air quality 2/10 Low 1 unhealthy d/yr today · 1 by 30 yrs out
Nearby sold comps map
Loading sold comps map…
Walkable amenities ~0.75 mi
Loading nearby amenities…
Taxation est. · year 1
- Rental income
- $32,281
- − Mortgage interest
- −$18,480
- − Property taxes
- −$3,532
- − Insurance
- −$2,316
- − Repairs & maintenance
- −$2,582
- − Management
- −$2,582
- − Depreciation
- −$9,597
- Taxable loss
- −$6,808
- Est. tax savings @ 24.0%
- +$1,634
- After-tax cash flow
- $528/yr
For passive investors: Depreciation is non-cash, so a rental often shows a tax loss while cash-flowing — sheltering income. Rental losses are passive: they offset passive income freely, and up to $25,000/yr can offset ordinary (W-2) income if you actively participate and your MAGI is under $100k (phasing out to $0 by $150k); unused losses carry forward. On sale, claimed depreciation is recaptured at up to 25%, and gains may owe capital-gains tax (a 1031 exchange can defer both). Figures are a year-1 estimate at your 24.0% rate — not tax advice; consult a CPA.
Schools (NCES district)
- District
- Forest Hills Public Schools
- NCES district ID
- 2614610
- Math proficiency
- 65% ▼ -3.00%
- Reading proficiency
- 74% ▲ 1.00%
- Median HH income
- $95,067
- Composite
- 63.23/100
- National rank
- #632
- State rank
- #11 of 540 in MI
Livability — Forest Hills
- Score
- 76/100
- State rank
- #139
- US rank
- #3404
Category grades
Schools grade is shown separately in the Schools card above.
Census & demographics
- Census place
- Forest Hills, MI
- City population
- 53,921
- Population (ZIP)
- 20,492
Population outlook (Kent County) Hauer SSP2
- Today (2025)
- 712,484 people
- By 2030
- 748,618 · +5.1%
- By 2040
- 814,777 · +14.4%
- By 2050
- 868,556 · +21.9%
- By 2075
- 966,487 · +35.7%
- By 2100
- 967,975 · +35.9%
Race, ethnicity, and origin ACS 2023
- Neighborhood character
- Predominantly White (86%)
- Race & ethnicity
- White 86% Two or more races 6% Hispanic / Latino 5% Asian 4%
- Hispanic origin (detail)
- Mexican 2%
- Common ancestry
- Iranian 16% Romanian 6% Italian 4%
- Foreign-born
- 5% · Canada, China, Jamaica
- Languages at home
- 90% English-only · Spanish 4% Korean 1% Other Indo-European 1%
Political lean MEDSL · Kent
- 2024 margin
- Lean D (+5.4) · D 51.8% · R 46.5% · Other 1.7%
- 2008→2024 swing
- +4.8pp toward D · 2008: 0.5pp · 2024: 5.4pp
- All cycles
- 2024: D+5.4 2020: D+6.1 2016: R+3.1 2012: R+7.9 2008: D+0.5
Not yet ingested
- Civics
- —
Market trends
- HPI YoY
- ▼ -118.11%
- Current HPI
- 264.8246
- Rent YoY
- —
- Metro
- —
- State GDP YoY
- ▲ 1.37%
- F500 in state
- 28
Industry mix (Fortune 500 HQ in MI)
| Industry | F500 HQs | Revenue |
|---|---|---|
| Automotive Parts | 3 | $48B |
|
||
| Automotive | 2 | $372B |
|
||
| Chemicals | 1 | $45B |
|
||
| Automotive Retail | 1 | $29B |
|
||
| Healthcare / Medical Devices | 1 | $23B |
|
||
| Automotive Technology | 1 | $20B |
|
||
Price history
+37.5% since first listed18 events — show timeline
- 2026-06-03 Listed $329,900 REALCOMP
- 2026-06-03 Listed $329,900 SW Michigan MLS
- 2026-06-03 Listed $329,900 MiRealSource-MiMLS
- 2025-10-28 Listing Removed — MiRealSource-MiMLS
- 2025-10-14 Price Changed $349,900 MiRealSource-MiMLS
- 2025-10-14 Price Changed $349,900 REALCOMP
- 2025-10-14 Price Changed $349,900 SW Michigan MLS
- 2025-08-16 Listed $359,900 REALCOMP
- 2025-08-16 Listed $359,900 MiRealSource-MiMLS
- 2020-03-04 Sold (Public Records) $232,000 Public Records
- 2020-02-28 Sold (MLS) $232,000 SW Michigan MLS
- 2020-02-28 Sold (MLS) $232,000 REALCOMP
- 2020-01-11 Pending — SW Michigan MLS
- 2019-10-14 Price Changed $239,900 SW Michigan MLS
- 2019-08-26 Price Changed $249,900 SW Michigan MLS
- 2019-08-15 Listed $239,900 MiRealSource-MiMLS
- 2019-08-15 Listed $275,000 SW Michigan MLS
- 2019-08-15 Listed $239,900 REALCOMP
Property tax history
+6.8%/yrLatest (2025): $3,532 · +2.6% YoY. Source: county tax records.
Cash-flow waterfall
monthlySold comps — $/sqft
last 12 mo · ≤1 miLoading sold comps…