 Multi-family
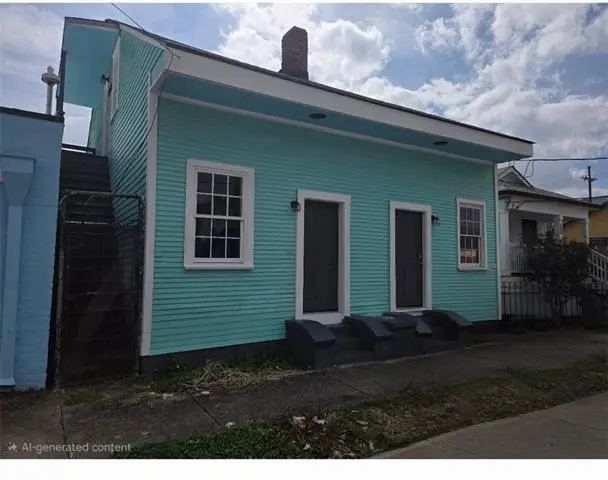
2254-56 N Derbigny St · New Orleans, LA
Flood risk 8/10 · Major
- FEMA flood zone
- X
- Chance of flooding over 30 yrs
- 0.6%
- Est. flood insurance / yr
- $507 – $1,088
Fire risk 1/10 · Minimal
- Est. fire insurance / yr
- $1,269 – $2,357
Heat risk 10/10 · Severe
- Hot days now (above 108°F)
- 7 days/yr
- Hot days in 30 yrs
- 21 days/yr
Wind risk 10/10 · Severe
- Chance of severe wind over 30 yrs
- 99.0%
Air-quality risk 4/10 · Minor
- Unhealthy air days now
- 4 days/yr
- Unhealthy air days in 30 yrs
- 4 days/yr
Risk factors via First Street. Map © Google.
Why this score? — see what drove the D+ grade
The composite is a weighted blend of 9 inputs, each scored 0–100. Each bar is that input's sub-score; the figure is the points it added to the 100-point composite (weight × sub-score).
- Cash flow +20.1/30.0
- ARV discount +7.5/15.0
- DSCR +6.4/10.0
- 1% rule +4.3/10.0
- Livability +4.0/5.0
- Rent growth +3.1/5.0
- Condition / age +2.5/5.0
- Schools +1.6/10.0
- Appreciation +0.0/10.0
$479,000
🖨 Deal sheet (PDF) 📄 Offer letter ✓ Due diligence
Multi-family units
County records classify this as Multi-Family (2-4 Unit). Listing-text estimate: 1 unit. estimate disagrees with records
Listing remarks MLS
Newly Renovated 3 plex in New Orleans, Great Investment Property. Wood Flooring throughout house, ceramic tile flooring in bathrooms and tile tub enclosures. New fixtures throughout house. Ceiling fans. Very nice a must see! Owner/Agent
Key facts
- Wood flooring
- Tile tub enclosures
- Ceiling fans
Tags
Neighborhood map
What this means for you Summary
Snapshot
- This is a 6-bed/2.0-bath multifamily listed at $479k.
Deal economics
- At list price, monthly cash flow is $526 ($6k/yr) — positive.
- The deal already cash-flows at list — no discount required.
- To meet the 1% rule (rent ≥ 1% of price), the offer needs to be $446k (6.9% below list).
- Recommended offer: $422k (12.0% below list) — sets the bar for market timing.
- Cap rate 7.8% vs local median 4.3% in New Orleans — top-decile yield for the area; either an underpriced asset or a hidden risk that comps aren't pricing in. Stress-test before assuming the spread holds.
Location & tenants
- Location reads 81/100 on livability (#3 in LA, #1,383 nationally) — a professional / high-income tenant draw. Strengths: amenities A+, commute A+, health & safety A+; Watch: crime C-, employment D.
- Orleans Parish (urban): math 11% / reading 27% proficiency, ranked #69 of 98 in LA (top 70%) — low school quality limits family demand, transient renter base, plan for 1-2y turnover; 68% free/reduced lunch — lower-income household profile, screen leases tightly.
- Market conditions: Rents rising (+2.5%/yr); 587 active listings in the ZIP; 1 comparable units currently listed for rent nearby; 710 units permitted in Orleans Parish in 2024 (244 in 5+ unit buildings).
- At $4,461/mo this rent would consume 117% of the median local household income ($46k/yr) (locally 1988% of renters already pay >50% of income on rent) — very limited rent-growth headroom before tenants either downsize or default.
Forward outlook
- Local home prices are declining (-3.0%/yr); year-one equity from $3k of loan paydown is wiped out by about $14k of value loss. Plan a longer hold.
- Orleans County population projected at +61% by 2050 — long-run rental-demand tailwind backs the buy-and-hold thesis.
Negotiation context
- It's been on market 122 days — a 12% lower offer ($422k) is reasonable based on typical stale-listing flexibility.
- 3 sale attempts since 27y ago with the ask held roughly flat each time — persistent listings suggest the price (not the market) is what's stuck; bring a comps-based counter.
Risks & watch-outs
- Watch-outs: flood insurance adds $66/mo; built in 1930 — expect roof / HVAC / electrical / plumbing capex.
- Climate carrying-cost: severe flood risk; severe wind risk, 99% chance of damaging wind over 30y; extreme-heat days projected 7→21/yr by 2055 (HVAC capex compounding) — expect insurance premiums to compound above CPI over the hold.
Questions for the listing agent
- It's been on market 122 days. Have you received any prior offers? Is the seller open to a 12% concession, seller financing, or rate buy-down credit?
- Built in 1930 — when were the roof, HVAC, electrical panel, plumbing, and water heater last replaced?
- What's the actual annual flood-insurance premium (NFIP or private), and is the property in a SFHA with mandatory coverage?
- Why hasn't it sold? Are there any deal-killer items the seller is aware of (foundation, flood, title, zoning, code violations)?
- Is there a deadline driving the sale (1031 exchange, divorce, estate, relocation)? That informs how much negotiation room exists.
- The area grade is low — what's the realistic commute time and amenity access for the typical tenant pool here? Any planned neighborhood developments (good or bad) we should know about?
- What's the average days-on-market for RENTAL listings here right now (not sales)? A rising rental-DOM trend means longer vacancies and softer asking-rent achievability than the comps imply.
- What's the recent tenant-quality profile in this submarket — average credit score on applications, eviction rate, late-payment / NSF rate, and stable-employment percentage? A property-management company in the area should have these aggregated.
- How much new apartment / multifamily construction is in the pipeline within 1–3 miles? Heavy new supply (>2% of stock underway) typically softens rents 12–24 months out; light construction supports rent growth.
Investment metrics
- 1% rule
- 0.93% ✗
- Cap rate
- 7.78%
- Cash-on-cash
- 5.30%
- DSCR
- 1.24
- GRM
- 8.9
CMA / ARV
- ARV (median comp)
- $267,911
- List price
- $479,000
- Delta
- 78.79%
- Verdict
- OVERPRICED
- Comps
- 20 within 1.0 mi
Show comp detail 11 sales within ~0.75 mi
| Address | Dist | Beds/Ba | Sqft | Sold | Price | $/sf | Match |
|---|---|---|---|---|---|---|---|
| 1741 43 Marigny St | 0.19mi | 5/2.5 (-1) | 2,950 (-5%) | 1mo | $205,000 | $69 | 75 |
| 1612 14 Saint Roch Ave | 0.15mi | 6/4.0 | 2,660 (-14%) | 6mo | $500,000 | $188 | 56 |
| 2232 Annette St | 0.63mi | 6/2.0 | 2,886 (-7%) | 9mo | $280,000 | $97 | 52 |
| 1519-21 N Villere St | 0.65mi | 6/4.0 | 3,010 (-3%) | 11mo | $496,000 | $165 | 48 |
| 2255 57 N Miro St | 0.38mi | 7/4.0 (+1) | 3,220 (+4%) | 20mo | $287,500 | $89 | 46 |
| 2535-37 N Rampart St | 0.51mi | 5/2.0 (-1) | 2,700 (-13%) | 7mo | $350,000 | $130 | 44 |
| 1501-03 Marais St | 0.65mi | 6/4.0 | 2,680 (-13%) | 6mo | $690,000 | $257 | 34 |
| 1417 19 Kerlerec St | 0.74mi | 6/3.0 | 2,796 (-10%) | 23mo | $479,000 | $171 | 26 |
| 2231 Royal St | 0.66mi | 6/6.0 | 3,400 (+10%) | 16mo | $725,000 | $213 | 23 |
| 2237 Royal St | 0.66mi | 5/5.0 (-1) | 3,400 (+10%) | 16mo | $700,000 | $206 | 22 |
| 1241 Kerlerec St | 0.69mi | 6/6.0 | 3,507 (+13%) | 12mo | $555,000 | $158 | 20 |
Match score weights: distance 35% · size 25% · config 20% · recency 20%. Top-matched comps best support the ARV.
Projected returns pro-forma
-3.0% appreciation · 2.49% rent growth · sell at horizon
- IRR
- -9.5%
- Equity multiple
- 0.65×
- Total profit
- $-46,521
- Equity at exit
- $71,420
- IRR
- -0.8%
- Equity multiple
- 0.95×
- Total profit
- $-7,129
- Equity at exit
- $41,415
Cash invested: $134,120 (down + closing). Projections, not guarantees.
Landlord ↔ Tenant lean methodology
- Overall (STATE)
- 90 Strongly Landlord-Friendly
- State Louisiana
- 90 Strongly Landlord-Friendly · R+12
- County
- — inherits STATE
- City
- — inherits STATE
ZIP-level market 70117
- Rents YoY
- 2.5%
- Active inventory
- 587
- Price-to-rent
- 26.8×
Monthly cashflow live
- Estimated rent
- $4,461 high interval (Pro) →
- Mortgage (P&I)
- −$2,512
- Tax from tax record
- −$220 /mo · $2,643/yr
- Insurance
- −$200
- Flood insurance flood zone
- −$66 /mo · $798/yr
- HOA
- −$0
- Vacancy / Maint / Mgmt
- −$937
- Net cashflow
- $526
Break-even live
Sensitivity live
| Price | -10% $797 | -5% $662 | +0% $526 | +5% $390 | +10% $255 |
|---|---|---|---|---|---|
| Rent | -10% $174 | -5% $350 | +0% $526 | +5% $702 | +10% $878 |
| Rate | -1.0pp $767 | -0.5pp $648 | base $526 | +0.5pp $402 | +1.0pp $276 |
3-unit breakdown (identical units grouped — click to expand)
| Units | Beds | Baths | Est. rent |
|---|---|---|---|
| 3× units | 2 | 1 | $4,461 |
| #1 | 2 | 1 | $1,487 |
| #2 | 2 | 1 | $1,487 |
| #3 | 2 | 1 | $1,487 |
| Total (3 units) | $4,461 | ||
UW: 25.0% down · 7.5% · 30yr · 1.5% tax · 5.0% vac · 8.0% maint · 8.0% mgmt
Financing live
Cash to close
- Down payment
- $119,750
- Closing costs
- $14,370
- Reserves months
- —
- Total cash needed
- —
Loan-product check · same deal, 3 products live
Conventional
25% down · 7.5% · 30yr
- Down + closing
- —
- Monthly P&I
- —
- Monthly cashflow
- —
- DSCR
- —
- Eligible?
- —
Personal DTI + credit; lowest rate.
DSCR
20% down · 8.5% · 30yr
- Down + closing
- —
- Monthly P&I
- —
- Monthly cashflow
- —
- DSCR
- —
- Eligible?
- —
No personal income docs; deal must DSCR.
Hard money
10% down · 12.0% · 12mo
- Down + closing
- —
- Monthly P&I
- —
- Monthly cashflow
- —
- DSCR
- —
- Eligible?
- —
Short-term bridge; refi at stabilization.
Rent comps 1 comps
| Address | Beds | Baths | Sqft | Rent | $/sqft | DOM | Units | Dist |
|---|---|---|---|---|---|---|---|---|
| 2317 N Rampart St Unit 1272378P New Orleans, LA | 3.0–6.0 | 2.0–4.0 | 1581 | $8,133 | $5.14 | 4d | 2 | 0.43mi |
Listing history 20 events
-
2026-06-21days on market $479,000 Active 122 DOM
-
2026-06-18days on market $479,000 Active 119 DOM
-
2026-06-17days on market $479,000 Active 118 DOM
-
2026-06-16days on market $479,000 Active 117 DOM
-
2026-06-15days on market $479,000 Active 116 DOM
-
2026-06-13days on market $479,000 Active 114 DOM
-
2026-06-10days on market $479,000 Active 111 DOM
-
2026-06-09days on market $479,000 Active 110 DOM
-
2026-06-08days on market $479,000 Active 109 DOM
-
2026-06-07days on market $479,000 Active 108 DOM
-
2026-06-05days on market $479,000 Active 105 DOM
-
2026-06-03days on market $479,000 Active 104 DOM
-
2026-06-02days on market $479,000 Active 103 DOM
-
2026-06-01days on market $479,000 Active 102 DOM
-
2026-05-31days on market $479,000 Active 101 DOM
-
2026-02-19$479,000 Active 236-char remark
Show marketing remark (236 chars)
Newly Renovated 3 plex in New Orleans, Great Investment Property. Wood Flooring throughout house, ceramic tile flooring in bathrooms and tile tub enclosures. New fixtures throughout house. Ceiling fans. Very nice a must see! Owner/Agent
-
2015-11-20soldstatus $419,000
-
2005-01-12$125,000
-
2001-01-29soldstatus $95,000
-
1999-11-11$34,300
ⓘ Source: listings_history table (triggers on properties + properties_extension) + one-shot
backfill from property_details.listing_events for pre-trigger history.
Tax reassessment forecast LA · Resets to sale price
- Current annual tax
- $2,643 · $220/mo
- Projected year-2 tax
- $2,643 · $220/mo
- Expected delta
- $0/yr ($0/mo · 0.0%)
ⓘ Screening estimate from a state-policy table — verify with the county assessor before closing.
Climate risk First Street
- Flood 8/10 Severe FEMA zone X · 60% chance over 30 yrs
- Wildfire 1/10 Low
- Heat 10/10 Extreme 7 d/yr ≥108°F today · 21 d/yr by 30 yrs out
- Wind 10/10 Extreme 99% chance of damaging wind over 30 yrs
- Air quality 4/10 Moderate 4 unhealthy d/yr today · 4 by 30 yrs out
Nearby sold comps map
Loading sold comps map…
Walkable amenities ~0.75 mi
Loading nearby amenities…
Taxation est. · year 1
- Rental income
- $53,532
- − Mortgage interest
- −$26,831
- − Property taxes
- −$2,643
- − Insurance
- −$3,192
- − Repairs & maintenance
- −$4,283
- − Management
- −$4,283
- − Depreciation
- −$13,935
- Taxable loss
- −$1,635
- Est. tax savings @ 24.0%
- +$392
- After-tax cash flow
- $6,704/yr
For passive investors: Depreciation is non-cash, so a rental often shows a tax loss while cash-flowing — sheltering income. Rental losses are passive: they offset passive income freely, and up to $25,000/yr can offset ordinary (W-2) income if you actively participate and your MAGI is under $100k (phasing out to $0 by $150k); unused losses carry forward. On sale, claimed depreciation is recaptured at up to 25%, and gains may owe capital-gains tax (a 1031 exchange can defer both). Figures are a year-1 estimate at your 24.0% rate — not tax advice; consult a CPA.
Schools (NCES district)
- District
- Orleans Parish
- NCES district ID
- 2201170
- Math proficiency
- 11% ▼ -52.00%
- Reading proficiency
- 27% ▼ -46.00%
- Median HH income
- $37,011
- Composite
- 15.78/100
- National rank
- #9271
- State rank
- #69 of 98 in LA
Livability — New Orleans
- Score
- 81/100
- State rank
- #3
- US rank
- #1383
Category grades
Schools grade is shown separately in the Schools card above.
Census & demographics
- Census place
- New Orleans, LA
- County
- Orleans Parish · 338,817 people
- City population
- 338,817
- Metro
- New Orleans-Metairie, LA
- Population (ZIP)
- 25,652
- Household income
- $45,764
- Rent vs Own
- Severe rent burden
- 1988.0
Population outlook (Orleans County) Hauer SSP2
- Today (2025)
- 513,025 people
- By 2030
- 575,781 · +12.2%
- By 2040
- 700,174 · +36.5%
- By 2050
- 826,541 · +61.1%
- By 2075
- 1,123,374 · +119.0%
- By 2100
- 1,355,609 · +164.2%
Race, ethnicity, and origin ACS 2023
- Neighborhood character
- Majority Black (60%)
- Race & ethnicity
- Black 60% White 30% Two or more races 6% Hispanic / Latino 5%
- Common ancestry
- Lithuanian 5% Italian 1% Romanian 1%
- Foreign-born
- 5% · Canada, South Korea
- Languages at home
- 93% English-only · Spanish 3% Other Indo-European 1% French/Haitian/Cajun 1%
Political lean MEDSL · Orleans
- 2024 margin
- Solid D (+67.0) · D 82.2% · R 15.2% · Other 2.7%
- 2008→2024 swing
- +6.7pp toward D · 2008: 60.3pp · 2024: 67.0pp
- All cycles
- 2024: D+67.0 2020: D+68.2 2016: D+66.2 2012: D+62.5 2008: D+60.3
Not yet ingested
- Civics
- —
Market trends
- HPI YoY
- ▼ -177.22%
- Current HPI
- 184.6061
- Rent YoY
- ▲ 2.49%
- Metro
- New Orleans-Metairie, LA
- State GDP YoY
- ▲ 3.29%
- F500 in state
- 10
Industry mix (Fortune 500 HQ in LA)
| Industry | F500 HQs | Revenue |
|---|---|---|
| Telecommunications | 2 | $23B |
|
||
| Utilities | 1 | $12B |
|
||
| Wholesale / Distribution | 1 | $5B |
|
||
| Advertising | 1 | $2B |
|
||
Price history
+1296.5% since first listed5 events — show timeline
- 2026-02-19 Listed $479,000 AcadianaMLS
- 2015-11-20 Sold (Public Records) $419,000 Public Records
- 2005-01-12 Listed $125,000 AcadianaMLS
- 2001-01-29 Sold (Public Records) $95,000 Public Records
- 1999-11-11 Listed $34,300 AcadianaMLS
Property tax history
+7.0%/yrLatest (2026): $2,643 · +1.1% YoY. Source: county tax records.
Cash-flow waterfall
monthlySold comps — $/sqft
last 12 mo · ≤1 miLoading sold comps…