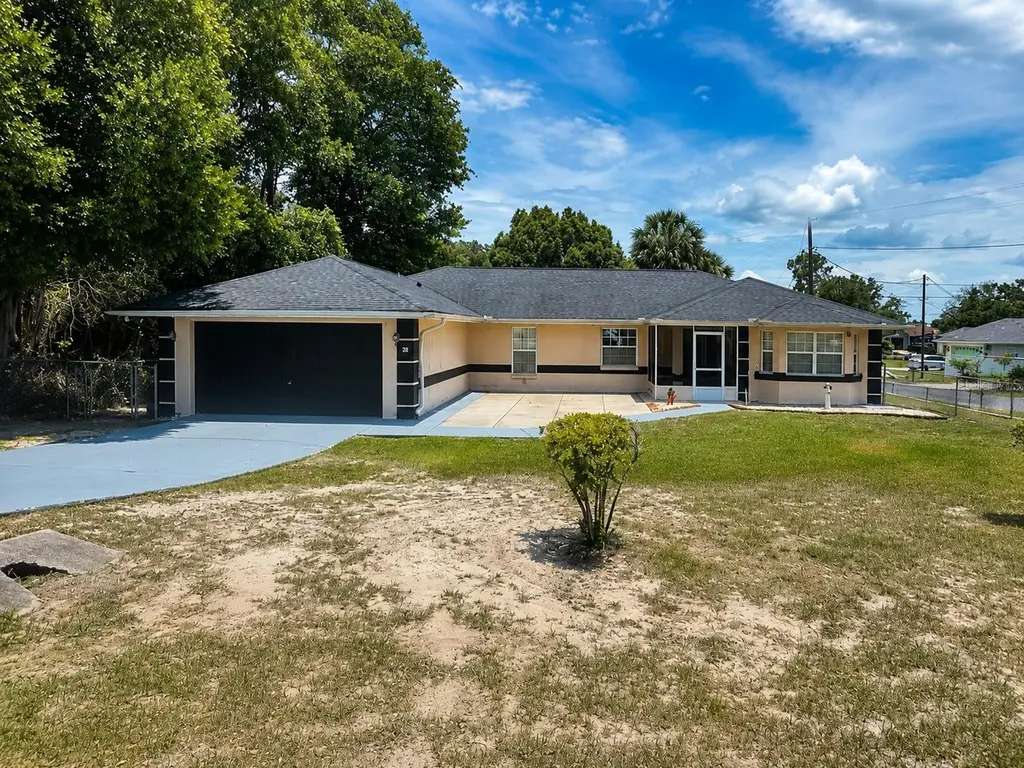
52 Redwood Trce · Silver Springs Shores, FL
Flood risk 4/10 · Minor
- FEMA flood zone
- X (unshaded)
- Chance of flooding over 30 yrs
- 0.24%
- Est. flood insurance / yr
- $507 – $1,088
Fire risk 4/10 · Minor
- Est. fire insurance / yr
- $947 – $1,759
Heat risk 8/10 · Major
- Hot days now (above 108°F)
- 7 days/yr
- Hot days in 30 yrs
- 21 days/yr
Wind risk 9/10 · Severe
- Chance of severe wind over 30 yrs
- 99.0%
Air-quality risk 3/10 · Minor
- Unhealthy air days now
- 3 days/yr
- Unhealthy air days in 30 yrs
- 4 days/yr
Risk factors via First Street. Map © Google.
Why this score? — see what drove the C+ grade
The composite is a weighted blend of 9 inputs, each scored 0–100. Each bar is that input's sub-score; the figure is the points it added to the 100-point composite (weight × sub-score).
- Cash flow +17.2/30.0
- ARV discount +15.0/15.0
- Appreciation +8.0/10.0
- DSCR +5.4/10.0
- 1% rule +4.1/10.0
- Schools +3.6/10.0
- Livability +3.4/5.0
- Rent growth +2.5/5.0
- Condition / age +2.5/5.0
$214,900
🖨 Deal sheet 📄 Offer letter ✓ Due diligence
Listing remarks
Opportunity awaits at 52 Redwood Trace, Ocala, FL 34472! This 3-bedroom, 2-bathroom home with a 2-car garage offers a functional layout and plenty of potential for homeowners, investors, or buyers looking to add their personal touch. The property features spacious living areas, comfortable bedrooms, and a practical floor plan ready for updates and improvements. Conveniently located with convenient access to shopping, dining, schools, and major roadways, this home makes it easy to enjoy everything Ocala has to offer. Whether you're searching for a primary residence, seasonal retreat, or investment opportunity, this property is full of potential and ready for its next chapter. Being sold in i
Key facts
- 0.26 acre lot
- Garage
- Built 2003
Property features AI
Finance
- Other: Property zoning: R1
- HOA & community: No HOA association indicated
Exterior
- Parking: Attached garage (1-car)
- Utilities: Public water; Public sewer; Other utilities
- Home design: Single Family Residence; Residential property; One story; Faces west
- Construction: Concrete construction; Shingle roof; Slab foundation; Built on a 0.26-acre lot (approx. 1/4 to less than 1/2 acre)
- Exterior features: Other exterior features; Cleared lot; Paved road access
Interior
- Bedrooms: 3 bedrooms
- Flooring: Other flooring
- Bathrooms: 2 full bathrooms
- Heating & cooling: Electric heating; Heat pump; Central air conditioning
- Interior features: Other interior features
- Laundry & utility: Laundry features: Other
Neighborhood map
What this means for you Summary
Snapshot
- This is a 3-bed/2.0-bath single-family listed at $215k.
Deal economics
- At list price, monthly cash flow is $154 ($2k/yr) — positive.
- The deal already cash-flows at list — no discount required.
- To meet the 1% rule (rent ≥ 1% of price), the offer needs to be $196k (8.7% below list).
- Recommended offer: $196k (8.7% below list) — sets the bar for 1% rule.
- Cap rate 7.2% vs local median 4.7% in Silver Springs Shores — top-decile yield for the area; either an underpriced asset or a hidden risk that comps aren't pricing in. Stress-test before assuming the spread holds.
Location & tenants
- Location reads 68/100 on livability (#527 in FL) — a middle-class / working-renter tenant base. Strengths: cost of living A+, housing A+, health & safety A-; Watch: crime C-, employment D, schools F.
- Marion (rural): math 42% / reading 43% proficiency, ranked #61 of 73 in FL (top 84%) — families likely to look elsewhere, expect single-tenant / working-renter base with shorter leases; 61% free/reduced lunch — lower-income household profile, screen leases tightly.
- Market conditions: Rents flat; 674 active listings in the ZIP; 7 comparable units currently listed for rent nearby; rentals at typical pace (median 22d on market — plan ~3-4 weeks tenant-placement turnaround); 7,071 units permitted in Marion County in 2024 (534 in 5+ unit buildings).
- This rent runs 37% of the median local income ($64k/yr) — at the standard rent-burdened threshold; future hikes will face affordability resistance.
Forward outlook
- In year one you build about $14k of equity ($1k loan paydown + $13k appreciation (5.9% local appreciation)).
- Marion County population projected at +13% by 2050 — modest demand growth; plan on rents tracking national, not racing it.
- At projected returns (5.9% appreciation + 0.2% rent growth), your $60k cash investment doubles in ~4 years — after that, you're playing with house money.
- By year 3, paydown + projected appreciation supports a ~$35k cash-out refi (75% LTV) — recoverable capital for the next deal without selling this one.
Negotiation context
- Only 6 days on market — expect competitive offers; lowballing is unlikely to land.
- Current owner paid $154k; 40% above their basis — modest negotiation headroom, anchor on the comps not their cost.
Risks & watch-outs
- Climate carrying-cost: severe wind risk, 99% chance of damaging wind over 30y; extreme-heat days projected 7→21/yr by 2055 (HVAC capex compounding) — expect insurance premiums to compound above CPI over the hold.
Questions for the listing agent
- Is there a deadline driving the sale (1031 exchange, divorce, estate, relocation)? That informs how much negotiation room exists.
- Schools are F-rated, which usually means shorter tenancies and higher turnover. Who's the typical renter profile here, and what's been the actual vacancy rate?
- What's the average days-on-market for RENTAL listings here right now (not sales)? A rising rental-DOM trend means longer vacancies and softer asking-rent achievability than the comps imply.
- What's the recent tenant-quality profile in this submarket — average credit score on applications, eviction rate, late-payment / NSF rate, and stable-employment percentage? A property-management company in the area should have these aggregated.
- How much new for-sale + rental construction is in the pipeline within 1–3 miles? Heavy new supply typically softens prices + rents 12–24 months out; constrained supply supports both.
Investment metrics
- 1% rule
- 0.91% ✗
- Cap rate
- 7.15%
- Cash-on-cash
- 3.07%
- DSCR
- 1.14
- GRM
- 9.1
CMA / ARV
- ARV (on-the-fly)
- $336,480
- Comps found
- 4
Show comp detail 4 sales within ~0.75 mi
| Address | Dist | Beds/Ba | Sqft | Sold | Price | $/sf | Match |
|---|---|---|---|---|---|---|---|
| 9 Pecan Run Ter | 0.22mi | 4/2.0 (+1) | 1,828 (-13%) | 4mo | $323,070 | $177 | 60 |
| 5347 Pecan Rd | 0.63mi | 3/2.0 | 1,988 (-6%) | 10mo | $319,000 | $160 | 53 |
| 45 Pecan Course Loop | 0.64mi | 3/2.0 | 1,936 (-8%) | 9mo | $299,900 | $155 | 49 |
| 6229 Hemlock Rd | 0.73mi | 3/2.0 | 1,936 (-8%) | 22mo | $299,900 | $155 | 34 |
Match score weights: distance 35% · size 25% · config 20% · recency 20%. Top-matched comps best support the ARV.
Projected returns pro-forma
5.93% appreciation · 0.17% rent growth · sell at horizon
- IRR
- 16.5%
- Equity multiple
- 2.09×
- Total profit
- $65,518
- Equity at exit
- $134,180
- IRR
- 15.5%
- Equity multiple
- 3.92×
- Total profit
- $175,405
- Equity at exit
- $242,543
Cash invested: $60,172 (down + closing). Projections, not guarantees.
Landlord ↔ Tenant lean methodology
- Overall (STATE)
- 87 Strongly Landlord-Friendly
- State Florida
- 87 Strongly Landlord-Friendly · R+3
- County
- — inherits STATE
- City
- — inherits STATE
ZIP-level market 34472
- Home prices YoY
- 2.4%
- Rents YoY
- 0.2%
- Active inventory
- 674
- Price-to-rent
- 9.1×
Monthly cashflow live
- Estimated rent
- $1,963 high interval (Pro) →
- Mortgage (P&I)
- −$1,127
- Tax from tax record
- −$180 /mo · $2,165/yr
- Insurance
- −$90
- HOA
- −$0
- Vacancy / Maint / Mgmt
- −$412
- Net cashflow
- $154
Break-even live
UW: 25.0% down · 7.5% · 30yr · 1.5% tax · 5.0% vac · 8.0% maint · 8.0% mgmt
Financing live
Cash to close
- Down payment
- $53,725
- Closing costs
- $6,447
- Reserves months
- —
- Total cash needed
- —
Loan-product check · same deal, 3 products live
Conventional
25% down · 7.5% · 30yr
- Down + closing
- —
- Monthly P&I
- —
- Monthly cashflow
- —
- DSCR
- —
- Eligible?
- —
Personal DTI + credit; lowest rate.
DSCR
20% down · 8.5% · 30yr
- Down + closing
- —
- Monthly P&I
- —
- Monthly cashflow
- —
- DSCR
- —
- Eligible?
- —
No personal income docs; deal must DSCR.
Hard money
10% down · 12.0% · 12mo
- Down + closing
- —
- Monthly P&I
- —
- Monthly cashflow
- —
- DSCR
- —
- Eligible?
- —
Short-term bridge; refi at stabilization.
Rent comps 7 comps
| Address | Beds | Baths | Sqft | Rent | $/sqft | DOM | Units | Dist |
|---|---|---|---|---|---|---|---|---|
| 38 Pecan Run Pass Ocala, FL | 4.0 | 2.5 | 2086 | $2,100 | $1.01 | 21d | 1 | 0.51mi |
| 45 Redwood Run Ocala, FL | 3.0 | 2.0 | 1435 | $1,695 | $1.18 | 21d | 1 | 0.67mi |
| 6875 SE 52nd St Ocala, FL | 3.0 | 2.0 | 1624 | $1,750 | $1.08 | 21d | 1 | 0.72mi |
| 106 Redwood Track Crse Ocala, FL | 3.0 | 2.0 | 1412 | $1,675 | $1.19 | 14d | 1 | 0.92mi |
| 492 Hickory Course Loop Ocala, FL | 4.0 | 2.0 | 1483 | $1,750 | $1.18 | 21d | 1 | 1.37mi |
| 149 Hickory Course Cir Ocala, FL | 4.0 | 2.0 | 1827 | $2,100 | $1.15 | 14d | 1 | 1.39mi |
| 136 Hickory Course Loop Ocala, FL | 4.0 | 2.0 | 1828 | $1,990 | $1.09 | 14d | 1 | 1.40mi |
Listing history 6 events
-
2026-06-18days on market $214,900 Active 6 DOM
-
2026-06-17days on market $214,900 Active 5 DOM
-
2026-06-16days on market $214,900 Active 4 DOM
-
2026-06-15days on market $214,900 Active 3 DOM
-
2026-06-13remarks 699-char remark
-
2026-06-13$214,900 Active 1 DOM
ⓘ Source: listings_history table (triggers on properties + properties_extension) + one-shot
backfill from property_details.listing_events for pre-trigger history.
Tax reassessment forecast FL · Resets to sale price
- Current annual tax
- $2,165 · $180/mo
- Projected year-2 tax
- $2,165 · $180/mo
- Expected delta
- $0/yr ($0/mo · 0.0%)
ⓘ Screening estimate from a state-policy table — verify with the county assessor before closing.
Climate risk First Street
- Flood 4/10 Moderate FEMA zone X (unshaded) · 24% chance over 30 yrs
- Wildfire 4/10 Moderate
- Heat 8/10 Severe 7 d/yr ≥108°F today · 21 d/yr by 30 yrs out
- Wind 9/10 Extreme 99% chance of damaging wind over 30 yrs
- Air quality 3/10 Moderate 3 unhealthy d/yr today · 4 by 30 yrs out
Nearby sold comps map
Loading sold comps map…
Walkable amenities ~0.75 mi
Loading nearby amenities…
Taxation est. · year 1
- Rental income
- $23,555
- − Mortgage interest
- −$12,038
- − Property taxes
- −$2,165
- − Insurance
- −$1,074
- − Repairs & maintenance
- −$1,884
- − Management
- −$1,884
- − Depreciation
- −$6,252
- Taxable loss
- −$1,743
- Est. tax savings @ 24.0%
- +$418
- After-tax cash flow
- $2,263/yr
For passive investors: Depreciation is non-cash, so a rental often shows a tax loss while cash-flowing — sheltering income. Rental losses are passive: they offset passive income freely, and up to $25,000/yr can offset ordinary (W-2) income if you actively participate and your MAGI is under $100k (phasing out to $0 by $150k); unused losses carry forward. On sale, claimed depreciation is recaptured at up to 25%, and gains may owe capital-gains tax (a 1031 exchange can defer both). Figures are a year-1 estimate at your 24.0% rate — not tax advice; consult a CPA.
Schools (NCES district)
- District
- Marion
- NCES district ID
- 1201260
- Math proficiency
- 42% ▼ -7.00%
- Reading proficiency
- 43% ▼ -4.00%
- Median HH income
- $40,015
- Composite
- 35.61/100
- National rank
- #4890
- State rank
- #61 of 73 in FL
Livability — Silver Springs Shores
- Score
- 68/100
- State rank
- #527
- US rank
- #9854
Category grades
Schools grade is shown separately in the Schools card above.
Census & demographics
- Census place
- Silver Springs Shores, FL
- County
- Marion County · 315,796 people
- City population
- 34,665
- Metro
- Ocala, FL
- Population (ZIP)
- 35,851
- Household income
- $64,208
- Rent vs Own
- Severe rent burden
- 655.0
Population outlook (Marion County) Hauer SSP2
- Today (2025)
- 365,905 people
- By 2030
- 376,768 · +3.0%
- By 2040
- 396,555 · +8.4%
- By 2050
- 412,723 · +12.8%
- By 2075
- 446,090 · +21.9%
- By 2100
- 436,193 · +19.2%
Race, ethnicity, and origin ACS 2023
- Neighborhood character
- Diverse neighborhood (Simpson 0.65)
- Race & ethnicity
- White 50% Hispanic / Latino 25% Black 21% Two or more races 18% Asian 2%
- Hispanic origin (detail)
- Mexican 2% Puerto Rican 14% Cuban 3%
- Common ancestry
- Romanian 2% Iranian 1% Lithuanian 1%
- Foreign-born
- 11% · Canada, Jamaica, China
- Languages at home
- 78% English-only · Spanish 19% Other Indo-European 1%
Political lean MEDSL · Marion
- 2024 margin
- Solid R (+31.6) · D 33.8% · R 65.5%
- 2008→2024 swing
- -20.0pp toward R · 2008: -11.6pp · 2024: -31.6pp
- All cycles
- 2024: R+31.6 2020: R+25.9 2016: R+26.2 2012: R+16.2 2008: R+11.6
Not yet ingested
- Civics
- —
Market trends
- HPI YoY
- ▲ 5.93%
- Current HPI
- 255.0714
- Rent YoY
- ▲ 0.17%
- Metro
- Ocala, FL
- State GDP YoY
- ▲ 3.28%
- F500 in state
- 36
Industry mix (Fortune 500 HQ in FL)
| Industry | F500 HQs | Revenue |
|---|---|---|
| Industrial Technology | 2 | $29B |
|
||
| Insurance | 2 | $17B |
|
||
| Retail | 1 | $60B |
|
||
| Technology Distribution | 1 | $58B |
|
||
| Homebuilding | 1 | $35B |
|
||
| Technology Manufacturing | 1 | $35B |
|
||
Price history
+39.5% since first listed2 events — show timeline
- 2026-06-12 Listed $214,900 Stellar MLS as Distributed by MLS Grid
- 2018-06-26 Sold (Public Records) $154,000 Public Records
Property tax history
+5.4%/yrLatest (2025): $2,165 · +12.9% YoY. Source: county tax records.
Cash-flow waterfall
monthlySold comps — $/sqft
last 12 mo · ≤1 miLoading sold comps…