200 Old Harrodsburg Rd #19 · Frankfort, KY
Flood risk 1/10 · Minimal
- FEMA flood zone
- X (unshaded)
- Chance of flooding over 30 yrs
- 0.0%
- Est. flood insurance / yr
- $507 – $1,088
Fire risk 3/10 · Minor
- Est. fire insurance / yr
- $839 – $1,559
Heat risk 4/10 · Minor
- Hot days now (above 103°F)
- 7 days/yr
- Hot days in 30 yrs
- 19 days/yr
Wind risk 2/10 · Minimal
- Chance of severe wind over 30 yrs
- 1.0%
Air-quality risk 2/10 · Minimal
- Unhealthy air days now
- 1 days/yr
- Unhealthy air days in 30 yrs
- 2 days/yr
Risk factors via First Street. Map © Google.
Why this score? — see what drove the B grade
The composite is a weighted blend of 9 inputs, each scored 0–100. Each bar is that input's sub-score; the figure is the points it added to the 100-point composite (weight × sub-score).
- Cash flow +30.0/30.0
- 1% rule +10.0/10.0
- DSCR +10.0/10.0
- ARV discount +7.5/15.0
- Rent growth +4.1/5.0
- Livability +3.7/5.0
- Schools +2.7/10.0
- Condition / age +2.5/5.0
- Appreciation +0.0/10.0
$90,000
🖨 Deal sheet (PDF) 📄 Offer letter ✓ Due diligence
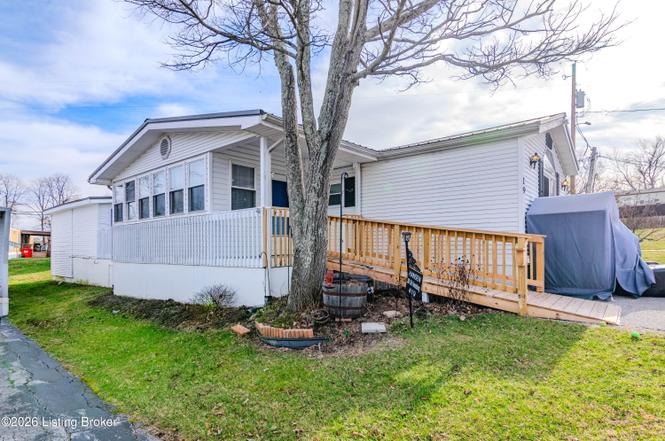
Listing remarks
Welcome to 200 Old Harrodsburg Rd, a beautifully maintained 3-bedroom, 2-bath home on a permanent foundation, ideally located just minutes from the heart of Frankfort. This property offers the perfect balance of convenience and comfort, with quick access to downtown Frankfort, major roadways, shopping, dining, and state offices—making daily commuting and errands effortless. Inside, the home is in wonderful condition and features attractive finishes throughout, a warm and inviting fireplace, and well-appointed kitchen finishes that make the space both functional and welcoming. The thoughtful layout includes spacious bedrooms and two full bathrooms, providing flexibility for a variety o
Key facts
- Permanent foundation
- Sunroom
- Added storage room
Tags
Neighborhood map
What this means for you Summary
Snapshot
- This is a 3-bed/2.0-bath single-family listed at $90k.
Deal economics
- At list price, monthly cash flow is $450 ($5k/yr) — positive.
- The deal already cash-flows at list — no discount required.
- Meets the 1% rule at list price ($1k rent vs $90k).
- Recommended offer: $85k (6.0% below list) — sets the bar for market timing.
- Cap rate 12.3% vs local median 3.3% in Frankfort — top-decile yield for the area; either an underpriced asset or a hidden risk that comps aren't pricing in. Stress-test before assuming the spread holds.
Location & tenants
- Location reads 74/100 on livability (#111 in KY, #4,772 nationally) — a middle-class / working-renter tenant base. Strengths: cost of living A+, housing A+, crime B; Watch: employment C-, amenities F, health & safety F.
- Franklin County (town): math 25% / reading 37% proficiency, ranked #89 of 165 in KY (top 54%) — families likely to look elsewhere, expect single-tenant / working-renter base with shorter leases.
- Zoned schools: Collins Lane (math 42% / reading 50%, grade D-, #137 of 676 statewide, top 21%, 507 students, 57% FRL); Bondurant Middle School (math 22% / reading 44%, grade F, #112 of 217 statewide, top 53%, 643 students, 54% FRL); Western Hills High School (math 32% / reading 37%, grade F, #76 of 254 statewide, top 34%, 817 students, 45% FRL) — zoned schools at 52% FRL track the district average.
- Market conditions: Rents rising fast (+6.5%/yr); 308 active listings in the ZIP; 1 comparable units currently listed for rent nearby; 123 units permitted in Franklin County in 2024 (0 in 5+ unit buildings).
Forward outlook
- Local home prices are declining (-3.0%/yr); year-one equity from $622 of loan paydown is wiped out by about $3k of value loss. Plan a longer hold.
- Franklin County population projected at +7% by 2050 — modest demand growth; plan on rents tracking national, not racing it.
- At projected returns (-3.0% appreciation + 6.5% rent growth), your $25k cash investment doubles in ~5 years — after that, you're playing with house money.
Negotiation context
- It's been on market 86 days — a 6% lower offer ($85k) is reasonable based on typical stale-listing flexibility.
- 3 sale attempts; this cycle's ask has dropped $60k (40%) from the opening price — seller is motivated, your offer sets the floor, not the list.
Questions for the listing agent
- It's been on market 86 days. Have you received any prior offers? Is the seller open to a 6% concession, seller financing, or rate buy-down credit?
- What does the HOA fee cover, when was the last increase, and are there any pending special assessments or reserve-fund shortfalls?
- Why hasn't it sold? Are there any deal-killer items the seller is aware of (foundation, flood, title, zoning, code violations)?
- Is there a deadline driving the sale (1031 exchange, divorce, estate, relocation)? That informs how much negotiation room exists.
- Schools are D-rated, which usually means shorter tenancies and higher turnover. Who's the typical renter profile here, and what's been the actual vacancy rate?
- What's the average days-on-market for RENTAL listings here right now (not sales)? A rising rental-DOM trend means longer vacancies and softer asking-rent achievability than the comps imply.
- What's the recent tenant-quality profile in this submarket — average credit score on applications, eviction rate, late-payment / NSF rate, and stable-employment percentage? A property-management company in the area should have these aggregated.
- How much new for-sale + rental construction is in the pipeline within 1–3 miles? Heavy new supply typically softens prices + rents 12–24 months out; constrained supply supports both.
Investment metrics
- 1% rule
- 1.55% ✓
- Cap rate
- 12.29%
- Cash-on-cash
- 21.41%
- DSCR
- 1.95
- GRM
- 5.4
CMA / ARV
- ARV (on-the-fly)
- $224,400
- Comps found
- 5
Show comp detail 5 sales within ~0.75 mi
| Address | Dist | Beds/Ba | Sqft | Sold | Price | $/sf | Match |
|---|---|---|---|---|---|---|---|
| 200 Old Harrodsburg Rd #19 | 0.00mi | 3/2.0 | 1,100 (0%) | 1mo | $90,000 | $82 | 99 |
| 409 Briar Patch Ln | 0.12mi | 3/2.0 | 1,121 (+2%) | 2mo | $250,000 | $223 | 90 |
| 108 Cedar Crest Ln | 0.24mi | 3/2.0 | 1,104 (+0%) | 9mo | $225,100 | $204 | 81 |
| 104 Cedar Crest Ln | 0.25mi | 3/2.0 | 1,206 (+10%) | 21mo | $200,000 | $166 | 55 |
| 104 Rabbit Ridge Ln | 0.27mi | 3/2.0 | 1,260 (+14%) | 12mo | $260,000 | $206 | 53 |
Match score weights: distance 35% · size 25% · config 20% · recency 20%. Top-matched comps best support the ARV.
Projected returns pro-forma
-3.0% appreciation · 6.55% rent growth · sell at horizon
- IRR
- 18.1%
- Equity multiple
- 1.76×
- Total profit
- $19,258
- Equity at exit
- $13,419
- IRR
- 28.9%
- Equity multiple
- 4.04×
- Total profit
- $76,616
- Equity at exit
- $7,782
Cash invested: $25,200 (down + closing). Projections, not guarantees.
Landlord ↔ Tenant lean methodology
- Overall (STATE)
- 83 Strongly Landlord-Friendly
- State Kentucky
- 83 Strongly Landlord-Friendly · R+16
- County
- — inherits STATE
- City
- — inherits STATE
ZIP-level market 40601
- Home prices YoY
- -26.1%
- Rents YoY
- 6.5%
- Active inventory
- 308
- Price-to-rent
- 5.4×
Monthly cashflow live
- Estimated rent
- $1,397 medium interval (Pro) →
- Mortgage (P&I)
- −$472
- Tax est. 1.5%
- −$112 /mo · $1,350/yr
- Insurance
- −$38
- HOA
- −$32
- Vacancy / Maint / Mgmt
- −$293
- Net cashflow
- $450
Break-even live
Sensitivity live
| Price | -10% $512 | -5% $481 | +0% $450 | +5% $418 | +10% $387 |
|---|---|---|---|---|---|
| Rent | -10% $339 | -5% $394 | +0% $450 | +5% $505 | +10% $560 |
| Rate | -1.0pp $495 | -0.5pp $472 | base $450 | +0.5pp $426 | +1.0pp $403 |
UW: 25.0% down · 7.5% · 30yr · 1.5% tax · 5.0% vac · 8.0% maint · 8.0% mgmt
Financing live
Cash to close
- Down payment
- $22,500
- Closing costs
- $2,700
- Reserves months
- —
- Total cash needed
- —
Loan-product check · same deal, 3 products live
Conventional
25% down · 7.5% · 30yr
- Down + closing
- —
- Monthly P&I
- —
- Monthly cashflow
- —
- DSCR
- —
- Eligible?
- —
Personal DTI + credit; lowest rate.
DSCR
20% down · 8.5% · 30yr
- Down + closing
- —
- Monthly P&I
- —
- Monthly cashflow
- —
- DSCR
- —
- Eligible?
- —
No personal income docs; deal must DSCR.
Hard money
10% down · 12.0% · 12mo
- Down + closing
- —
- Monthly P&I
- —
- Monthly cashflow
- —
- DSCR
- —
- Eligible?
- —
Short-term bridge; refi at stabilization.
Rent comps 1 comps
| Address | Beds | Baths | Sqft | Rent | $/sqft | DOM | Units | Dist |
|---|---|---|---|---|---|---|---|---|
| 80 Saint James Ct Unit 80 Frankfort, KY | 2.0 | 2.5 | 1100 | $1,525 | $1.39 | 46d | 1 | 0.25mi |
HOA detail
- Monthly dues
- $32 · $384/yr
Listing history 8 events
-
2026-04-17status Pending
-
2026-03-20status Active
-
2026-03-20price $90,000
-
2026-03-12historical Active Under Contract
-
2026-03-02status Active
-
2026-02-23historical
-
2026-01-31price $124,999
-
2026-01-14$150,000 Active
ⓘ Source: listings_history table (triggers on properties + properties_extension) + one-shot
backfill from property_details.listing_events for pre-trigger history.
Climate risk First Street
- Flood 1/10 Low FEMA zone X (unshaded) · 0% chance over 30 yrs
- Wildfire 3/10 Moderate
- Heat 4/10 Moderate 7 d/yr ≥103°F today · 19 d/yr by 30 yrs out
- Wind 2/10 Low 100% chance of damaging wind over 30 yrs
- Air quality 2/10 Low 1 unhealthy d/yr today · 2 by 30 yrs out
Nearby sold comps map
Loading sold comps map…
Walkable amenities ~0.75 mi
Loading nearby amenities…
Taxation est. · year 1
- Rental income
- $16,763
- − Mortgage interest
- −$5,041
- − Property taxes
- −$1,350
- − Insurance
- −$450
- − Repairs & maintenance
- −$1,341
- − Management
- −$1,341
- − HOA
- −$384
- − Depreciation
- −$2,618
- Taxable income
- $4,237
- Est. tax owed @ 24.0%
- −$1,017
- After-tax cash flow
- $4,378/yr
For passive investors: Depreciation is non-cash, so a rental often shows a tax loss while cash-flowing — sheltering income. Rental losses are passive: they offset passive income freely, and up to $25,000/yr can offset ordinary (W-2) income if you actively participate and your MAGI is under $100k (phasing out to $0 by $150k); unused losses carry forward. On sale, claimed depreciation is recaptured at up to 25%, and gains may owe capital-gains tax (a 1031 exchange can defer both). Figures are a year-1 estimate at your 24.0% rate — not tax advice; consult a CPA.
Schools (NCES district)
- District
- Franklin County
- NCES district ID
- 2102010
- Math proficiency
- 25% ▼ -15.00%
- Reading proficiency
- 37% ▼ -14.00%
- Median HH income
- $50,879
- Composite
- 27.07/100
- National rank
- #7049
- State rank
- #89 of 165 in KY
Livability — Frankfort
- Score
- 74/100
- State rank
- #111
- US rank
- #4772
Category grades
Schools grade is shown separately in the Schools card above.
Census & demographics
- County
- Franklin County · 51,893 people
- City population
- 51,893
- Metro
- Frankfort, KY
- Population (ZIP)
- 51,893
- Household income
- $65,732
- Rent vs Own
- Severe rent burden
- 1621.0
Population outlook (Franklin County) Hauer SSP2
- Today (2025)
- 52,996 people
- By 2030
- 54,049 · +2.0%
- By 2040
- 55,561 · +4.8%
- By 2050
- 56,677 · +6.9%
- By 2075
- 59,458 · +12.2%
- By 2100
- 58,885 · +11.1%
Race, ethnicity, and origin ACS 2023
- Neighborhood character
- Predominantly White (81%)
- Race & ethnicity
- White 81% Black 9% Two or more races 5% Hispanic / Latino 4% Asian 2%
- Common ancestry
- Italian 3% Slovak 2% Lithuanian 1%
- Foreign-born
- 4% · Canada
- Languages at home
- 94% English-only · Spanish 3% Other Asian/Pacific 1% Tagalog/Filipino 1%
Political lean MEDSL · Franklin
- 2024 margin
- Toss-up / Even · D 46.6% · R 51.4% · Other 2.0%
- 2008→2024 swing
- -4.2pp toward R · 2008: -0.6pp · 2024: -4.8pp
- All cycles
- 2024: R+4.8 2020: R+0.9 2016: R+4.6 2012: D+0.8 2008: R+0.6
Not yet ingested
- Civics
- —
Market trends
- HPI YoY
- ▼ -87.43%
- Current HPI
- 248.0324
- Rent YoY
- ▲ 6.55%
- Metro
- Frankfort, KY
- State GDP YoY
- ▲ 1.81%
- F500 in state
- 4
Industry mix (Fortune 500 HQ in KY)
| Industry | F500 HQs | Revenue |
|---|---|---|
| Healthcare | 1 | $118B |
|
||
| Food / Beverage | 1 | $7B |
|
||
Price history
-40.0% since first listed8 events — show timeline
- 2026-04-17 Pending — Metro Search MLS
- 2026-03-20 Relisted — Metro Search MLS
- 2026-03-20 Price Changed $90,000 Metro Search MLS
- 2026-03-12 Contingent — Metro Search MLS
- 2026-03-02 Relisted — Metro Search MLS
- 2026-02-23 Listing Removed — Metro Search MLS
- 2026-01-31 Price Changed $124,999 Metro Search MLS
- 2026-01-14 Listed $150,000 Metro Search MLS
Cash-flow waterfall
monthlySold comps — $/sqft
last 12 mo · ≤1 miLoading sold comps…