 5-Plex
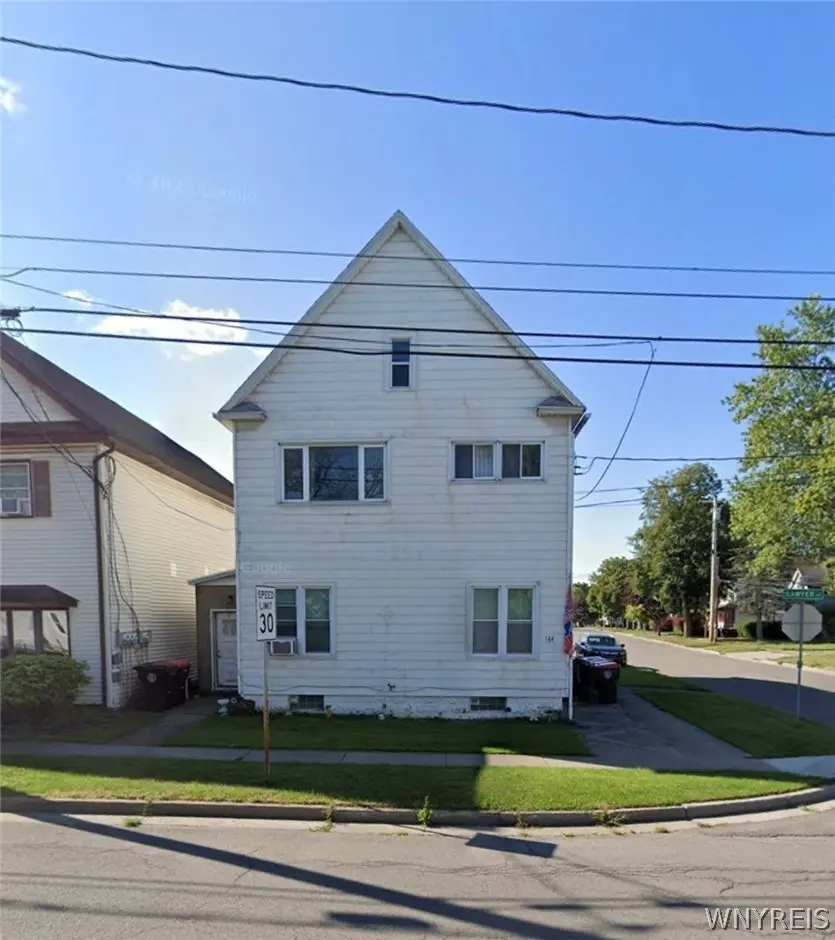
144 Sawyer Ave · Lancaster, NY
Flood risk 1/10 · Minimal
- FEMA flood zone
- X (unshaded)
- Chance of flooding over 30 yrs
- 0.0%
- Est. flood insurance / yr
- $473 – $860
Fire risk 3/10 · Minor
- Est. fire insurance / yr
- $691 – $1,283
Heat risk 3/10 · Minor
- Hot days now (above 92°F)
- 7 days/yr
- Hot days in 30 yrs
- 15 days/yr
Wind risk 1/10 · Minimal
- Chance of severe wind over 30 yrs
- —
Air-quality risk 3/10 · Minor
- Unhealthy air days now
- 2 days/yr
- Unhealthy air days in 30 yrs
- 3 days/yr
Risk factors via First Street. Map © Google.
Why this score? — see what drove the B grade
The composite is a weighted blend of 9 inputs, each scored 0–100. Each bar is that input's sub-score; the figure is the points it added to the 100-point composite (weight × sub-score).
- Cash flow +30.0/30.0
- 1% rule +10.0/10.0
- DSCR +10.0/10.0
- ARV discount +7.5/15.0
- Schools +5.2/10.0
- Rent growth +3.9/5.0
- Livability +3.9/5.0
- Condition / age +2.5/5.0
- Appreciation +0.0/10.0
$339,900
🖨 Deal sheet (PDF) 📄 Offer letter ✓ Due diligence
Multi-family units
County records classify this as Multi-Family (5+ Unit). Listing-text estimate: 5 units. confirmed
5+ unit building — per-unit beds/baths from public records are typically unavailable; the breakdown below (if shown) is an estimate from the listing text.
Listing remarks
Exceptional investment opportunity in Lancaster/Depew! This fully occupied 5-unit multifamily property is a turnkey addition to any investor's portfolio, generating approximately $4,200 per month in rental income with established tenants already in place. The property offers strong cash-flow potential with separate gas and electric utilities for tenants, minimizing landlord expenses. Water is the only utility paid by the owner. Well maintained and consistently occupied, this property presents an excellent opportunity for both seasoned investors and those looking to expand their real estate holdings. Conveniently located near shopping, dining, schools, parks, and major commuter routes, this
Key facts
- Multifamily property
- Well maintained
- 4,356 sq ft lot
Tags
Property features AI
Finance
- Other: Multi-unit building with 5 total units; Each unit has its own gas and electric meter (5 separate gas meters, 5 separate electric meters); Operating expenses: see remarks
- Financial info: Water is paid by owner; water is included in rent
Exterior
- Parking: Driveway parking for one vehicle
- Utilities: Public water connected; Sewer connected
- Home design: 2-story building; Resale property
- Construction: Aluminum siding; Asphalt shingle roof
- Exterior features: Concrete driveway; Corner, rectangular residential lot with 35 x 125 dimensions; City street frontage
Interior
- Kitchen: Gas cooktop; Refrigerator
- Flooring: Carpet; Laminate; Tile; Varies
- Heating & cooling: Electric baseboard heating
- Interior features: Full basement; Varied flooring including carpet, laminate and tile
- Laundry & utility: Washer hookup in a common area; Gas water heater
Neighborhood map
What this means for you Summary
Snapshot
- This is a 5 × 2-bed/1.5-bath units multifamily listed at $340k.
Deal economics
- At list price, monthly cash flow is $3k ($34k/yr) — positive. Per door: $574/mo.
- The deal already cash-flows at list — no discount required.
- Meets the 1% rule at list price ($7k rent vs $340k).
- Cap rate 16.4% vs local median 2.9% in Lancaster — top-decile yield for the area; either an underpriced asset or a hidden risk that comps aren't pricing in. Stress-test before assuming the spread holds.
Location & tenants
- Location reads 78/100 on livability (#164 in NY, #2,566 nationally) — a middle-class / working-renter tenant base. Strengths: crime A+, housing A+, health & safety A+; Watch: amenities F, commute F.
- Lancaster Central School District (suburban): math 57% / reading 61% proficiency, ranked #234 of 590 in NY (top 40%) — acceptable for families but not a draw, mixed tenant base, ~2y average lease; only 14% free/reduced lunch — higher-income household profile.
- Zoned schools: Lancaster High School (math 97% / reading 92%, grade A+, #117 of 1,100 statewide, top 11%, 1,652 students, 24% FRL).
- Zoned-school proficiency averages 94% at this address vs 59% district-wide (+36 pts) — the actual schools serving this property are materially stronger than the Lancaster Central School District average implies; a family-tenant draw the district grade alone would hide.
- Market conditions: Rents rising fast (+5.8%/yr); 126 active listings in the ZIP; 1,244 units permitted in Erie County in 2024 (563 in 5+ unit buildings).
- At $6,670/mo this rent would consume 108% of the median local household income ($74k/yr) (locally 854% of renters already pay >50% of income on rent) — very limited rent-growth headroom before tenants either downsize or default.
Forward outlook
- Local home prices are declining (-3.0%/yr); year-one equity from $2k of loan paydown is wiped out by about $10k of value loss. Plan a longer hold.
- At projected returns (-3.0% appreciation + 5.8% rent growth), your $95k cash investment doubles in ~4 years — after that, you're playing with house money.
Negotiation context
- Only 4 days on market — expect competitive offers; lowballing is unlikely to land.
Risks & watch-outs
- Watch-outs: built in 1920 — expect roof / HVAC / electrical / plumbing capex.
Questions for the listing agent
- Can we see the unit-by-unit rent roll, current vacancy, and any below-market leases? What's the average tenancy length?
- What capital expenditures (roof, boiler, parking lot, exteriors) have been made in the last 5 years, and what's planned in the next 2?
- Built in 1920 — when were the roof, HVAC, electrical panel, plumbing, and water heater last replaced?
- Is there a deadline driving the sale (1031 exchange, divorce, estate, relocation)? That informs how much negotiation room exists.
- Schools are A-rated — typically a magnet for longer-tenancy family renters. What's the average tenant stay here, and is there a school-zone premium baked into asking?
- What's the average days-on-market for RENTAL listings here right now (not sales)? A rising rental-DOM trend means longer vacancies and softer asking-rent achievability than the comps imply.
- What's the recent tenant-quality profile in this submarket — average credit score on applications, eviction rate, late-payment / NSF rate, and stable-employment percentage? A property-management company in the area should have these aggregated.
- How much new apartment / multifamily construction is in the pipeline within 1–3 miles? Heavy new supply (>2% of stock underway) typically softens rents 12–24 months out; light construction supports rent growth.
Investment metrics
- 1% rule
- 1.96% ✓
- Cap rate
- 16.43%
- Cash-on-cash
- 36.20%
- DSCR
- 2.61
- GRM
- 4.2
CMA / ARV
No comps found within radius.
Projected returns pro-forma
-3.0% appreciation · 5.75% rent growth · sell at horizon
- IRR
- 35.1%
- Equity multiple
- 2.54×
- Total profit
- $146,889
- Equity at exit
- $50,680
- IRR
- 43.3%
- Equity multiple
- 5.69×
- Total profit
- $446,249
- Equity at exit
- $29,388
Cash invested: $95,172 (down + closing). Projections, not guarantees.
Landlord ↔ Tenant lean methodology
- Overall (STATE)
- 15 Strongly Tenant-Friendly
- State New York
- 15 Strongly Tenant-Friendly · D+10
- County
- — inherits STATE
- City
- — inherits STATE
ZIP-level market 14043
- Home prices YoY
- -34.2%
- Rents YoY
- 5.8%
- Active inventory
- 126
- Price-to-rent
- 21.2×
Monthly cashflow live
- Estimated rent
- $6,670 high interval (Pro) →
- Mortgage (P&I)
- −$1,782
- Tax from tax record
- −$474 /mo · $5,687/yr
- Insurance
- −$142
- HOA
- −$0
- Lot rent
- −$0
- Vacancy / Maint / Mgmt
- −$1,401
- Net cashflow
- $2,871
Break-even live
Sensitivity live
| Price | -10% $3,064 | -5% $2,967 | +0% $2,871 | +5% $2,775 | +10% $2,679 |
|---|---|---|---|---|---|
| Rent | -10% $2,344 | -5% $2,608 | +0% $2,871 | +5% $3,135 | +10% $3,398 |
| Rate | -1.0pp $3,042 | -0.5pp $2,958 | base $2,871 | +0.5pp $2,783 | +1.0pp $2,694 |
5-unit breakdown (identical units grouped — click to expand)
| Units | Beds | Baths | Est. rent |
|---|---|---|---|
| 5× units | 2 | 1.5 | $6,670 |
| #1 | 2 | 1.5 | $1,334 |
| #2 | 2 | 1.5 | $1,334 |
| #3 | 2 | 1.5 | $1,334 |
| #4 | 2 | 1.5 | $1,334 |
| #5 | 2 | 1.5 | $1,334 |
| Total (5 units) | $6,670 | ||
UW: 25.0% down · 7.5% · 30yr · 1.5% tax · 5.0% vac · 8.0% maint · 8.0% mgmt
Financing live
Cash to close
- Down payment
- $84,975
- Closing costs
- $10,197
- Reserves months
- —
- Total cash needed
- —
Loan-product check · same deal, 3 products live
Conventional
25% down · 7.5% · 30yr
- Down + closing
- —
- Monthly P&I
- —
- Monthly cashflow
- —
- DSCR
- —
- Eligible?
- —
Personal DTI + credit; lowest rate.
DSCR
20% down · 8.5% · 30yr
- Down + closing
- —
- Monthly P&I
- —
- Monthly cashflow
- —
- DSCR
- —
- Eligible?
- —
No personal income docs; deal must DSCR.
Hard money
10% down · 12.0% · 12mo
- Down + closing
- —
- Monthly P&I
- —
- Monthly cashflow
- —
- DSCR
- —
- Eligible?
- —
Short-term bridge; refi at stabilization.
Listing history 4 events
-
2026-06-22days on market $339,900 Active 4 DOM
-
2026-06-21days on market $339,900 Active 3 DOM
-
2026-06-18remarks 699-char remark
-
2026-06-18$339,900 Active 1 DOM
ⓘ Source: listings_history table (triggers on properties + properties_extension) + one-shot
backfill from property_details.listing_events for pre-trigger history.
Tax reassessment forecast NY · Partial reset (capped growth)
- Current annual tax
- $5,687 · $474/mo
- Projected year-2 tax
- $5,716 · $476/mo
- Expected delta
- +$29/yr (+$2/mo · 0.5%)
ⓘ Screening estimate from a state-policy table — verify with the county assessor before closing.
Climate risk First Street
- Flood 1/10 Low FEMA zone X (unshaded) · 0% chance over 30 yrs
- Wildfire 3/10 Moderate
- Heat 3/10 Moderate 7 d/yr ≥92°F today · 15 d/yr by 30 yrs out
- Wind 1/10 Low
- Air quality 3/10 Moderate 2 unhealthy d/yr today · 3 by 30 yrs out
Nearby sold comps map
Loading sold comps map…
Walkable amenities ~0.75 mi
Loading nearby amenities…
Taxation est. · year 1
- Rental income
- $80,040
- − Mortgage interest
- −$19,040
- − Property taxes
- −$5,687
- − Insurance
- −$1,700
- − Repairs & maintenance
- −$6,403
- − Management
- −$6,403
- − Depreciation
- −$9,888
- Taxable income
- $30,919
- Est. tax owed @ 24.0%
- −$7,421
- After-tax cash flow
- $27,035/yr
For passive investors: Depreciation is non-cash, so a rental often shows a tax loss while cash-flowing — sheltering income. Rental losses are passive: they offset passive income freely, and up to $25,000/yr can offset ordinary (W-2) income if you actively participate and your MAGI is under $100k (phasing out to $0 by $150k); unused losses carry forward. On sale, claimed depreciation is recaptured at up to 25%, and gains may owe capital-gains tax (a 1031 exchange can defer both). Figures are a year-1 estimate at your 24.0% rate — not tax advice; consult a CPA.
Schools (NCES district)
- District
- Lancaster Central School District
- NCES district ID
- 3616680
- Math proficiency
- 57% ▼ -13.00%
- Reading proficiency
- 61% ▲ 2.00%
- Median HH income
- $64,668
- Composite
- 51.64/100
- National rank
- #1700
- State rank
- #234 of 590 in NY
Livability — Lancaster
- Score
- 78/100
- State rank
- #164
- US rank
- #2566
Category grades
Schools grade is shown separately in the Schools card above.
Census & demographics
- Census place
- Lancaster, NY
- County
- Erie County · 714,559 people
- City population
- 35,635
- Metro
- Buffalo-Cheektowaga, NY
- Population (ZIP)
- 25,098
- Household income
- $74,112
- Rent vs Own
- Severe rent burden
- 854.0
Population outlook (Erie County) Hauer SSP2
- Today (2025)
- 933,037 people
- By 2030
- 935,181 · +0.2%
- By 2040
- 928,531 · -0.5%
- By 2050
- 905,725 · -2.9%
- By 2075
- 834,037 · -10.6%
- By 2100
- 708,033 · -24.1%
Race, ethnicity, and origin ACS 2023
- Neighborhood character
- Predominantly White (91%)
- Race & ethnicity
- White 91% Hispanic / Latino 3% Two or more races 3% Black 2% Asian 1%
- Common ancestry
- Romanian 30% Lithuanian 2% Slovak 2%
- Foreign-born
- 4% · Canada, China
- Languages at home
- 91% English-only · Arabic 3% Russian/Polish/Slavic 2% Spanish 1%
Political lean MEDSL · Erie
- 2024 margin
- Lean D (+9.7) · D 54.8% · R 45.2%
- 2008→2024 swing
- -7.9pp toward R · 2008: 17.5pp · 2024: 9.7pp
- All cycles
- 2024: D+9.7 2020: D+14.7 2016: D+4.8 2012: D+15.6 2008: D+17.5
Not yet ingested
- Civics
- —
Market trends
- HPI YoY
- ▼ -152.13%
- Current HPI
- 292.1082
- Rent YoY
- ▲ 5.75%
- Metro
- Buffalo-Cheektowaga, NY
- State GDP YoY
- ▲ 2.60%
- F500 in state
- 92
Industry mix (Fortune 500 HQ in NY)
| Industry | F500 HQs | Revenue |
|---|---|---|
| Financial Services | 10 | $950B |
|
||
| Consumer Goods | 9 | $162B |
|
||
| Insurance | 4 | $225B |
|
||
| Telecommunications | 2 | $144B |
|
||
| Pharmaceuticals | 2 | $112B |
|
||
| Media / Entertainment | 2 | $69B |
|
||
Price history
1 event — show timeline
- 2026-06-18 Listed $339,900 WNYREIS
Property tax history
+1.5%/yrLatest (2025): $5,687 · +3.6% YoY. Source: county tax records.
Cash-flow waterfall
monthlySold comps — $/sqft
last 12 mo · ≤1 miLoading sold comps…