107 Potts Rd · Russellville, AL
Flood risk 1/10 · Minimal
- FEMA flood zone
- X (unshaded)
- Chance of flooding over 30 yrs
- 0.0%
- Est. flood insurance / yr
- $507 – $1,088
Fire risk 4/10 · Minor
- Est. fire insurance / yr
- $916 – $1,700
Heat risk 5/10 · Moderate
- Hot days now (above 105°F)
- 7 days/yr
- Hot days in 30 yrs
- 19 days/yr
Wind risk 5/10 · Moderate
- Chance of severe wind over 30 yrs
- 25.0%
Air-quality risk 2/10 · Minimal
- Unhealthy air days now
- 1 days/yr
- Unhealthy air days in 30 yrs
- 1 days/yr
Risk factors via First Street. Map © Google.
Why this score? — see what drove the B- grade
The composite is a weighted blend of 9 inputs, each scored 0–100. Each bar is that input's sub-score; the figure is the points it added to the 100-point composite (weight × sub-score).
- Cash flow +30.0/30.0
- 1% rule +10.0/10.0
- DSCR +10.0/10.0
- ARV discount +7.5/15.0
- Livability +3.6/5.0
- Schools +2.7/10.0
- Rent growth +2.5/5.0
- Condition / age +1.0/5.0
- Appreciation +0.6/10.0
$38,900
🖨 Deal sheet 📄 Offer letter ✓ Due diligence
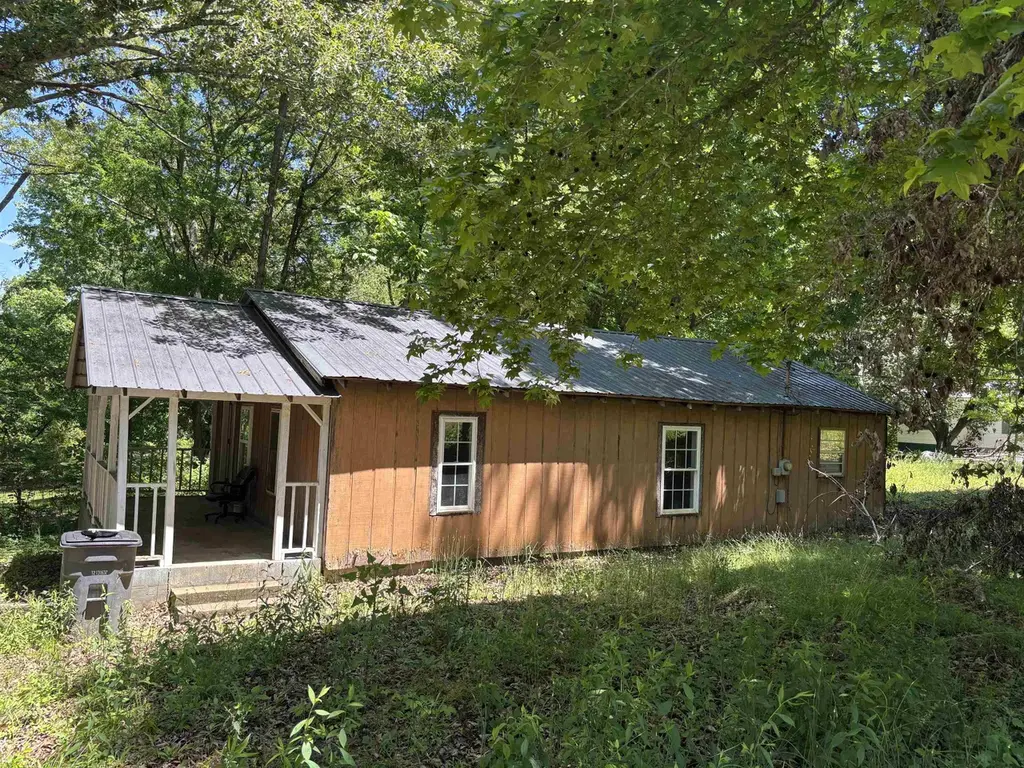
Listing remarks
Home on . 48 Ac lot located inside Russellville city limits and minutes away from Hwy 43, Russellville schools and the Russellville sports complex. Utilities are available. This property is being "Sold As Is". With a little imagination and TLC this property can become a rental or a private residence
Key facts
- 48 ac lot
- 0.48 acre lot
- Built 1995
Tags
Property features AI
Finance
- Other: Zoned R1; Lot approximately 0.48 acre with dimensions ~179.85 x 117.48 and 179.85 frontage
Exterior
- Utilities: Cable available; Electricity available; Natural gas available; Phone available; Public sewer available; Water available
- Home design: Single-family residence; Residential property; One-story (main living on main level)
- Construction: Metal roof; Block and pillar/post/pier foundation; Approximately 1970s–2000s era construction (year built not provided)
- Exterior features: No fencing; Gravel road access
Interior
- Bedrooms: Two main-level bedrooms
- Flooring: Laminate
- Bathrooms: One full bathroom on the main level
- Heating & cooling: Natural gas heating; No central cooling
- Interior features: Laminate flooring; Total of 6 rooms
Neighborhood map
What this means for you Summary
Snapshot
- This is a 2-bed/1.0-bath single-family listed at $39k. Condition is rated poor.
Deal economics
- At list price, monthly cash flow is $414 ($5k/yr) — positive.
- The deal already cash-flows at list — no discount required.
- Meets the 1% rule at list price ($865 rent vs $39k).
- Cap rate 19.1% vs local median 2.9% in Russellville — top-decile yield for the area; either an underpriced asset or a hidden risk that comps aren't pricing in. Stress-test before assuming the spread holds.
Location & tenants
- Location reads 71/100 on livability (#37 in AL) — a middle-class / working-renter tenant base. Strengths: cost of living A+, housing A+, health & safety A+; Watch: employment D, amenities F, commute F.
- Russellville City (town): math 24% / reading 41% proficiency, ranked #61 of 129 in AL (top 47%) — families likely to look elsewhere, expect single-tenant / working-renter base with shorter leases.
- Zoned schools: West Elementary School (719 students, 42% FRL); Russellville Middle School (math 17% / reading 43%, grade F, #121 of 257 statewide, top 50%, 579 students, 51% FRL); Russellville High School (math 27% / reading 32%, grade F, #70 of 305 statewide, top 27%, 740 students, 48% FRL).
- Market conditions: 43 active listings in the ZIP; 15 units permitted in Franklin County in 2024 (0 in 5+ unit buildings).
Forward outlook
- Local home prices are declining (-3.0%/yr); year-one equity from $269 of loan paydown is wiped out by about $1k of value loss. Plan a longer hold.
- At projected returns (-3.0% appreciation + 3.0% rent growth), your $11k cash investment doubles in ~3 years — after that, you're playing with house money.
Negotiation context
- Only 5 days on market — expect competitive offers; lowballing is unlikely to land.
Risks & watch-outs
- Climate carrying-cost: moderate wind risk, 25% chance of damaging wind over 30y; extreme-heat days projected 7→19/yr by 2055 (HVAC capex compounding) — expect insurance premiums to compound above CPI over the hold.
Questions for the listing agent
- Have any recent inspections been done? Can we get a copy of the seller's disclosures and any deferred-maintenance estimates?
- Is there a deadline driving the sale (1031 exchange, divorce, estate, relocation)? That informs how much negotiation room exists.
- Schools are F-rated, which usually means shorter tenancies and higher turnover. Who's the typical renter profile here, and what's been the actual vacancy rate?
- What's the average days-on-market for RENTAL listings here right now (not sales)? A rising rental-DOM trend means longer vacancies and softer asking-rent achievability than the comps imply.
- What's the recent tenant-quality profile in this submarket — average credit score on applications, eviction rate, late-payment / NSF rate, and stable-employment percentage? A property-management company in the area should have these aggregated.
- How much new for-sale + rental construction is in the pipeline within 1–3 miles? Heavy new supply typically softens prices + rents 12–24 months out; constrained supply supports both.
Investment metrics
- 1% rule
- 2.22% ✓
- Cap rate
- 19.07%
- Cash-on-cash
- 45.63%
- DSCR
- 3.03
- GRM
- 3.7
CMA / ARV
- ARV (median comp)
- $140,221
- List price
- $38,900
- Delta
- -72.26%
- Verdict
- UNDERPRICED
- Comps
- 17 within 1.0 mi
Show comp detail 3 sales within ~0.75 mi
| Address | Dist | Beds/Ba | Sqft | Sold | Price | $/sf | Match |
|---|---|---|---|---|---|---|---|
| 76 Una Loop | 0.44mi | 3/1.5 (+1) | 1,008 (+5%) | 1mo | $162,000 | $161 | 63 |
| 210 Cherry St | 0.48mi | 2/1.0 | 880 (-8%) | 5mo | $150,000 | $170 | 60 |
| 56 Pine St | 0.27mi | 3/1.0 (+1) | 1,050 (+9%) | 22mo | $135,000 | $129 | 48 |
Match score weights: distance 35% · size 25% · config 20% · recency 20%. Top-matched comps best support the ARV.
Projected returns pro-forma
-3.0% appreciation · 3.0% rent growth · sell at horizon
- IRR
- 42.8%
- Equity multiple
- 2.84×
- Total profit
- $20,086
- Equity at exit
- $5,800
- IRR
- 48.9%
- Equity multiple
- 5.73×
- Total profit
- $51,508
- Equity at exit
- $3,363
Cash invested: $10,892 (down + closing). Projections, not guarantees.
Landlord ↔ Tenant lean methodology
- Overall (STATE)
- 90 Strongly Landlord-Friendly
- State Alabama
- 90 Strongly Landlord-Friendly · R+15
- County
- — inherits STATE
- City
- — inherits STATE
ZIP-level market 35654
- Home prices YoY
- -4.6%
- Active inventory
- 43
- Price-to-rent
- 3.7×
Monthly cashflow live
- Estimated rent
- $865 medium interval (Pro) →
- Mortgage (P&I)
- −$204
- Tax est. 1.5%
- −$49 /mo · $584/yr
- Insurance
- −$16
- HOA
- −$0
- Vacancy / Maint / Mgmt
- −$182
- Net cashflow
- $414
Break-even live
UW: 25.0% down · 7.5% · 30yr · 1.5% tax · 5.0% vac · 8.0% maint · 8.0% mgmt
Financing live
Cash to close
- Down payment
- $9,725
- Closing costs
- $1,167
- Reserves months
- —
- Total cash needed
- —
Loan-product check · same deal, 3 products live
Conventional
25% down · 7.5% · 30yr
- Down + closing
- —
- Monthly P&I
- —
- Monthly cashflow
- —
- DSCR
- —
- Eligible?
- —
Personal DTI + credit; lowest rate.
DSCR
20% down · 8.5% · 30yr
- Down + closing
- —
- Monthly P&I
- —
- Monthly cashflow
- —
- DSCR
- —
- Eligible?
- —
No personal income docs; deal must DSCR.
Hard money
10% down · 12.0% · 12mo
- Down + closing
- —
- Monthly P&I
- —
- Monthly cashflow
- —
- DSCR
- —
- Eligible?
- —
Short-term bridge; refi at stabilization.
Listing history 1 events
-
2026-05-14$38,900 Active 310-char remark
ⓘ Source: listings_history table (triggers on properties + properties_extension) + one-shot
backfill from property_details.listing_events for pre-trigger history.
Climate risk First Street
- Flood 1/10 Low FEMA zone X (unshaded) · 0% chance over 30 yrs
- Wildfire 4/10 Moderate
- Heat 5/10 Major 7 d/yr ≥105°F today · 19 d/yr by 30 yrs out
- Wind 5/10 Major 25% chance of damaging wind over 30 yrs
- Air quality 2/10 Low 1 unhealthy d/yr today · 1 by 30 yrs out
Nearby sold comps map
Loading sold comps map…
Walkable amenities ~0.75 mi
Loading nearby amenities…
Taxation est. · year 1
- Rental income
- $10,374
- − Mortgage interest
- −$2,179
- − Property taxes
- −$584
- − Insurance
- −$194
- − Repairs & maintenance
- −$830
- − Management
- −$830
- − Depreciation
- −$1,132
- Taxable income
- $4,626
- Est. tax owed @ 24.0%
- −$1,110
- After-tax cash flow
- $3,860/yr
For passive investors: Depreciation is non-cash, so a rental often shows a tax loss while cash-flowing — sheltering income. Rental losses are passive: they offset passive income freely, and up to $25,000/yr can offset ordinary (W-2) income if you actively participate and your MAGI is under $100k (phasing out to $0 by $150k); unused losses carry forward. On sale, claimed depreciation is recaptured at up to 25%, and gains may owe capital-gains tax (a 1031 exchange can defer both). Figures are a year-1 estimate at your 24.0% rate — not tax advice; consult a CPA.
Condition & rehab AI · 2 photos
This property requires extensive repairs and maintenance, including a new roof, siding, HVAC systems, and landscaping. Significant investment is needed to bring it up to a livable condition.
Repairs flagged
- Major roof — Significant damage and discoloration suggest a major repair is needed.
- Major siding — Peeling and chipping paint indicate a major repair is needed.
- Major HVAC/mechanicals — The exterior condition suggests these systems may be in poor condition and need replacement.
- Major landscaping — The overgrown and unkempt landscaping detracts from the property's value and needs immediate attention.
Value-add opportunities
- Both repair and replace roof — A new roof will improve the property's appearance and functionality.
- Both repair and replace siding — New siding will improve the property's appearance and increase its value.
- Both repair and replace HVAC/mechanicals — Upgrading HVAC systems will improve comfort and energy efficiency.
- Both landscaping and curb appeal — A well-maintained landscape will enhance the property's curb appeal and value.
Renovation cost estimate screening
| Repair item | Severity | Est. cost |
|---|---|---|
| roof · Significant damage and discoloration suggest a major repair is needed. | Major | $15,000–50,000 |
| siding · Peeling and chipping paint indicate a major repair is needed. | Major | $15,000–50,000 |
| HVAC/mechanicals · The exterior condition suggests these systems may be in poor condition and need replacement. | Major | $15,000–50,000 |
| landscaping · The overgrown and unkempt landscaping detracts from the property's value and needs immediate attention. | Major | $15,000–50,000 |
| Total estimated repair cost · 4 items | $60,000–200,000 |
Value-add ROI direction
- Both repair and replace roof — A new roof will improve the property's appearance and functionality. ↑
- Both repair and replace siding — New siding will improve the property's appearance and increase its value. ↑
- Both repair and replace HVAC/mechanicals — Upgrading HVAC systems will improve comfort and energy efficiency. ↑
- Both landscaping and curb appeal — A well-maintained landscape will enhance the property's curb appeal and value. ↑
ⓘ Cost ranges are severity-bucket heuristics (US national rule-of-thumb). Get contractor quotes + a written scope before underwriting a rehab budget.
Schools (NCES district)
- District
- Russellville City
- NCES district ID
- 0102910
- Math proficiency
- 24% ▼ -21.00%
- Reading proficiency
- 41% ▲ 4.00%
- Median HH income
- $33,970
- Composite
- 26.68/100
- National rank
- #7158
- State rank
- #61 of 129 in AL
Livability — Russellville
- Score
- 71/100
- State rank
- #37
- US rank
- #6823
Category grades
Schools grade is shown separately in the Schools card above.
Census & demographics
- Census place
- Russellville, AL
- Population (ZIP)
- 8,396
Population outlook (Franklin County) Hauer SSP2
- Today (2025)
- 31,545 people
- By 2030
- 31,335 · -0.7%
- By 2040
- 30,983 · -1.8%
- By 2050
- 30,744 · -2.5%
- By 2075
- 30,173 · -4.3%
- By 2100
- 29,478 · -6.6%
Race, ethnicity, and origin ACS 2023
- Neighborhood character
- Predominantly White (76%)
- Race & ethnicity
- White 76% Hispanic / Latino 18% Two or more races 8% Black 4% Native American 1%
- Hispanic origin (detail)
- Mexican 11%
- Common ancestry
- Serbian 1% Italian 1% Lithuanian 1%
- Foreign-born
- 9% · Canada
- Languages at home
- 85% English-only · Spanish 15%
Political lean MEDSL · Franklin
- 2024 margin
- Solid R (+73.3) · D 13.0% · R 86.2%
- 2008→2024 swing
- -34.1pp toward R · 2008: -39.2pp · 2024: -73.3pp
- All cycles
- 2024: R+73.3 2020: R+65.9 2016: R+60.8 2012: R+40.5 2008: R+39.2
Not yet ingested
- Civics
- —
Market trends
- HPI YoY
- ▼ -8.75%
- Current HPI
- 181.7
- Rent YoY
- —
- Metro
- —
- State GDP YoY
- ▲ 2.94%
- F500 in state
- 4
Industry mix (Fortune 500 HQ in AL)
| Industry | F500 HQs | Revenue |
|---|---|---|
| Financial Services | 1 | $8B |
|
||
| Healthcare | 1 | $5B |
|
||
Price history
2 events — show timeline
- 2026-05-20 Pending — SAARMLS
- 2026-05-14 Listed $38,900 SAARMLS
Cash-flow waterfall
monthlySold comps — $/sqft
last 12 mo · ≤1 miLoading sold comps…