850 Bank St · Painesville, OH
Flood risk 1/10 · Minimal
- FEMA flood zone
- X (unshaded)
- Chance of flooding over 30 yrs
- 0.0%
- Est. flood insurance / yr
- $507 – $1,088
Fire risk 1/10 · Minimal
- Est. fire insurance / yr
- $713 – $1,323
Heat risk 2/10 · Minimal
- Hot days now (above 96°F)
- 7 days/yr
- Hot days in 30 yrs
- 17 days/yr
Wind risk 1/10 · Minimal
- Chance of severe wind over 30 yrs
- —
Air-quality risk 4/10 · Minor
- Unhealthy air days now
- 4 days/yr
- Unhealthy air days in 30 yrs
- 8 days/yr
Risk factors via First Street. Map © Google.
Why this score? — see what drove the C+ grade
The composite is a weighted blend of 9 inputs, each scored 0–100. Each bar is that input's sub-score; the figure is the points it added to the 100-point composite (weight × sub-score).
- Cash flow +21.3/30.0
- ARV discount +15.0/15.0
- DSCR +6.8/10.0
- 1% rule +6.0/10.0
- Livability +3.6/5.0
- Rent growth +3.4/5.0
- Schools +2.6/10.0
- Condition / age +2.5/5.0
- Appreciation +0.0/10.0
$109,000
🖨 Deal sheet 📄 Offer letter ✓ Due diligence
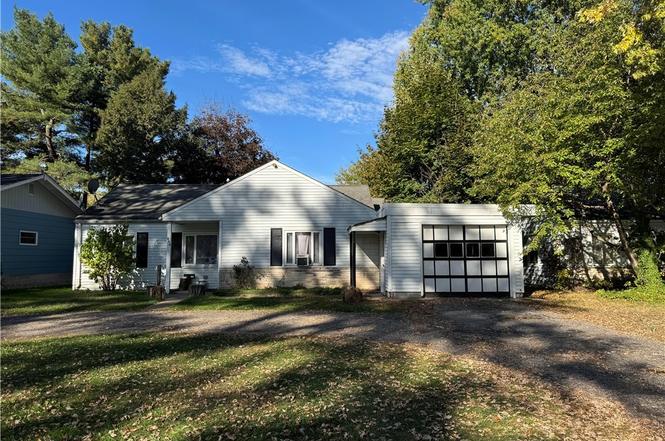
Listing remarks
3 Bedroom, 1 full bath, features include spacious living room, formal dining room, family room, back yard is fully fenced, horseshoe drive, 1 car attached. Baseboard heat in family room. Property needs work, BEING SOLD AS IS, Inspections for buyers information, Seller will make no repairs. Showings on Saturdays & Sundays 2:00 pm - 4:30 pm only beginning 03-28-26. Bank Appraisal is complete short sale is in final stage. Special conditions apply to this property contact Listing Agent.
Key facts
- Formal dining room
- Horseshoe drive
- Family room
Tags
Property features AI
Exterior
- Parking: Attached garage with 1 garage space
- Utilities: Public water; Public sewer
- Home design: Single-story home; Above-grade living area approximately 1,236 finished (per Realist)
- Construction: Vinyl siding; Asphalt/fiberglass roof; Slab foundation; Built per public records
- Exterior features: Back yard with fencing; Fenced yard
Interior
- Kitchen: Kitchen on the main level
- Bedrooms: Three main-level bedrooms
- Bathrooms: One full bathroom on the main level
- Heating & cooling: Gas baseboard heating
- Interior features: 7 total rooms; Fixer condition
Neighborhood map
What this means for you Summary
Snapshot
- This is a 2-bed/1.0-bath single-family listed at $109k.
Deal economics
- At list price, monthly cash flow is $159 ($2k/yr) — positive.
- The deal already cash-flows at list — no discount required.
- Meets the 1% rule at list price ($1k rent vs $109k).
- Recommended offer: $106k (3.0% below list) — sets the bar for market timing.
- Cap rate 8.0% vs local median 2.9% in Painesville — top-decile yield for the area; either an underpriced asset or a hidden risk that comps aren't pricing in. Stress-test before assuming the spread holds.
Location & tenants
- Location reads 72/100 on livability (#360 in OH) — a middle-class / working-renter tenant base. Strengths: cost of living A+, housing A+, health & safety A+; Watch: employment D+, amenities F, commute F.
- Painesville City Local (suburban): math 28% / reading 35% proficiency, ranked #577 of 656 in OH (top 88%) — families likely to look elsewhere, expect single-tenant / working-renter base with shorter leases; 76% free/reduced lunch — lower-income household profile, screen leases tightly.
- Market conditions: Rents rising (+3.7%/yr); 267 active listings in the ZIP; 8 comparable units currently listed for rent nearby; rentals lingering (median 44d on market — plan ~5-8 weeks vacancy on turnover, expect pricing pressure); 50% of comp listings sitting > 30 days — soft ceiling on asking rent; solid renter incomes; 448 units permitted in Lake County in 2024 (0 in 5+ unit buildings).
- This rent is only 17% of the median local income ($85k/yr) — well below the 30% rent-burden line; pricing power to push rent on renewal without tenant pushback.
Forward outlook
- Local home prices are declining (-3.0%/yr); year-one equity from $754 of loan paydown is wiped out by about $3k of value loss. Plan a longer hold.
- Lake County population projected to shrink 8% by 2050 — rents likely to lag national; underwrite the cash flow, not the appreciation.
Negotiation context
- It's been on market 36 days — a 3% lower offer ($106k) is reasonable based on typical stale-listing flexibility.
- 10 sale attempts since 24y ago; this cycle's ask is 68% above the opening price — seller raised mid-cycle; expect resistance to lowballs.
- Current owner paid $80k; 36% above their basis — modest negotiation headroom, anchor on the comps not their cost.
Risks & watch-outs
- Watch-outs: built in 1952 — expect roof / HVAC / electrical / plumbing capex.
Questions for the listing agent
- It's been on market 36 days. Have you received any prior offers? Is the seller open to a 3% concession, seller financing, or rate buy-down credit?
- Built in 1952 — when were the roof, HVAC, electrical panel, plumbing, and water heater last replaced?
- Is there a deadline driving the sale (1031 exchange, divorce, estate, relocation)? That informs how much negotiation room exists.
- What's the average days-on-market for RENTAL listings here right now (not sales)? A rising rental-DOM trend means longer vacancies and softer asking-rent achievability than the comps imply.
- What's the recent tenant-quality profile in this submarket — average credit score on applications, eviction rate, late-payment / NSF rate, and stable-employment percentage? A property-management company in the area should have these aggregated.
- How much new for-sale + rental construction is in the pipeline within 1–3 miles? Heavy new supply typically softens prices + rents 12–24 months out; constrained supply supports both.
Investment metrics
- 1% rule
- 1.10% ✓
- Cap rate
- 8.04%
- Cash-on-cash
- 6.25%
- DSCR
- 1.28
- GRM
- 7.6
CMA / ARV
- ARV (on-the-fly)
- $148,320
- Comps found
- 8
Show comp detail 8 sales within ~0.75 mi
| Address | Dist | Beds/Ba | Sqft | Sold | Price | $/sf | Match |
|---|---|---|---|---|---|---|---|
| 524 S State St | 0.40mi | 2/1.5 | 1,240 (+0%) | 1mo | $116,000 | $94 | 78 |
| 210 Charlotte St | 0.12mi | 2/1.5 | 1,140 (-8%) | 6mo | $151,500 | $133 | 75 |
| 219 Meriden Rd | 0.19mi | 3/1.5 (+1) | 1,209 (-2%) | 9mo | $225,000 | $186 | 73 |
| 639 Liberty St | 0.37mi | 3/1.0 (+1) | 1,342 (+9%) | 0mo | $153,000 | $114 | 63 |
| 314 E Walnut Ave | 0.52mi | 3/1.5 (+1) | 1,320 (+7%) | 13mo | $210,000 | $159 | 47 |
| 48 Lusard St | 0.63mi | 3/1.0 (+1) | 1,352 (+9%) | 8mo | $147,000 | $109 | 43 |
| 457 Liberty St | 0.53mi | 3/1.5 (+1) | 1,377 (+11%) | 10mo | $165,000 | $120 | 41 |
| 128 Pearl St | 0.69mi | 3/1.0 (+1) | 1,152 (-7%) | 23mo | $135,000 | $117 | 32 |
Match score weights: distance 35% · size 25% · config 20% · recency 20%. Top-matched comps best support the ARV.
Projected returns pro-forma
-3.0% appreciation · 3.68% rent growth · sell at horizon
- IRR
- -5.8%
- Equity multiple
- 0.78×
- Total profit
- $-6,677
- Equity at exit
- $16,252
- IRR
- 4.7%
- Equity multiple
- 1.35×
- Total profit
- $10,819
- Equity at exit
- $9,424
Cash invested: $30,520 (down + closing). Projections, not guarantees.
Landlord ↔ Tenant lean methodology
- Overall (STATE)
- 73 Landlord-Friendly
- State Ohio
- 73 Landlord-Friendly · R+6
- County
- — inherits STATE
- City
- — inherits STATE
ZIP-level market 44077
- Rents YoY
- 3.7%
- Active inventory
- 267
- Price-to-rent
- 7.6×
Monthly cashflow live
- Estimated rent
- $1,200 high interval (Pro) →
- Mortgage (P&I)
- −$572
- Tax from tax record
- −$172 /mo · $2,066/yr
- Insurance
- −$45
- HOA
- −$0
- Vacancy / Maint / Mgmt
- −$252
- Net cashflow
- $159
Break-even live
UW: 25.0% down · 7.5% · 30yr · 1.5% tax · 5.0% vac · 8.0% maint · 8.0% mgmt
Financing live
Cash to close
- Down payment
- $27,250
- Closing costs
- $3,270
- Reserves months
- —
- Total cash needed
- —
Loan-product check · same deal, 3 products live
Conventional
25% down · 7.5% · 30yr
- Down + closing
- —
- Monthly P&I
- —
- Monthly cashflow
- —
- DSCR
- —
- Eligible?
- —
Personal DTI + credit; lowest rate.
DSCR
20% down · 8.5% · 30yr
- Down + closing
- —
- Monthly P&I
- —
- Monthly cashflow
- —
- DSCR
- —
- Eligible?
- —
No personal income docs; deal must DSCR.
Hard money
10% down · 12.0% · 12mo
- Down + closing
- —
- Monthly P&I
- —
- Monthly cashflow
- —
- DSCR
- —
- Eligible?
- —
Short-term bridge; refi at stabilization.
Rent comps 8 comps
| Address | Beds | Baths | Sqft | Rent | $/sqft | DOM | Units | Dist |
|---|---|---|---|---|---|---|---|---|
| 52 Kensington Ave Unit 52K 3 Painesville, OH | 2.0 | 1.0 | 850 | $920 | $1.08 | 44d | 1 | 0.45mi |
| 48 Pearl St Painesville, OH | 2.0 | 1.0 | 950 | $1,250 | $1.32 | 44d | 1 | 0.66mi |
| 48 Pearl St Unit B48-2 Painesville, OH | 1.0 | 1.0 | 700 | $1,015 | $1.45 | 44d | 1 | 0.67mi |
| 551 W Jackson St Unit RFV A201 Painesville, OH | 2.0 | 1.0 | 860 | $1,045 | $1.22 | 44d | 1 | 1.31mi |
| 763 Mentor Ave Painesville, OH | 3.0 | 1.5 | 1472 | $1,800 | $1.22 | 3d | 1 | 1.34mi |
| 244 E Prospect St Painesville, OH | 2.0 | 1.0 | 1000 | $1,195 | $1.20 | 2d | 1 | 1.37mi |
| 762 Mentor Ave Unit 31 Painesville, OH | 3.0 | 1.5 | 1160 | $1,400 | $1.21 | 2d | 1 | 1.38mi |
| 189 E Prospect St Painesville, OH | 3.0 | 2.0 | 1240 | $1,600 | $1.29 | 24d | 1 | 1.44mi |
Listing history 25 events
-
2026-04-20status Pending
-
2026-03-23status Active
-
2026-03-23price $109,000
-
2025-10-25status Pending
-
2025-10-16$64,900 Active
-
2025-10-14historical
-
2025-09-02$126,000 Active
-
2025-08-18historical
-
2025-08-15status Active
-
2025-06-06historical Contingent
-
2025-05-27$120,000 Active
-
2023-06-19status Pending
-
2023-06-19historical
-
2023-06-16price $99,900
-
2023-06-08$119,500 Active
-
2008-08-07soldstatus $79,900
-
2008-07-25soldstatus $79,900
-
2008-04-11$79,900
-
2002-12-31historical
-
2002-12-31historical
-
2002-10-07soldstatus $112,500
-
2002-10-04soldstatus $112,500
-
2002-07-16$117,000
-
2002-06-20$119,900
-
2002-06-06$120,000
ⓘ Source: listings_history table (triggers on properties + properties_extension) + one-shot
backfill from property_details.listing_events for pre-trigger history.
Tax reassessment forecast OH · Partial reset (capped growth)
- Current annual tax
- $2,066 · $172/mo
- Projected year-2 tax
- $2,066 · $172/mo
- Expected delta
- $0/yr ($0/mo · 0.0%)
ⓘ Screening estimate from a state-policy table — verify with the county assessor before closing.
Climate risk First Street
- Flood 1/10 Low FEMA zone X (unshaded) · 0% chance over 30 yrs
- Wildfire 1/10 Low
- Heat 2/10 Low 7 d/yr ≥96°F today · 17 d/yr by 30 yrs out
- Wind 1/10 Low
- Air quality 4/10 Moderate 4 unhealthy d/yr today · 8 by 30 yrs out
Nearby sold comps map
Loading sold comps map…
Walkable amenities ~0.75 mi
Loading nearby amenities…
Taxation est. · year 1
- Rental income
- $14,401
- − Mortgage interest
- −$6,106
- − Property taxes
- −$2,066
- − Insurance
- −$545
- − Repairs & maintenance
- −$1,152
- − Management
- −$1,152
- − Depreciation
- −$3,171
- Taxable income
- $209
- Est. tax owed @ 24.0%
- −$50
- After-tax cash flow
- $1,856/yr
For passive investors: Depreciation is non-cash, so a rental often shows a tax loss while cash-flowing — sheltering income. Rental losses are passive: they offset passive income freely, and up to $25,000/yr can offset ordinary (W-2) income if you actively participate and your MAGI is under $100k (phasing out to $0 by $150k); unused losses carry forward. On sale, claimed depreciation is recaptured at up to 25%, and gains may owe capital-gains tax (a 1031 exchange can defer both). Figures are a year-1 estimate at your 24.0% rate — not tax advice; consult a CPA.
Schools (NCES district)
- District
- Painesville City Local
- NCES district ID
- 3910015
- Math proficiency
- 28% ▼ -8.00%
- Reading proficiency
- 35% ▼ -6.00%
- Median HH income
- $35,381
- Composite
- 26.03/100
- National rank
- #7309
- State rank
- #577 of 656 in OH
Livability — Painesville
- Score
- 72/100
- State rank
- #360
- US rank
- #5785
Category grades
Schools grade is shown separately in the Schools card above.
Census & demographics
- Census place
- Painesville, OH
- County
- Lake County · 204,927 people
- City population
- 57,325
- Metro
- Cleveland-Elyria, OH
- Population (ZIP)
- 57,325
- Household income
- $85,056
- Rent vs Own
- Severe rent burden
- 1333.0
Population outlook (Lake County) Hauer SSP2
- Today (2025)
- 230,022 people
- By 2030
- 228,151 · -0.8%
- By 2040
- 221,018 · -3.9%
- By 2050
- 212,754 · -7.5%
- By 2075
- 200,309 · -12.9%
- By 2100
- 183,315 · -20.3%
Race, ethnicity, and origin ACS 2023
- Neighborhood character
- Predominantly White (78%)
- Race & ethnicity
- White 78% Hispanic / Latino 12% Two or more races 7% Black 5% Asian 1%
- Hispanic origin (detail)
- Mexican 7% Puerto Rican 3%
- Common ancestry
- Romanian 6% Lithuanian 2% Slovak 2%
- Foreign-born
- 6% · Canada, China
- Languages at home
- 88% English-only · Spanish 9% Russian/Polish/Slavic 1% Other Indo-European 1%
Political lean MEDSL · Lake
- 2024 margin
- R (+14.3) · D 42.4% · R 56.7%
- 2008→2024 swing
- -15.2pp toward R · 2008: 0.8pp · 2024: -14.3pp
- All cycles
- 2024: R+14.3 2020: R+13.6 2016: R+15.6 2012: R+1.7 2008: D+0.8
Not yet ingested
- Civics
- —
Market trends
- HPI YoY
- ▼ -183.05%
- Current HPI
- 181.2976
- Rent YoY
- ▲ 3.68%
- Metro
- Cleveland-Elyria, OH
- State GDP YoY
- ▲ 1.98%
- F500 in state
- 48
Industry mix (Fortune 500 HQ in OH)
| Industry | F500 HQs | Revenue |
|---|---|---|
| Insurance | 3 | $145B |
|
||
| Industrial Machinery | 3 | $49B |
|
||
| Financial Services | 3 | $24B |
|
||
| Consumer Goods | 2 | $93B |
|
||
| Aerospace / Defense | 2 | $47B |
|
||
| Utilities | 2 | $33B |
|
||
Price history
-9.2% since first listed25 events — show timeline
- 2026-04-20 Pending — MLSNOW
- 2026-03-23 Relisted — MLSNOW
- 2026-03-23 Price Changed $109,000 MLSNOW
- 2025-10-25 Pending — MLSNOW
- 2025-10-16 Listed $64,900 MLSNOW
- 2025-10-14 Listing Removed — MLSNOW
- 2025-09-02 Listed $126,000 MLSNOW
- 2025-08-18 Listing Removed — MLSNOW
- 2025-08-15 Relisted — MLSNOW
- 2025-06-06 Contingent — MLSNOW
- 2025-05-27 Listed $120,000 MLSNOW
- 2023-06-19 Pending — MLSNOW
- 2023-06-19 Listing Removed — MLSNOW
- 2023-06-16 Price Changed $99,900 MLSNOW
- 2023-06-08 Listed $119,500 MLSNOW
- 2008-08-07 Sold (MLS) $79,900 MLSNOW
- 2008-07-25 Sold (Public Records) $79,900 Public Records
- 2008-04-11 Listed $79,900 MLSNOW
- 2002-12-31 Listing Removed — MLSNOW
- 2002-12-31 Listing Removed — MLSNOW
- 2002-10-07 Sold (MLS) $112,500 MLSNOW
- 2002-10-04 Sold (Public Records) $112,500 Public Records
- 2002-07-16 Listed $117,000 MLSNOW
- 2002-06-20 Listed $119,900 MLSNOW
- 2002-06-06 Listed $120,000 MLSNOW
Property tax history
+1.9%/yrLatest (2025): $2,066 · -2.0% YoY. Source: county tax records.
Cash-flow waterfall
monthlySold comps — $/sqft
last 12 mo · ≤1 miLoading sold comps…