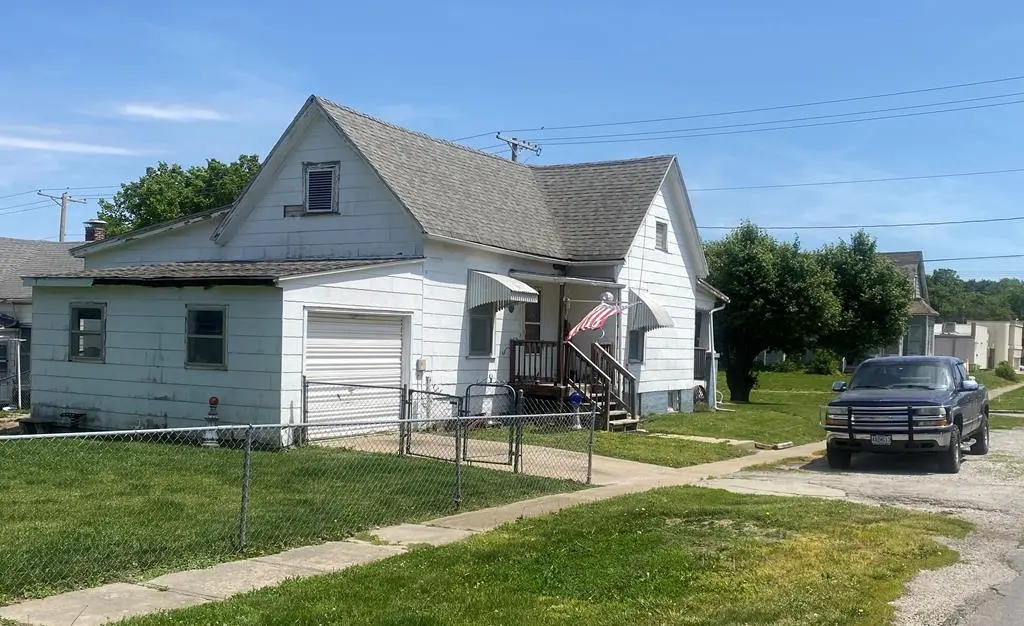
1202 Walnut St · Chillicothe, MO
Flood risk 1/10 · Minimal
- FEMA flood zone
- X (unshaded)
- Chance of flooding over 30 yrs
- 0.0%
- Est. flood insurance / yr
- $507 – $1,088
Fire risk 1/10 · Minimal
- Est. fire insurance / yr
- $1,054 – $1,958
Heat risk 4/10 · Minor
- Hot days now (above 107°F)
- 7 days/yr
- Hot days in 30 yrs
- 15 days/yr
Wind risk 2/10 · Minimal
- Chance of severe wind over 30 yrs
- —
Air-quality risk 2/10 · Minimal
- Unhealthy air days now
- 0 days/yr
- Unhealthy air days in 30 yrs
- 1 days/yr
Risk factors via First Street. Map © Google.
Why this score? — see what drove the B- grade
The composite is a weighted blend of 9 inputs, each scored 0–100. Each bar is that input's sub-score; the figure is the points it added to the 100-point composite (weight × sub-score).
- Cash flow +30.0/30.0
- 1% rule +10.0/10.0
- DSCR +10.0/10.0
- ARV discount +7.5/15.0
- Schools +4.1/10.0
- Livability +3.4/5.0
- Rent growth +2.5/5.0
- Condition / age +2.5/5.0
- Appreciation +0.0/10.0
$53,900
🖨 Deal sheet (PDF) 📄 Offer letter ✓ Due diligence
Listing remarks
Welcome to 1202 Walnut Street located in Chillicothe, MO. Here you will be welcomed by a 1,250 square feet 1920's home featuring 2 bedrooms, 1 bathroom and a full unfinished basement. This sweet bungalow style home will not last long, call today for a private showing.
Key facts
- 6,832 sq ft lot
- Garage
- Built 1920
Property features AI
Exterior
- Parking: 1-car garage
- Utilities: Public water; Public sewer; Natural gas available
- Home design: Residential single-family home
- Exterior features: Chain link fencing; Composition roof
Interior
- Flooring: Hardwood floors
- Bathrooms: 1 full bathroom
- Heating & cooling: Central air conditioning
- Interior features: Gas water heater; Full basement
Neighborhood map
What this means for you Summary
Snapshot
- This is a 2-bed/1.0-bath single-family listed at $54k.
Deal economics
- At list price, monthly cash flow is $489 ($6k/yr) — positive.
- The deal already cash-flows at list — no discount required.
- Meets the 1% rule at list price ($1k rent vs $54k).
- Cap rate 17.2% vs local median 4.8% in Chillicothe — top-decile yield for the area; either an underpriced asset or a hidden risk that comps aren't pricing in. Stress-test before assuming the spread holds.
Location & tenants
- Location reads 67/100 on livability (#225 in MO) — a middle-class / working-renter tenant base. Strengths: cost of living A+, housing A; Watch: employment D+, amenities F, commute F.
- Chillicothe R-II (town): math 49% / reading 48% proficiency, ranked #60 of 324 in MO (top 18%) — families likely to look elsewhere, expect single-tenant / working-renter base with shorter leases.
- Zoned schools: Chillicothe Elem (327 students, 52% FRL); Chillicothe Middle (math 31% / reading 35%, grade F, #265 of 391 statewide, top 69%, 371 students, 48% FRL); Chillicothe High (math 62% / reading 62%, grade B-, #28 of 521 statewide, top 6%, 609 students, 37% FRL) — zoned schools at 46% FRL track the district average.
- Market conditions: 71 active listings in the ZIP; 47 units permitted in Livingston County in 2024 (0 in 5+ unit buildings).
Forward outlook
- Local home prices are declining (-3.0%/yr); year-one equity from $373 of loan paydown is wiped out by about $2k of value loss. Plan a longer hold.
- At projected returns (-3.0% appreciation + 3.0% rent growth), your $15k cash investment doubles in ~4 years — after that, you're playing with house money.
Negotiation context
- Only 12 days on market — expect competitive offers; lowballing is unlikely to land.
Risks & watch-outs
- Watch-outs: built in 1920 — expect roof / HVAC / electrical / plumbing capex.
Questions for the listing agent
- Built in 1920 — when were the roof, HVAC, electrical panel, plumbing, and water heater last replaced?
- Is there a deadline driving the sale (1031 exchange, divorce, estate, relocation)? That informs how much negotiation room exists.
- What's the average days-on-market for RENTAL listings here right now (not sales)? A rising rental-DOM trend means longer vacancies and softer asking-rent achievability than the comps imply.
- What's the recent tenant-quality profile in this submarket — average credit score on applications, eviction rate, late-payment / NSF rate, and stable-employment percentage? A property-management company in the area should have these aggregated.
- How much new for-sale + rental construction is in the pipeline within 1–3 miles? Heavy new supply typically softens prices + rents 12–24 months out; constrained supply supports both.
Investment metrics
- 1% rule
- 1.94% ✓
- Cap rate
- 17.19%
- Cash-on-cash
- 38.90%
- DSCR
- 2.73
- GRM
- 4.3
CMA / ARV
- ARV (median comp)
- $133,716
- List price
- $53,900
- Delta
- -59.69%
- Verdict
- UNDERPRICED
- Comps
- 20 within 1.0 mi
Show comp detail 12 sales within ~0.75 mi
| Address | Dist | Beds/Ba | Sqft | Sold | Price | $/sf | Match |
|---|---|---|---|---|---|---|---|
| 914 Cherry St | 0.16mi | 2/1.0 | 1,226 (-2%) | 4mo | $139,900 | $114 | 86 |
| 1008 Elm St | 0.26mi | 2/1.0 | 1,239 (-1%) | 18mo | $99,900 | $81 | 72 |
| 904 Vine St | 0.35mi | 2/1.0 | 1,134 (-9%) | 6mo | $135,000 | $119 | 63 |
| 1521 Webster St | 0.43mi | 3/1.0 (+1) | 1,166 (-7%) | 1mo | $165,000 | $142 | 63 |
| 1309 Directory St | 0.54mi | 3/2.0 (+1) | 1,260 (+1%) | 2mo | $135,000 | $107 | 62 |
| 1409 Cooper St | 0.31mi | 2/1.0 | 1,150 (-8%) | 12mo | $119,000 | $103 | 62 |
| 714 Vine St | 0.40mi | 2/1.0 | 1,097 (-12%) | 5mo | $155,000 | $141 | 57 |
| 400 Calhoun St | 0.48mi | 3/1.0 (+1) | 1,162 (-7%) | 13mo | $155,000 | $133 | 50 |
| 115 Calhoun St | 0.63mi | 2/1.0 | 1,216 (-3%) | 20mo | $125,000 | $103 | 49 |
| 374 Woodrow St | 0.66mi | 2/1.0 | 1,100 (-12%) | 2mo | $125,000 | $114 | 48 |
| 406 Calhoun St | 0.47mi | 3/1.5 (+1) | 1,092 (-13%) | 6mo | $136,500 | $125 | 44 |
| 209 Walnut St | 0.65mi | 3/1.0 (+1) | 1,348 (+8%) | 14mo | $100,000 | $74 | 40 |
Match score weights: distance 35% · size 25% · config 20% · recency 20%. Top-matched comps best support the ARV.
Projected returns pro-forma
-3.0% appreciation · 3.0% rent growth · sell at horizon
- IRR
- 35.1%
- Equity multiple
- 2.49×
- Total profit
- $22,421
- Equity at exit
- $8,037
- IRR
- 41.9%
- Equity multiple
- 4.95×
- Total profit
- $59,624
- Equity at exit
- $4,660
Cash invested: $15,092 (down + closing). Projections, not guarantees.
Landlord ↔ Tenant lean methodology
- Overall (STATE)
- 81 Strongly Landlord-Friendly
- State Missouri
- 81 Strongly Landlord-Friendly · R+10
- County
- — inherits STATE
- City
- — inherits STATE
ZIP-level market 64601
- Home prices YoY
- -15.3%
- Active inventory
- 71
- Price-to-rent
- 4.3×
Monthly cashflow live
- Estimated rent
- $1,046 medium interval (Pro) →
- Mortgage (P&I)
- −$283
- Tax from tax record
- −$32 /mo · $384/yr
- Insurance
- −$22
- HOA
- −$0
- Vacancy / Maint / Mgmt
- −$220
- Net cashflow
- $489
Break-even live
Sensitivity live
| Price | -10% $520 | -5% $505 | +0% $489 | +5% $474 | +10% $459 |
|---|---|---|---|---|---|
| Rent | -10% $407 | -5% $448 | +0% $489 | +5% $531 | +10% $572 |
| Rate | -1.0pp $516 | -0.5pp $503 | base $489 | +0.5pp $475 | +1.0pp $461 |
UW: 25.0% down · 7.5% · 30yr · 1.5% tax · 5.0% vac · 8.0% maint · 8.0% mgmt
Financing live
Cash to close
- Down payment
- $13,475
- Closing costs
- $1,617
- Reserves months
- —
- Total cash needed
- —
Loan-product check · same deal, 3 products live
Conventional
25% down · 7.5% · 30yr
- Down + closing
- —
- Monthly P&I
- —
- Monthly cashflow
- —
- DSCR
- —
- Eligible?
- —
Personal DTI + credit; lowest rate.
DSCR
20% down · 8.5% · 30yr
- Down + closing
- —
- Monthly P&I
- —
- Monthly cashflow
- —
- DSCR
- —
- Eligible?
- —
No personal income docs; deal must DSCR.
Hard money
10% down · 12.0% · 12mo
- Down + closing
- —
- Monthly P&I
- —
- Monthly cashflow
- —
- DSCR
- —
- Eligible?
- —
Short-term bridge; refi at stabilization.
Listing history 1 events
-
2026-05-14$53,900 Active 268-char remark
ⓘ Source: listings_history table (triggers on properties + properties_extension) + one-shot
backfill from property_details.listing_events for pre-trigger history.
Tax reassessment forecast MO · Resets to sale price
- Current annual tax
- $384 · $32/mo
- Projected year-2 tax
- $523 · $44/mo
- Expected delta
- +$139/yr (+$12/mo · 36.1%)
ⓘ Screening estimate from a state-policy table — verify with the county assessor before closing.
Climate risk First Street
- Flood 1/10 Low FEMA zone X (unshaded) · 0% chance over 30 yrs
- Wildfire 1/10 Low
- Heat 4/10 Moderate 7 d/yr ≥107°F today · 15 d/yr by 30 yrs out
- Wind 2/10 Low
- Air quality 2/10 Low 0 unhealthy d/yr today · 1 by 30 yrs out
Nearby sold comps map
Loading sold comps map…
Walkable amenities ~0.75 mi
Loading nearby amenities…
Taxation est. · year 1
- Rental income
- $12,553
- − Mortgage interest
- −$3,019
- − Property taxes
- −$384
- − Insurance
- −$270
- − Repairs & maintenance
- −$1,004
- − Management
- −$1,004
- − Depreciation
- −$1,568
- Taxable income
- $5,303
- Est. tax owed @ 24.0%
- −$1,273
- After-tax cash flow
- $4,598/yr
For passive investors: Depreciation is non-cash, so a rental often shows a tax loss while cash-flowing — sheltering income. Rental losses are passive: they offset passive income freely, and up to $25,000/yr can offset ordinary (W-2) income if you actively participate and your MAGI is under $100k (phasing out to $0 by $150k); unused losses carry forward. On sale, claimed depreciation is recaptured at up to 25%, and gains may owe capital-gains tax (a 1031 exchange can defer both). Figures are a year-1 estimate at your 24.0% rate — not tax advice; consult a CPA.
Schools (NCES district)
- District
- Chillicothe R-II
- NCES district ID
- 2908760
- Math proficiency
- 49% ▲ 4.00%
- Reading proficiency
- 48% ▲ 4.00%
- Median HH income
- $42,193
- Composite
- 40.81/100
- National rank
- #3637
- State rank
- #60 of 324 in MO
Livability — Chillicothe
- Score
- 67/100
- State rank
- #225
- US rank
- #10947
Category grades
Schools grade is shown separately in the Schools card above.
Census & demographics
- Census place
- Chillicothe, MO
- Population (ZIP)
- 12,110
Population outlook (Livingston County) Hauer SSP2
- Today (2025)
- 14,945 people
- By 2030
- 14,945 · +0.0%
- By 2040
- 15,010 · +0.4%
- By 2050
- 15,105 · +1.1%
- By 2075
- 15,950 · +6.7%
- By 2100
- 15,897 · +6.4%
Race, ethnicity, and origin ACS 2023
- Neighborhood character
- Predominantly White (91%)
- Race & ethnicity
- White 91% Two or more races 4% Black 3% Hispanic / Latino 2%
- Common ancestry
- Slovak 2% Italian 1% Romanian 1%
- Foreign-born
- 1% · Canada
Political lean MEDSL · Livingston
- 2024 margin
- Solid R (+57.8) · D 20.7% · R 78.5%
- 2008→2024 swing
- -34.0pp toward R · 2008: -23.8pp · 2024: -57.8pp
- All cycles
- 2024: R+57.8 2020: R+57.1 2016: R+56.4 2012: R+34.7 2008: R+23.8
Not yet ingested
- Civics
- —
Market trends
- HPI YoY
- ▼ -32.00%
- Current HPI
- 177.3092
- Rent YoY
- —
- Metro
- —
- State GDP YoY
- ▲ 1.84%
- F500 in state
- 20
Industry mix (Fortune 500 HQ in MO)
| Industry | F500 HQs | Revenue |
|---|---|---|
| Healthcare | 1 | $163B |
|
||
| Insurance | 1 | $21B |
|
||
| Industrial Technology | 1 | $17B |
|
||
| Retail | 1 | $16B |
|
||
| Industrial Distribution | 1 | $10B |
|
||
| Utilities | 1 | $9B |
|
||
Price history
2 events — show timeline
- 2026-05-26 Pending — NECAR
- 2026-05-14 Listed $53,900 NECAR
Property tax history
+3.6%/yrLatest (2025): $384 · +2.3% YoY. Source: county tax records.
Cash-flow waterfall
monthlySold comps — $/sqft
last 12 mo · ≤1 miLoading sold comps…