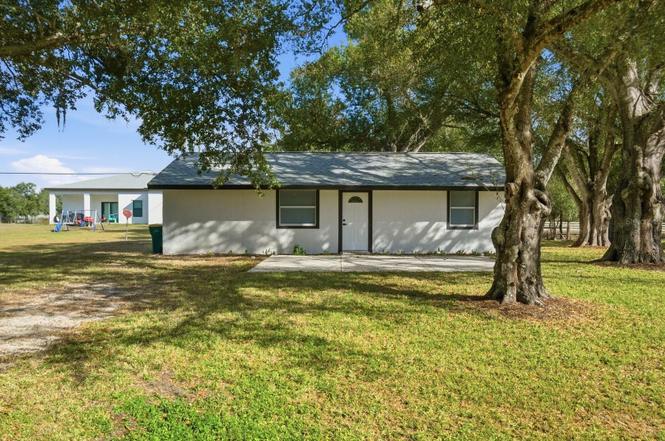
390 Hazel Cir · Harbour Heights, FL
Flood risk 3/10 · Minor
- FEMA flood zone
- X (unshaded)
- Chance of flooding over 30 yrs
- 0.12%
- Est. flood insurance / yr
- $507 – $1,088
Fire risk 5/10 · Moderate
- Est. fire insurance / yr
- $947 – $1,759
Heat risk 10/10 · Severe
- Hot days now (above 108°F)
- 7 days/yr
- Hot days in 30 yrs
- 27 days/yr
Wind risk 10/10 · Severe
- Chance of severe wind over 30 yrs
- 99.0%
Air-quality risk 2/10 · Minimal
- Unhealthy air days now
- 2 days/yr
- Unhealthy air days in 30 yrs
- 2 days/yr
Risk factors via First Street. Map © Google.
Why this score? — see what drove the D+ grade
The composite is a weighted blend of 9 inputs, each scored 0–100. Each bar is that input's sub-score; the figure is the points it added to the 100-point composite (weight × sub-score).
- ARV discount +15.0/15.0
- Cash flow +11.1/30.0
- Schools +4.6/10.0
- Rent growth +3.5/5.0
- DSCR +3.2/10.0
- Livability +3.2/5.0
- 1% rule +2.6/10.0
- Condition / age +2.5/5.0
- Appreciation +2.4/10.0
$238,000
🖨 Deal sheet 📄 Offer letter ✓ Due diligence
Listing remarks
Under contract-accepting backup offers. Spacious 5-bedroom, 2-bath residence located on a 10,000 sq ft lot offering plenty of space for boat or trailer storage. This home has been fully updated and features a new 2024 roof, impact windows, updated plumbing, electrical, and lighting systems, and a recently serviced A/C. The interior offers porcelain tile flooring throughout, an open living and kitchen layout, custom closet systems, and a redesigned kitchen with new appliances. Washer and dryer are included. The floor plan provides flexibility with a large primary suite or private in-law setup. Both bathrooms have been renovated with modern finishes. Situated outside the flood zone, the prope
Key facts
- Updated electrical
- New roof
- Impact windows
Tags
Property features AI
Finance
- Other: Property type: Residential (Single Family Residence); Zoning: RSF3.5
- Financial info: No lease restrictions
- HOA & community: No HOA/association
Exterior
- Parking: No specific parking details provided
- Utilities: Well water; Septic tank; High-speed internet (available); Cable available; Electricity available; Phone service available
- Home design: Single-family residence; One-story; West-facing; Completed condition; Entry on one level
- Construction: Block and stucco construction; Shingle roof; Slab foundation; Built on 0.23-acre lot (approx. 80 x 125)
- Exterior features: Asphalt road access
Interior
- Kitchen: Range; Microwave; Refrigerator; Electric water heater
- Bedrooms: 5 bedrooms
- Flooring: Tile
- Bathrooms: 2 full bathrooms
- Heating & cooling: Central heating; Central air conditioning
- Interior features: Living room/dining room combo; Shades on windows
- Laundry & utility: Washer and Dryer located in the kitchen
Neighborhood map
What this means for you Summary
Snapshot
- This is a 2-bed/2.0-bath single-family listed at $238k.
Deal economics
- At list price, monthly cash flow is $-96 ($-1k/yr) — negative.
- To cash-flow at today's rent, offer at most $221k (7.1% below list).
- To meet the 1% rule (rent ≥ 1% of price), the offer needs to be $181k (23.8% below list).
- Recommended offer: $181k (23.8% below list) — sets the bar for 1% rule.
- Cap rate 5.8% vs local median 4.0% in Harbour Heights — top-decile yield for the area; either an underpriced asset or a hidden risk that comps aren't pricing in. Stress-test before assuming the spread holds.
Location & tenants
- Location reads 64/100 on livability (#684 in FL) — a middle-class / working-renter tenant base. Strengths: crime A+, housing A+, employment B; Watch: amenities F, commute F, health & safety D-.
- Charlotte (suburban): math 54% / reading 54% proficiency, ranked #22 of 73 in FL (top 30%) — acceptable for families but not a draw, mixed tenant base, ~2y average lease.
- Zoned schools: Peace River Elementary School (math 56% / reading 54%, grade C, #872 of 2,144 statewide, top 42%, 581 students, 64% FRL); Port Charlotte High School (math 23% / reading 38%, grade F, #434 of 667 statewide, top 66%, 1,649 students, 43% FRL) — zoned schools at 54% FRL track the district average.
- Market conditions: Rents rising fast (+4.1%/yr); 1037 active listings in the ZIP; 5 comparable units currently listed for rent nearby; rentals leasing fast (median 14d on market — plan ~1-2 weeks tenant-placement turnaround); 4,585 units permitted in Charlotte County in 2024 (703 in 5+ unit buildings).
- This rent runs 30% of the median local income ($72k/yr) — at the standard rent-burdened threshold; future hikes will face affordability resistance.
Forward outlook
- Local home prices are declining (-3.0%/yr); year-one equity from $2k of loan paydown is wiped out by about $7k of value loss. Plan a longer hold.
- Charlotte County population projected at +24% by 2050 — long-run rental-demand tailwind backs the buy-and-hold thesis.
Negotiation context
- It's been on market 122 days — a 12% lower offer ($209k) is reasonable based on typical stale-listing flexibility.
- 9 sale attempts since 2y ago; this cycle's ask has dropped $32k (12%) from the opening price — seller is motivated, your offer sets the floor, not the list.
- Current owner paid $175k; 36% above their basis — modest negotiation headroom, anchor on the comps not their cost.
Risks & watch-outs
- Climate carrying-cost: severe wind risk, 99% chance of damaging wind over 30y; moderate wildfire risk; extreme-heat days projected 7→27/yr by 2055 (HVAC capex compounding) — expect insurance premiums to compound above CPI over the hold.
Questions for the listing agent
- What do current leases actually rent for vs. the listed asking? Can we see a recent rent roll and the last 12 months of T-12 income?
- It's been on market 122 days. Have you received any prior offers? Is the seller open to a 24% concession, seller financing, or rate buy-down credit?
- Why hasn't it sold? Are there any deal-killer items the seller is aware of (foundation, flood, title, zoning, code violations)?
- Is there a deadline driving the sale (1031 exchange, divorce, estate, relocation)? That informs how much negotiation room exists.
- Schools are F-rated, which usually means shorter tenancies and higher turnover. Who's the typical renter profile here, and what's been the actual vacancy rate?
- The area grade is low — what's the realistic commute time and amenity access for the typical tenant pool here? Any planned neighborhood developments (good or bad) we should know about?
- What's the average days-on-market for RENTAL listings here right now (not sales)? A rising rental-DOM trend means longer vacancies and softer asking-rent achievability than the comps imply.
- What's the recent tenant-quality profile in this submarket — average credit score on applications, eviction rate, late-payment / NSF rate, and stable-employment percentage? A property-management company in the area should have these aggregated.
- How much new for-sale + rental construction is in the pipeline within 1–3 miles? Heavy new supply typically softens prices + rents 12–24 months out; constrained supply supports both.
Investment metrics
- 1% rule
- 0.76% ✗
- Cap rate
- 5.81%
- Cash-on-cash
- -1.72%
- DSCR
- 0.92
- GRM
- 10.9
CMA / ARV
- ARV (on-the-fly)
- $401,800
- Comps found
- 2
Show comp detail 2 sales within ~0.75 mi
| Address | Dist | Beds/Ba | Sqft | Sold | Price | $/sf | Match |
|---|---|---|---|---|---|---|---|
| 29350 Goodhue St | 0.44mi | 3/2.0 (+1) | 1,587 (+13%) | 3mo | $455,000 | $287 | 50 |
| 29425 Goodhue St | 0.41mi | 3/2.0 (+1) | 1,200 (-14%) | 22mo | $265,000 | $221 | 34 |
Match score weights: distance 35% · size 25% · config 20% · recency 20%. Top-matched comps best support the ARV.
Projected returns pro-forma
-3.0% appreciation · 4.13% rent growth · sell at horizon
- IRR
- -18.0%
- Equity multiple
- 0.36×
- Total profit
- $-42,621
- Equity at exit
- $35,487
- IRR
- -8.4%
- Equity multiple
- 0.45×
- Total profit
- $-36,387
- Equity at exit
- $20,578
Cash invested: $66,640 (down + closing). Projections, not guarantees.
Landlord ↔ Tenant lean methodology
- Overall (STATE)
- 87 Strongly Landlord-Friendly
- State Florida
- 87 Strongly Landlord-Friendly · R+3
- County
- — inherits STATE
- City
- — inherits STATE
ZIP-level market 33982
- Home prices YoY
- -1.2%
- Rents YoY
- 4.1%
- Active inventory
- 1037
- Price-to-rent
- 10.9×
Monthly cashflow live
- Estimated rent
- $1,814 high interval (Pro) →
- Mortgage (P&I)
- −$1,248
- Tax from tax record
- −$181 /mo · $2,175/yr
- Insurance
- −$99
- HOA
- −$0
- Vacancy / Maint / Mgmt
- −$381
- Net cashflow
- $-96
Break-even live
UW: 25.0% down · 7.5% · 30yr · 1.5% tax · 5.0% vac · 8.0% maint · 8.0% mgmt
Financing live
Cash to close
- Down payment
- $59,500
- Closing costs
- $7,140
- Reserves months
- —
- Total cash needed
- —
Loan-product check · same deal, 3 products live
Conventional
25% down · 7.5% · 30yr
- Down + closing
- —
- Monthly P&I
- —
- Monthly cashflow
- —
- DSCR
- —
- Eligible?
- —
Personal DTI + credit; lowest rate.
DSCR
20% down · 8.5% · 30yr
- Down + closing
- —
- Monthly P&I
- —
- Monthly cashflow
- —
- DSCR
- —
- Eligible?
- —
No personal income docs; deal must DSCR.
Hard money
10% down · 12.0% · 12mo
- Down + closing
- —
- Monthly P&I
- —
- Monthly cashflow
- —
- DSCR
- —
- Eligible?
- —
Short-term bridge; refi at stabilization.
Rent comps 5 comps
| Address | Beds | Baths | Sqft | Rent | $/sqft | DOM | Units | Dist |
|---|---|---|---|---|---|---|---|---|
| 29469 Peace River Shores Blvd Punta Gorda, FL | 2.0 | 2.0 | 1045 | $1,495 | $1.43 | 21d | 1 | 0.24mi |
| 322 Organ St Unit A Punta Gorda, FL | 2.0 | 1.0 | 925 | $1,350 | $1.46 | 13d | 1 | 0.26mi |
| Organ St , FL | 2.0 | 2.0 | 1000 | $1,500 | $1.50 | 21d | 1 | 0.34mi |
| 114 Organ St Punta Gorda, FL | 2.0 | 2.0 | 1045 | $1,495 | $1.43 | 13d | 1 | 0.49mi |
| 18 Organ St Unit 18 Punta Gorda, FL | 3.0 | 2.0 | 1200 | $2,400 | $2.00 | 13d | 1 | 0.65mi |
Listing history 26 events
-
2026-05-16status Pending
-
2026-05-06price $238,000
-
2026-04-02price $250,000
-
2026-01-14$269,900 Active
-
2025-11-26historical
-
2025-10-07historical
-
2025-09-25historical $2,200
-
2025-09-25historical
-
2025-08-29$2,200
-
2025-08-11price $269,000
-
2025-06-22price $275,000
-
2025-06-21price $275,000
-
2025-06-04$295,000 Active
-
2025-06-04$295,000 Active
-
2025-05-15$295,000 Active
-
2025-02-25soldstatus $175,000 Closed
-
2025-01-22status Pending
-
2024-10-17status Active
-
2024-09-23status Pending
-
2024-09-20status Active
-
2024-09-11status Pending
-
2024-08-28status Active
-
2024-08-26status Pending
-
2024-08-19$179,000 Active
-
1993-02-01soldstatus $34,500
-
1992-07-01soldstatus $34,300
ⓘ Source: listings_history table (triggers on properties + properties_extension) + one-shot
backfill from property_details.listing_events for pre-trigger history.
Tax reassessment forecast FL · Resets to sale price
- Current annual tax
- $2,175 · $181/mo
- Projected year-2 tax
- $2,175 · $181/mo
- Expected delta
- $0/yr ($0/mo · 0.0%)
ⓘ Screening estimate from a state-policy table — verify with the county assessor before closing.
Climate risk First Street
- Flood 3/10 Moderate FEMA zone X (unshaded) · 12% chance over 30 yrs
- Wildfire 5/10 Major
- Heat 10/10 Extreme 7 d/yr ≥108°F today · 27 d/yr by 30 yrs out
- Wind 10/10 Extreme 99% chance of damaging wind over 30 yrs
- Air quality 2/10 Low 2 unhealthy d/yr today · 2 by 30 yrs out
Nearby sold comps map
Loading sold comps map…
Walkable amenities ~0.75 mi
Loading nearby amenities…
Taxation est. · year 1
- Rental income
- $21,764
- − Mortgage interest
- −$13,332
- − Property taxes
- −$2,175
- − Insurance
- −$1,190
- − Repairs & maintenance
- −$1,741
- − Management
- −$1,741
- − Depreciation
- −$6,924
- Taxable loss
- −$5,339
- Est. tax savings @ 24.0%
- +$1,281
- After-tax cash flow
- $133/yr
For passive investors: Depreciation is non-cash, so a rental often shows a tax loss while cash-flowing — sheltering income. Rental losses are passive: they offset passive income freely, and up to $25,000/yr can offset ordinary (W-2) income if you actively participate and your MAGI is under $100k (phasing out to $0 by $150k); unused losses carry forward. On sale, claimed depreciation is recaptured at up to 25%, and gains may owe capital-gains tax (a 1031 exchange can defer both). Figures are a year-1 estimate at your 24.0% rate — not tax advice; consult a CPA.
Schools (NCES district)
- District
- Charlotte
- NCES district ID
- 1200240
- Math proficiency
- 54% ▼ -6.00%
- Reading proficiency
- 54% ▼ -1.00%
- Median HH income
- $44,864
- Composite
- 45.62/100
- National rank
- #2586
- State rank
- #22 of 73 in FL
Livability — Harbour Heights
- Score
- 64/100
- State rank
- #684
- US rank
- #14202
Category grades
Schools grade is shown separately in the Schools card above.
Census & demographics
- County
- Charlotte County · 196,994 people
- City population
- 57,035
- Metro
- Punta Gorda, FL
- Population (ZIP)
- 13,006
- Household income
- $72,443
- Rent vs Own
- Severe rent burden
- 43.0
Population outlook (Charlotte County) Hauer SSP2
- Today (2025)
- 198,646 people
- By 2030
- 210,507 · +6.0%
- By 2040
- 230,857 · +16.2%
- By 2050
- 247,148 · +24.4%
- By 2075
- 281,777 · +41.8%
- By 2100
- 293,609 · +47.8%
Race, ethnicity, and origin ACS 2023
- Neighborhood character
- Predominantly White (81%)
- Race & ethnicity
- White 81% Two or more races 8% Hispanic / Latino 7% Black 7%
- Hispanic origin (detail)
- Puerto Rican 2% Cuban 3%
- Common ancestry
- Lithuanian 3% Iranian 3% Slovak 3%
- Foreign-born
- 6% · Canada, Jamaica
- Languages at home
- 93% English-only · Spanish 5% German/W. Germanic 1% Arabic 1%
Political lean MEDSL · Charlotte
- 2024 margin
- Solid R (+34.0) · D 32.7% · R 66.7%
- 2008→2024 swing
- -26.7pp toward R · 2008: -7.2pp · 2024: -34.0pp
- All cycles
- 2024: R+34.0 2020: R+26.6 2016: R+27.8 2012: R+14.3 2008: R+7.2
Not yet ingested
- Civics
- —
Market trends
- HPI YoY
- ▼ -5.25%
- Current HPI
- 448.5895
- Rent YoY
- ▲ 4.13%
- Metro
- Punta Gorda, FL
- State GDP YoY
- ▲ 3.28%
- F500 in state
- 36
Industry mix (Fortune 500 HQ in FL)
| Industry | F500 HQs | Revenue |
|---|---|---|
| Industrial Technology | 2 | $29B |
|
||
| Insurance | 2 | $17B |
|
||
| Retail | 1 | $60B |
|
||
| Technology Distribution | 1 | $58B |
|
||
| Homebuilding | 1 | $35B |
|
||
| Technology Manufacturing | 1 | $35B |
|
||
Price history
+593.9% since first listed26 events — show timeline
- 2026-05-16 Pending — Stellar MLS as Distributed by MLS Grid
- 2026-05-06 Price Changed $238,000 Stellar MLS as Distributed by MLS Grid
- 2026-04-02 Price Changed $250,000 Stellar MLS as Distributed by MLS Grid
- 2026-01-14 Listed $269,900 Stellar MLS as Distributed by MLS Grid
- 2025-11-26 Listing Removed — NAPLESMLS
- 2025-10-07 Listing Removed — MARMLS
- 2025-09-25 Rental Removed $2,200 STELLARMLS
- 2025-09-25 Listing Removed — Stellar MLS as Distributed by MLS Grid
- 2025-08-29 Listed for Rent $2,200 STELLARMLS
- 2025-08-11 Price Changed $269,000 Stellar MLS as Distributed by MLS Grid
- 2025-06-22 Price Changed $275,000 NAPLESMLS
- 2025-06-21 Price Changed $275,000 MARMLS
- 2025-06-04 Listed $295,000 Stellar MLS as Distributed by MLS Grid
- 2025-06-04 Listed $295,000 NAPLESMLS
- 2025-05-15 Listed $295,000 MARMLS
- 2025-02-25 Sold (MLS) $175,000 Stellar MLS as Distributed by MLS Grid
- 2025-01-22 Pending — Stellar MLS as Distributed by MLS Grid
- 2024-10-17 Relisted — Stellar MLS as Distributed by MLS Grid
- 2024-09-23 Pending — Stellar MLS as Distributed by MLS Grid
- 2024-09-20 Relisted — Stellar MLS as Distributed by MLS Grid
- 2024-09-11 Pending — Stellar MLS as Distributed by MLS Grid
- 2024-08-28 Relisted — Stellar MLS as Distributed by MLS Grid
- 2024-08-26 Pending — Stellar MLS as Distributed by MLS Grid
- 2024-08-19 Listed $179,000 Stellar MLS as Distributed by MLS Grid
- 1993-02-01 Sold (Public Records) $34,500 Public Records
- 1992-07-01 Sold (Public Records) $34,300 Public Records
Property tax history
+6.1%/yrLatest (2025): $2,175 · -41.2% YoY. Source: county tax records.
Cash-flow waterfall
monthlySold comps — $/sqft
last 12 mo · ≤1 miLoading sold comps…