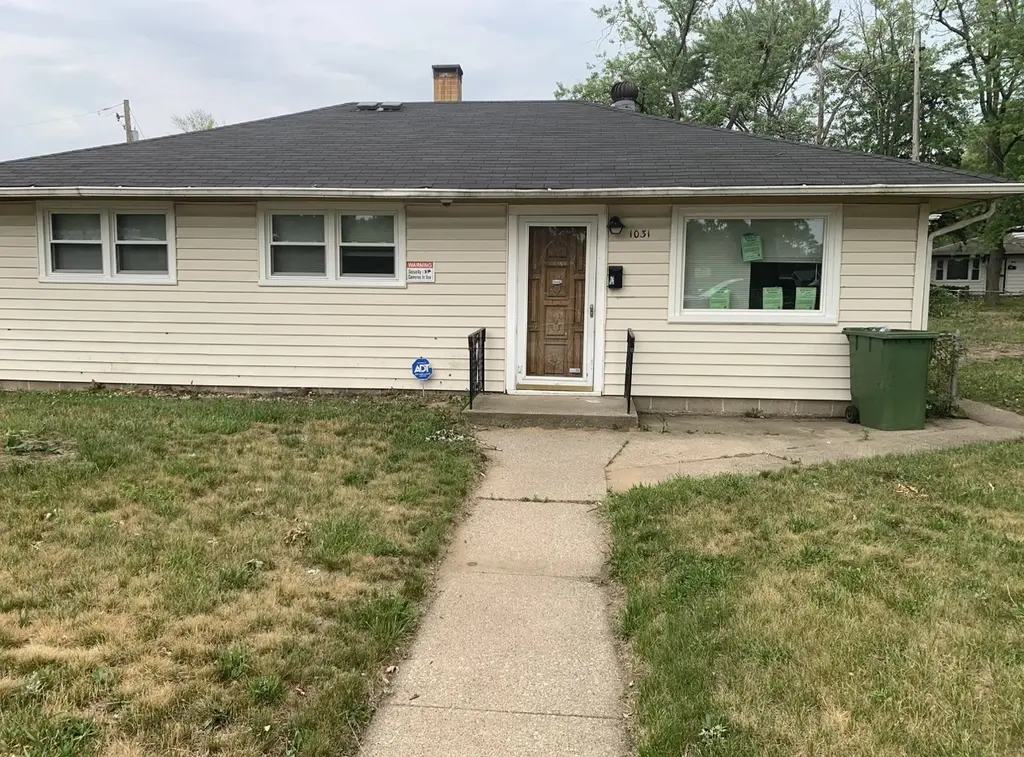
1031 E 146th St · Dolton, IL
Flood risk 1/10 · Minimal
- FEMA flood zone
- X (unshaded)
- Chance of flooding over 30 yrs
- 0.0%
- Est. flood insurance / yr
- $473 – $860
Fire risk 1/10 · Minimal
- Est. fire insurance / yr
- $804 – $1,492
Heat risk 3/10 · Minor
- Hot days now (above 101°F)
- 7 days/yr
- Hot days in 30 yrs
- 15 days/yr
Wind risk 2/10 · Minimal
- Chance of severe wind over 30 yrs
- —
Air-quality risk 4/10 · Minor
- Unhealthy air days now
- 4 days/yr
- Unhealthy air days in 30 yrs
- 5 days/yr
Risk factors via First Street. Map © Google.
Why this score? — see what drove the C+ grade
The composite is a weighted blend of 9 inputs, each scored 0–100. Each bar is that input's sub-score; the figure is the points it added to the 100-point composite (weight × sub-score).
- Cash flow +25.9/30.0
- 1% rule +9.2/10.0
- DSCR +8.7/10.0
- Rent growth +4.9/5.0
- ARV discount +4.8/15.0
- Livability +3.7/5.0
- Condition / age +2.5/5.0
- Schools +0.7/10.0
- Appreciation +0.0/10.0
$165,000
🖨 Deal sheet 📄 Offer letter ✓ Due diligence
Listing remarks MLS
There are no remarks available.
Key facts
- 9,365 sq ft lot
- Garage
- Built 1954
Property features AI
Finance
- Other: Possession at closing
- HOA & community: No master association required
Exterior
- Parking: Detached owned garage (1 garage space, 1 total parking space)
- Utilities: Public water; Public sewer; Public power available
- Home design: Detached single-family home; One-story; Fee simple ownership; Built before 1978
- Construction: Frame construction; Estimated living area; Age approximately 71–80 years
- Exterior features: Standard Chicago lot; Lot dimensions 124 x 196 x 151
Interior
- Kitchen: Kitchen (main level, 11 x 10)
- Bedrooms: 5 bedrooms (all on the main level); Master bedroom (main level, 16 x 10); Bedroom 2 (main level, 10 x 10); Bedroom 3 (main level, 13 x 11); Bedroom 4 (main level, 11 x 13); Bedroom 5 (main level, 10 x 12)
- Bathrooms: 2 full bathrooms
- Heating & cooling: Forced air heating
- Interior features: 8 total rooms; Family room; Living room; Dining room
- Laundry & utility: Laundry room
Neighborhood map
What this means for you Summary
Snapshot
- This is a 3-bed/1.0-bath single-family listed at $165k.
Deal economics
- At list price, monthly cash flow is $407 ($5k/yr) — positive.
- The deal already cash-flows at list — no discount required.
- Meets the 1% rule at list price ($2k rent vs $165k).
- Recommended offer: $160k (3.0% below list) — sets the bar for market timing.
Location & tenants
- Location reads 74/100 on livability (#263 in IL, #4,883 nationally) — a middle-class / working-renter tenant base. Strengths: commute A+, cost of living A+, housing A+; Watch: employment C-, health & safety C-, schools F.
- Thornton Twp Hsd 205 (suburban): math 7% / reading 8% proficiency, ranked #594 of 620 in IL (top 96%) — low school quality limits family demand, transient renter base, plan for 1-2y turnover.
- Market conditions: Rents rising fast (+9.7%/yr); 130 active listings in the ZIP; 24 comparable units currently listed for rent nearby; rentals at typical pace (median 19d on market — plan ~3-4 weeks tenant-placement turnaround); 6,272 units permitted in Cook County in 2024 (4,658 in 5+ unit buildings).
- At $2,338/mo this rent would consume 48% of the median local household income ($58k/yr) (locally 919% of renters already pay >50% of income on rent) — very limited rent-growth headroom before tenants either downsize or default.
Forward outlook
- Local home prices are declining (-3.0%/yr); year-one equity from $1k of loan paydown is wiped out by about $5k of value loss. Plan a longer hold.
- At projected returns (-3.0% appreciation + 8.0% rent growth), your $46k cash investment doubles in ~7 years — after that, you're playing with house money.
Negotiation context
- It's been on market 31 days — a 3% lower offer ($160k) is reasonable based on typical stale-listing flexibility.
- 6 sale attempts since 16y ago with the ask held roughly flat each time — persistent listings suggest the price (not the market) is what's stuck; bring a comps-based counter.
- Current owner paid $60k; list at $165k implies a 175% gain — meaningful room to come down on a strong offer.
Risks & watch-outs
- Watch-outs: property tax is 3.7% of price; built in 1954 — expect roof / HVAC / electrical / plumbing capex.
Questions for the listing agent
- It's been on market 31 days. Have you received any prior offers? Is the seller open to a 3% concession, seller financing, or rate buy-down credit?
- Built in 1954 — when were the roof, HVAC, electrical panel, plumbing, and water heater last replaced?
- Property tax is high relative to price — has the assessment been appealed recently, and will the sale trigger a re-assessment?
- Is there a deadline driving the sale (1031 exchange, divorce, estate, relocation)? That informs how much negotiation room exists.
- Schools are F-rated, which usually means shorter tenancies and higher turnover. Who's the typical renter profile here, and what's been the actual vacancy rate?
- Crime grade is D in this area — have there been break-ins, vandalism, or insurance claims at this property in the last 3 years? What carrier currently insures it and at what premium?
- What's the average days-on-market for RENTAL listings here right now (not sales)? A rising rental-DOM trend means longer vacancies and softer asking-rent achievability than the comps imply.
- What's the recent tenant-quality profile in this submarket — average credit score on applications, eviction rate, late-payment / NSF rate, and stable-employment percentage? A property-management company in the area should have these aggregated.
- How much new for-sale + rental construction is in the pipeline within 1–3 miles? Heavy new supply typically softens prices + rents 12–24 months out; constrained supply supports both.
Investment metrics
- 1% rule
- 1.42% ✓
- Cap rate
- 9.26%
- Cash-on-cash
- 10.58%
- DSCR
- 1.47
- GRM
- 5.9
CMA / ARV
- ARV (on-the-fly)
- $155,642
- Comps found
- 12
Show comp detail 12 sales within ~0.75 mi
| Address | Dist | Beds/Ba | Sqft | Sold | Price | $/sf | Match |
|---|---|---|---|---|---|---|---|
| 14521 Kenwood Ave | 0.39mi | 3/2.5 | 1,249 (-5%) | 1mo | $215,000 | $172 | 66 |
| 14325 Ingleside Ave | 0.35mi | 4/2.0 (+1) | 1,400 (+6%) | 1mo | $255,000 | $182 | 64 |
| 14200 Drexel Ave | 0.55mi | 3/1.0 | 1,424 (+8%) | 3mo | $138,200 | $97 | 59 |
| 14315 Dobson Ave | 0.35mi | 4/2.0 (+1) | 1,200 (-9%) | 1mo | $194,888 | $162 | 59 |
| 14700 Avalon Ave | 0.25mi | 3/1.5 | 1,128 (-14%) | 4mo | $125,000 | $111 | 59 |
| 14237 Minerva Ave | 0.43mi | 3/1.5 | 1,196 (-9%) | 4mo | $120,000 | $100 | 59 |
| 14819 Evers St | 0.75mi | 4/2.0 (+1) | 1,304 (-1%) | 0mo | $227,000 | $174 | 54 |
| 14842 Shepard Dr | 0.46mi | 3/1.5 | 1,141 (-14%) | 2mo | $135,000 | $118 | 53 |
| 1429 Kasten Dr | 0.51mi | 3/1.0 | 1,123 (-15%) | 4mo | $119,000 | $106 | 48 |
| 15043 Meadow Ln | 0.66mi | 3/1.0 | 1,151 (-13%) | 1mo | $130,000 | $113 | 47 |
| 14813 Evers St | 0.74mi | 4/1.0 (+1) | 1,127 (-15%) | 3mo | $82,000 | $73 | 34 |
| 15115 Meadow Ln | 0.70mi | 4/2.0 (+1) | 1,487 (+13%) | 4mo | $220,000 | $148 | 33 |
Match score weights: distance 35% · size 25% · config 20% · recency 20%. Top-matched comps best support the ARV.
Projected returns pro-forma
-3.0% appreciation · 8.0% rent growth · sell at horizon
- IRR
- 6.1%
- Equity multiple
- 1.26×
- Total profit
- $11,785
- Equity at exit
- $24,602
- IRR
- 20.2%
- Equity multiple
- 3.18×
- Total profit
- $100,798
- Equity at exit
- $14,266
Cash invested: $46,200 (down + closing). Projections, not guarantees.
Landlord ↔ Tenant lean methodology
- Overall (STATE)
- 43 Moderately Tenant-Leaning
- State Illinois
- 43 Moderately Tenant-Leaning · D+7
- County
- — inherits STATE
- City
- — inherits STATE
ZIP-level market 60419
- Home prices YoY
- -25.7%
- Rents YoY
- 9.7%
- Active inventory
- 130
- Price-to-rent
- 5.9×
Monthly cashflow live
- Estimated rent
- $2,338 high interval (Pro) →
- Mortgage (P&I)
- −$865
- Tax from tax record
- −$505 /mo · $6,066/yr
- Insurance
- −$69
- HOA
- −$0
- Vacancy / Maint / Mgmt
- −$491
- Net cashflow
- $407
Break-even live
UW: 25.0% down · 7.5% · 30yr · 1.5% tax · 5.0% vac · 8.0% maint · 8.0% mgmt
Financing live
Cash to close
- Down payment
- $41,250
- Closing costs
- $4,950
- Reserves months
- —
- Total cash needed
- —
Loan-product check · same deal, 3 products live
Conventional
25% down · 7.5% · 30yr
- Down + closing
- —
- Monthly P&I
- —
- Monthly cashflow
- —
- DSCR
- —
- Eligible?
- —
Personal DTI + credit; lowest rate.
DSCR
20% down · 8.5% · 30yr
- Down + closing
- —
- Monthly P&I
- —
- Monthly cashflow
- —
- DSCR
- —
- Eligible?
- —
No personal income docs; deal must DSCR.
Hard money
10% down · 12.0% · 12mo
- Down + closing
- —
- Monthly P&I
- —
- Monthly cashflow
- —
- DSCR
- —
- Eligible?
- —
Short-term bridge; refi at stabilization.
Rent comps 24 comps
| Address | Beds | Baths | Sqft | Rent | $/sqft | DOM | Units | Dist |
|---|---|---|---|---|---|---|---|---|
| 14433 Woodlawn Ave Dolton, IL | 4.0 | 2.0 | 1300 | $2,000 | $1.54 | 18d | 1 | 0.27mi |
| 14500 Cottage Grove Ave Unit 3 Dolton, IL | 2.0 | 1.0 | 1000 | $1,475 | $1.48 | 24d | 1 | 0.35mi |
| 14716 Dorchester Ave Dolton, IL | 3.0 | 2.0 | 1250 | $2,800 | $2.24 | 19d | 1 | 0.47mi |
| 1429 Kasten Dr Dolton, IL | 3.0 | 1.0 | 1600 | $2,500 | $1.56 | 1d | 1 | 0.53mi |
| 14610 Blackstone Ave Dolton, IL | 3.0 | 1.0 | 1017 | $2,400 | $2.36 | 6d | 1 | 0.56mi |
| 14817 Champlain Ave Dolton, IL | 2.0 | 1.0 | 980 | $2,430 | $2.48 | 22d | 1 | 0.57mi |
| 14738 Blackstone Ave Dolton, IL | 3.0 | 1.0 | 1017 | $2,400 | $2.36 | 10d | 1 | 0.61mi |
| 14916 Langley Ave Dolton, IL | 3.0 | 1.5 | 1418 | $2,500 | $1.76 | 24d | 1 | 0.62mi |
| 14305 Irving Ave Unit 2 Dolton, IL | 3.0 | 1.0 | 1100 | $2,200 | $2.00 | 24d | 1 | 0.64mi |
| 15231 Hastings Dr Dolton, IL | 4.0 | 1.5 | 1487 | $2,146 | $1.44 | 7d | 1 | 0.89mi |
| 409 Madison Ave Unit 2 Calumet City, IL | 3.0 | 1.5 | 1200 | $1,795 | $1.50 | 3d | 1 | 0.97mi |
| 1860 State St Calumet City, IL | 3.0 | 1.0 | 1100 | $1,800 | $1.64 | 17d | 1 | 1.11mi |
| 405 Clyde Ave Calumet City, IL | 3.0 | 1.0 | 973 | $2,300 | $2.36 | 1d | 1 | 1.14mi |
| 15509 Park Ln South Holland, IL | 4.0 | 1.5 | 1200 | $3,400 | $2.83 | 24d | 1 | 1.28mi |
| 15509 Park Ln South Holland, IL | 4.0 | 1.5 | 1200 | $3,400 | $2.83 | 7d | 1 | 1.28mi |
| 14124 Manor Ave Dolton, IL | 3.0 | 2.0 | 1440 | $2,390 | $1.66 | 24d | 1 | 1.30mi |
| 13841 Forest Ave Dolton, IL | 3.0 | 1.0 | 930 | $1,895 | $2.04 | 24d | 1 | 1.34mi |
| 101 Oglesby Ave Calumet City, IL | 2.0 | 1.0 | 1000 | $1,800 | $1.80 | 19d | 1 | 1.41mi |
| 101 Oglesby Ave Calumet City, IL | 2.0 | 1.0 | 1000 | $1,800 | $1.80 | 22d | 1 | 1.41mi |
| 101 Oglesby Ave Calumet City, IL | 2.0 | 1.0 | 1100 | $1,800 | $1.64 | 12d | 1 | 1.41mi |
| 660 Clyde Ave Calumet City, IL | 3.0 | 1.5 | 1400 | $1,750 | $1.25 | 3d | 1 | 1.42mi |
| 250 Yates Ave Unit 1616 Dolton 1E Calumet City, IL | 2.0 | 1.0 | 875 | $1,465 | $1.67 | 7d | 1 | 1.43mi |
| 15707 Dante Dr South Holland, IL | 3.0 | 2.0 | 1800 | $2,950 | $1.64 | 2d | 1 | 1.46mi |
| 15400 Merrill Ave South Holland, IL | 4.0 | 2.0 | 1508 | $3,330 | $2.21 | 22d | 1 | 1.48mi |
Listing history 36 events
-
2026-06-18days on market $165,000 Active 31 DOM
-
2026-06-17days on market $165,000 Active 30 DOM
-
2026-06-16days on market $165,000 Active 29 DOM
-
2026-06-15days on market $165,000 Active 28 DOM
-
2026-06-13days on market $165,000 Active 26 DOM
-
2026-06-13days on market $165,000 Active 25 DOM
-
2026-06-09days on market $165,000 Active 22 DOM
-
2026-06-08days on market $165,000 Active 21 DOM
-
2026-06-07days on market $165,000 Active 20 DOM
-
2026-06-04days on market $165,000 Active 17 DOM
-
2026-06-03days on market $165,000 Active 16 DOM
-
2026-06-02days on market $165,000 Active 15 DOM
-
2026-06-01days on market $165,000 Active 14 DOM
-
2026-05-31days on market $165,000 Active 13 DOM
-
2026-05-18$165,000 Active
-
2025-07-14historical
-
2025-05-13price
-
2025-04-15price
-
2025-04-01price
-
2025-03-22Active
-
2023-02-23soldstatus $60,000
-
2023-02-21soldstatus $60,000 Closed 31-char remark
Show marketing remark (31 chars)
There are no remarks available.
-
2023-01-20historical Contingent - No Showings 31-char remark
Show marketing remark (31 chars)
There are no remarks available.
-
2023-01-10$60,000 Active 31-char remark
Show marketing remark (31 chars)
There are no remarks available.
-
2018-09-18historical Contingent
-
2018-09-17historical
-
2018-07-11price
-
2018-06-13price
-
2018-05-08New
-
2010-11-05soldstatus $19,750 Closed Sale
-
2010-07-14status Pending
-
2010-06-25status Reactivated
-
2010-05-12status Pending
-
2010-05-06price $25,000 Price Change
-
2010-04-30$250,000 New
-
2001-06-11soldstatus $77,500
ⓘ Source: listings_history table (triggers on properties + properties_extension) + one-shot
backfill from property_details.listing_events for pre-trigger history.
Tax reassessment forecast IL · Partial reset (capped growth)
- Current annual tax
- $6,066 · $505/mo
- Projected year-2 tax
- $6,066 · $505/mo
- Expected delta
- $0/yr ($0/mo · 0.0%)
ⓘ Screening estimate from a state-policy table — verify with the county assessor before closing.
Climate risk First Street
- Flood 1/10 Low FEMA zone X (unshaded) · 0% chance over 30 yrs
- Wildfire 1/10 Low
- Heat 3/10 Moderate 7 d/yr ≥101°F today · 15 d/yr by 30 yrs out
- Wind 2/10 Low
- Air quality 4/10 Moderate 4 unhealthy d/yr today · 5 by 30 yrs out
Nearby sold comps map
Loading sold comps map…
Walkable amenities ~0.75 mi
Loading nearby amenities…
Taxation est. · year 1
- Rental income
- $28,054
- − Mortgage interest
- −$9,243
- − Property taxes
- −$6,066
- − Insurance
- −$825
- − Repairs & maintenance
- −$2,244
- − Management
- −$2,244
- − Depreciation
- −$4,800
- Taxable income
- $2,632
- Est. tax owed @ 24.0%
- −$632
- After-tax cash flow
- $4,257/yr
For passive investors: Depreciation is non-cash, so a rental often shows a tax loss while cash-flowing — sheltering income. Rental losses are passive: they offset passive income freely, and up to $25,000/yr can offset ordinary (W-2) income if you actively participate and your MAGI is under $100k (phasing out to $0 by $150k); unused losses carry forward. On sale, claimed depreciation is recaptured at up to 25%, and gains may owe capital-gains tax (a 1031 exchange can defer both). Figures are a year-1 estimate at your 24.0% rate — not tax advice; consult a CPA.
Schools (NCES district)
- District
- Thornton Twp Hsd 205
- NCES district ID
- 1738970
- Math proficiency
- 7% ▬ 0.00%
- Reading proficiency
- 8% ▼ -2.00%
- Median HH income
- $43,392
- Composite
- 6.92/100
- National rank
- #9976
- State rank
- #594 of 620 in IL
Livability — Dolton
- Score
- 74/100
- State rank
- #263
- US rank
- #4883
Category grades
Schools grade is shown separately in the Schools card above.
Census & demographics
- Census place
- Dolton, IL
- County
- Cook County · 4,486,803 people
- City population
- 20,825
- Metro
- Chicago-Naperville-Elgin, IL-IN-WI
- Population (ZIP)
- 20,825
- Household income
- $57,887
- Rent vs Own
- Severe rent burden
- 919.0
Population outlook (Cook County) Hauer SSP2
- Today (2025)
- 5,347,519 people
- By 2030
- 5,357,703 · +0.2%
- By 2040
- 5,324,924 · -0.4%
- By 2050
- 5,230,762 · -2.2%
- By 2075
- 4,785,735 · -10.5%
- By 2100
- 4,188,836 · -21.7%
Race, ethnicity, and origin ACS 2023
- Neighborhood character
- Predominantly Black (91%)
- Race & ethnicity
- Black 91% White 4% Two or more races 3% Hispanic / Latino 1%
- Common ancestry
- Romanian 1% Hispanic 1%
- Foreign-born
- 3% · Canada
- Languages at home
- 95% English-only · French/Haitian/Cajun 2% Spanish 1%
Political lean MEDSL · Cook
- 2024 margin
- Solid D (+42.0) · D 70.4% · R 28.4% · Other 1.2%
- 2008→2024 swing
- -11.4pp toward R · 2008: 53.4pp · 2024: 42.0pp
- All cycles
- 2024: D+42.0 2020: D+50.3 2016: D+53.0 2012: D+49.4 2008: D+53.4
Not yet ingested
- Civics
- —
Market trends
- HPI YoY
- ▼ -66.88%
- Current HPI
- 193.2346
- Rent YoY
- ▲ 9.65%
- Metro
- Chicago-Naperville-Elgin, IL-IN-WI
- State GDP YoY
- ▲ 1.59%
- F500 in state
- 60
Industry mix (Fortune 500 HQ in IL)
| Industry | F500 HQs | Revenue |
|---|---|---|
| Insurance | 4 | $201B |
|
||
| Consumer Goods | 4 | $87B |
|
||
| Industrial Machinery | 3 | $64B |
|
||
| Healthcare | 2 | $55B |
|
||
| Retail / Pharmacy | 1 | $148B |
|
||
| Agriculture / Food | 1 | $86B |
|
||
Price history
+112.9% since first listed22 events — show timeline
- 2026-05-18 Listed $165,000 MRED as Distributed by MLS Grid
- 2025-07-14 Listing Removed — MRED as Distributed by MLS Grid
- 2025-05-13 Price Changed — MRED as Distributed by MLS Grid
- 2025-04-15 Price Changed — MRED as Distributed by MLS Grid
- 2025-04-01 Price Changed — MRED as Distributed by MLS Grid
- 2025-03-22 Listed — MRED as Distributed by MLS Grid
- 2023-02-23 Sold (Public Records) $60,000 Public Records
- 2023-02-21 Sold (MLS) $60,000 MRED as Distributed by MLS Grid
- 2023-01-20 Contingent — MRED as Distributed by MLS Grid
- 2023-01-10 Listed $60,000 MRED as Distributed by MLS Grid
- 2018-09-18 Contingent — MRED as Distributed by MLS Grid
- 2018-09-17 Listing Removed — MRED as Distributed by MLS Grid
- 2018-07-11 Price Changed — MRED as Distributed by MLS Grid
- 2018-06-13 Price Changed — MRED as Distributed by MLS Grid
- 2018-05-08 Listed — MRED as Distributed by MLS Grid
- 2010-11-05 Sold (MLS) $19,750 MRED as Distributed by MLS Grid
- 2010-07-14 Pending — MRED as Distributed by MLS Grid
- 2010-06-25 Relisted — MRED as Distributed by MLS Grid
- 2010-05-12 Pending — MRED as Distributed by MLS Grid
- 2010-05-06 Price Changed $25,000 MRED as Distributed by MLS Grid
- 2010-04-30 Listed $250,000 MRED as Distributed by MLS Grid
- 2001-06-11 Sold (Public Records) $77,500 Public Records
Property tax history
+4.9%/yrLatest (2023): $6,066 · -6.3% YoY. Source: county tax records.
Cash-flow waterfall
monthlySold comps — $/sqft
last 12 mo · ≤1 miLoading sold comps…