 9-Plex
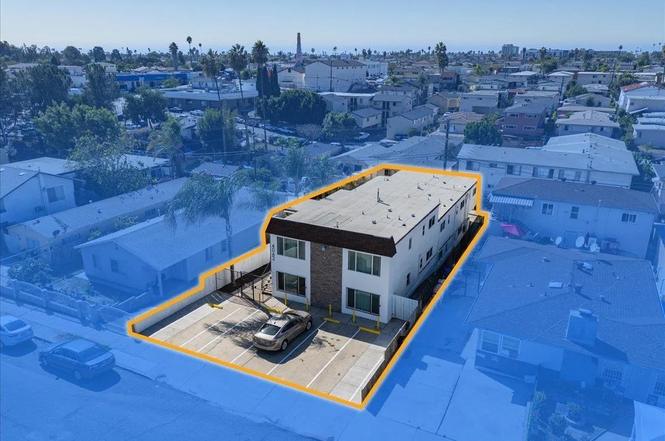
4062 49th St · San Diego, CA
Flood risk 1/10 · Minimal
- FEMA flood zone
- X (unshaded)
- Chance of flooding over 30 yrs
- 0.0%
- Est. flood insurance / yr
- $507 – $1,088
Fire risk 1/10 · Minimal
- Est. fire insurance / yr
- $659 – $1,223
Heat risk 4/10 · Minor
- Hot days now (above 90°F)
- 7 days/yr
- Hot days in 30 yrs
- 20 days/yr
Wind risk 1/10 · Minimal
- Chance of severe wind over 30 yrs
- —
Air-quality risk 3/10 · Minor
- Unhealthy air days now
- 4 days/yr
- Unhealthy air days in 30 yrs
- 4 days/yr
Risk factors via First Street. Map © Google.
Why this score? — see what drove the F grade
The composite is a weighted blend of 9 inputs, each scored 0–100. Each bar is that input's sub-score; the figure is the points it added to the 100-point composite (weight × sub-score).
- Cash flow +8.7/30.0
- ARV discount +4.5/15.0
- Livability +3.8/5.0
- Rent growth +3.2/5.0
- Condition / age +2.5/5.0
- DSCR +2.4/10.0
- Schools +2.2/10.0
- 1% rule +2.0/10.0
- Appreciation +0.0/10.0
$2,290,000
🖨 Deal sheet (PDF) 📄 Offer letter ✓ Due diligence
Multi-family units
County records classify this as Multi-Family (5+ Unit). Listing-text estimate: 9 units. confirmed
5+ unit building — per-unit beds/baths from public records are typically unavailable; the breakdown below (if shown) is an estimate from the listing text.
Listing remarks
4062 49th Street is a 9-unit complex in City Heights with plenty of parking. The 5,190 square foot building built in 1968 is situated on a 5,739 square foot lot. There are nine 1 Bedroom / 1 Bathroom units. All units have been completely remodeled in 2025. There was a new roof installed as well as stucco repair, exterior repaint, new security doors, and water proofing of the balconies. All unit interiors feature new canned lighting, window coverings and vinyl plank flooring with new baseboards. All units have new appliances and electric wall heaters powered by new sub panels. Plumbing was replaced with copper and ABS as needed. The kitchens and bathrooms feature new cabinets, fixtures, hard
Key facts
- Stucco repair
- Completely remodeled
- Water proofing
Tags
Property features AI
Exterior
- Parking: Total of 9 parking spaces
- Home design: Residential income property
- Exterior features: Property listed as residential income (commercial-residential income)
Interior
- Bathrooms: Nine full bathrooms
- Interior features: Nine full bathrooms
Neighborhood map
What this means for you Summary
Snapshot
- This is a 9 × 1-bed/1.0-bath units multifamily listed at $2.29M.
Deal economics
- At list price, monthly cash flow is $-2k ($-23k/yr) — negative. Per door: $-212/mo.
- To cash-flow at today's rent, offer at most $1.95M (14.7% below list).
- To meet the 1% rule (rent ≥ 1% of price), the offer needs to be $1.60M (30.1% below list).
- Recommended offer: $1.60M (30.1% below list) — sets the bar for 1% rule.
- Cap rate 5.3% vs local median 2.0% in San Diego — top-decile yield for the area; either an underpriced asset or a hidden risk that comps aren't pricing in. Stress-test before assuming the spread holds.
Location & tenants
- Location reads 75/100 on livability (#123 in CA, #4,206 nationally) — a middle-class / working-renter tenant base. Strengths: amenities A+, commute A+, employment A+; Watch: health & safety C-, crime D+, cost of living F.
- San Diego Unified (urban): math 19% / reading 29% proficiency, ranked #393 of 517 in CA (top 76%) — low school quality limits family demand, transient renter base, plan for 1-2y turnover.
- Market conditions: Rents rising (+2.6%/yr); 120 active listings in the ZIP; 11,759 units permitted in San Diego County in 2024 (7,244 in 5+ unit buildings).
- At $16,014/mo this rent would consume 280% of the median local household income ($69k/yr) (locally 4800% of renters already pay >50% of income on rent) — very limited rent-growth headroom before tenants either downsize or default.
Forward outlook
- Local home prices are declining (-3.0%/yr); year-one equity from $16k of loan paydown is wiped out by about $69k of value loss. Plan a longer hold.
- San Diego County population projected at +20% by 2050 — long-run rental-demand tailwind backs the buy-and-hold thesis.
Negotiation context
- It's been on market 230 days — a 12% lower offer ($2.02M) is reasonable based on typical stale-listing flexibility.
- 2 sale attempts with the ask held roughly flat each time — persistent listings suggest the price (not the market) is what's stuck; bring a comps-based counter.
- Current owner paid $195k; list at $2.29M implies a 1074% gain — meaningful room to come down on a strong offer.
Questions for the listing agent
- What do current leases actually rent for vs. the listed asking? Can we see a recent rent roll and the last 12 months of T-12 income?
- It's been on market 230 days. Have you received any prior offers? Is the seller open to a 30% concession, seller financing, or rate buy-down credit?
- Can we see the unit-by-unit rent roll, current vacancy, and any below-market leases? What's the average tenancy length?
- What capital expenditures (roof, boiler, parking lot, exteriors) have been made in the last 5 years, and what's planned in the next 2?
- Built in 1968 — when were the roof, HVAC, electrical panel, plumbing, and water heater last replaced?
- Why hasn't it sold? Are there any deal-killer items the seller is aware of (foundation, flood, title, zoning, code violations)?
- Is there a deadline driving the sale (1031 exchange, divorce, estate, relocation)? That informs how much negotiation room exists.
- Schools are B-rated — typically a magnet for longer-tenancy family renters. What's the average tenant stay here, and is there a school-zone premium baked into asking?
- Crime grade is D in this area — have there been break-ins, vandalism, or insurance claims at this property in the last 3 years? What carrier currently insures it and at what premium?
- The area grade is low — what's the realistic commute time and amenity access for the typical tenant pool here? Any planned neighborhood developments (good or bad) we should know about?
- What's the average days-on-market for RENTAL listings here right now (not sales)? A rising rental-DOM trend means longer vacancies and softer asking-rent achievability than the comps imply.
- What's the recent tenant-quality profile in this submarket — average credit score on applications, eviction rate, late-payment / NSF rate, and stable-employment percentage? A property-management company in the area should have these aggregated.
- How much new apartment / multifamily construction is in the pipeline within 1–3 miles? Heavy new supply (>2% of stock underway) typically softens rents 12–24 months out; light construction supports rent growth.
Investment metrics
- 1% rule
- 0.70% ✗
- Cap rate
- 5.29%
- Cash-on-cash
- -3.57%
- DSCR
- 0.84
- GRM
- 11.9
CMA / ARV
- ARV (on-the-fly)
- $2,148,660
- Comps found
- 2
Show comp detail 2 sales within ~0.75 mi
| Address | Dist | Beds/Ba | Sqft | Sold | Price | $/sf | Match |
|---|---|---|---|---|---|---|---|
| 4447 49th St | 0.48mi | 10/9.0 (+1) | 5,075 (-2%) | 5mo | $2,100,000 | $414 | 65 |
| 5011-15 Auburn Dr | 0.45mi | 10/9.0 (+1) | 4,800 (-8%) | 6mo | $1,800,000 | $375 | 57 |
Match score weights: distance 35% · size 25% · config 20% · recency 20%. Top-matched comps best support the ARV.
Projected returns pro-forma
-3.0% appreciation · 2.65% rent growth · sell at horizon
- IRR
- -22.7%
- Equity multiple
- 0.22×
- Total profit
- $-498,741
- Equity at exit
- $341,446
- IRR
- -17.9%
- Equity multiple
- 0.04×
- Total profit
- $-615,833
- Equity at exit
- $197,997
Cash invested: $641,200 (down + closing). Projections, not guarantees.
Landlord ↔ Tenant lean methodology
- Overall (STATE)
- 18 Strongly Tenant-Friendly
- State California
- 18 Strongly Tenant-Friendly · D+13
- County
- — inherits STATE
- City
- — inherits STATE
ZIP-level market 92105
- Rents YoY
- 2.6%
- Active inventory
- 120
- Price-to-rent
- 107.2×
Monthly cashflow live
- Estimated rent
- $16,014 high interval (Pro) →
- Mortgage (P&I)
- −$12,009
- Tax from tax record
- −$1,596 /mo · $19,148/yr
- Insurance
- −$954
- HOA
- −$0
- Vacancy / Maint / Mgmt
- −$3,363
- Net cashflow
- $-1,908
Break-even live
Sensitivity live
| Price | -10% $-611 | -5% $-1,260 | +0% $-1,908 | +5% $-2,556 | +10% $-3,204 |
|---|---|---|---|---|---|
| Rent | -10% $-3,173 | -5% $-2,540 | +0% $-1,908 | +5% $-1,275 | +10% $-643 |
| Rate | -1.0pp $-755 | -0.5pp $-1,325 | base $-1,908 | +0.5pp $-2,501 | +1.0pp $-3,105 |
9-unit breakdown (identical units grouped — click to expand)
| Units | Beds | Baths | Est. rent |
|---|---|---|---|
| 9× units | 1 | 1 | $16,011 |
| #1 | 1 | 1 | $1,779 |
| #2 | 1 | 1 | $1,779 |
| #3 | 1 | 1 | $1,779 |
| #4 | 1 | 1 | $1,779 |
| #5 | 1 | 1 | $1,779 |
| #6 | 1 | 1 | $1,779 |
| #7 | 1 | 1 | $1,779 |
| #8 | 1 | 1 | $1,779 |
| #9 | 1 | 1 | $1,779 |
| Total (9 units) | $16,014 | ||
UW: 25.0% down · 7.5% · 30yr · 1.5% tax · 5.0% vac · 8.0% maint · 8.0% mgmt
Financing live
Cash to close
- Down payment
- $572,500
- Closing costs
- $68,700
- Reserves months
- —
- Total cash needed
- —
Loan-product check · same deal, 3 products live
Conventional
25% down · 7.5% · 30yr
- Down + closing
- —
- Monthly P&I
- —
- Monthly cashflow
- —
- DSCR
- —
- Eligible?
- —
Personal DTI + credit; lowest rate.
DSCR
20% down · 8.5% · 30yr
- Down + closing
- —
- Monthly P&I
- —
- Monthly cashflow
- —
- DSCR
- —
- Eligible?
- —
No personal income docs; deal must DSCR.
Hard money
10% down · 12.0% · 12mo
- Down + closing
- —
- Monthly P&I
- —
- Monthly cashflow
- —
- DSCR
- —
- Eligible?
- —
Short-term bridge; refi at stabilization.
Listing history 19 events
-
2026-06-18days on market $2,290,000 Active 230 DOM
-
2026-06-17days on market $2,290,000 Active 229 DOM
-
2026-06-16days on market $2,290,000 Active 228 DOM
-
2026-06-15days on market $2,290,000 Active 227 DOM
-
2026-06-13days on market $2,290,000 Active 225 DOM
-
2026-06-09days on market $2,290,000 Active 221 DOM
-
2026-06-08days on market $2,290,000 Active 220 DOM
-
2026-06-07days on market $2,290,000 Active 219 DOM
-
2026-06-04days on market $2,290,000 Active 216 DOM
-
2026-06-03days on market $2,290,000 Active 215 DOM
-
2026-06-01days on market $2,290,000 Active 213 DOM
-
2026-05-31days on market $2,290,000 Active 212 DOM
-
2026-03-25price $2,290,000
-
2026-02-02price $2,300,000
-
2026-01-02status Active
-
2026-01-01historical
-
2025-10-27$2,350,000 Active
-
1994-12-07soldstatus $195,000
-
1983-07-22soldstatus $260,000
ⓘ Source: listings_history table (triggers on properties + properties_extension) + one-shot
backfill from property_details.listing_events for pre-trigger history.
Tax reassessment forecast CA · Resets to sale price
- Current annual tax
- $19,148 · $1,596/mo
- Projected year-2 tax
- $19,148 · $1,596/mo
- Expected delta
- $0/yr ($0/mo · 0.0%)
ⓘ Screening estimate from a state-policy table — verify with the county assessor before closing.
Climate risk First Street
- Flood 1/10 Low FEMA zone X (unshaded) · 0% chance over 30 yrs
- Wildfire 1/10 Low
- Heat 4/10 Moderate 7 d/yr ≥90°F today · 20 d/yr by 30 yrs out
- Wind 1/10 Low
- Air quality 3/10 Moderate 4 unhealthy d/yr today · 4 by 30 yrs out
Nearby sold comps map
Loading sold comps map…
Walkable amenities ~0.75 mi
Loading nearby amenities…
Taxation est. · year 1
- Rental income
- $192,168
- − Mortgage interest
- −$128,276
- − Property taxes
- −$19,148
- − Insurance
- −$11,450
- − Repairs & maintenance
- −$15,373
- − Management
- −$15,373
- − Depreciation
- −$66,618
- Taxable loss
- −$64,070
- Est. tax savings @ 24.0%
- +$15,377
- After-tax cash flow
- $-7,516/yr
For passive investors: Depreciation is non-cash, so a rental often shows a tax loss while cash-flowing — sheltering income. Rental losses are passive: they offset passive income freely, and up to $25,000/yr can offset ordinary (W-2) income if you actively participate and your MAGI is under $100k (phasing out to $0 by $150k); unused losses carry forward. On sale, claimed depreciation is recaptured at up to 25%, and gains may owe capital-gains tax (a 1031 exchange can defer both). Figures are a year-1 estimate at your 24.0% rate — not tax advice; consult a CPA.
Schools (NCES district)
- District
- San Diego Unified
- NCES district ID
- 0634320
- Math proficiency
- 19% ▼ -29.00%
- Reading proficiency
- 29% ▼ -28.00%
- Median HH income
- $61,673
- Composite
- 22.31/100
- National rank
- #8135
- State rank
- #393 of 517 in CA
Livability — San Diego
- Score
- 75/100
- State rank
- #123
- US rank
- #4206
Category grades
Schools grade is shown separately in the Schools card above.
Census & demographics
- Census place
- San Diego, CA
- County
- San Diego County · 3,178,799 people
- City population
- 1,397,612
- Metro
- San Diego-Chula Vista-Carlsbad, CA
- Population (ZIP)
- 71,411
- Household income
- $68,563
- Rent vs Own
- Severe rent burden
- 4800.0
Population outlook (San Diego County) Hauer SSP2
- Today (2025)
- 3,678,185 people
- By 2030
- 3,856,546 · +4.8%
- By 2040
- 4,171,407 · +13.4%
- By 2050
- 4,421,607 · +20.2%
- By 2075
- 4,831,599 · +31.4%
- By 2100
- 4,832,502 · +31.4%
Race, ethnicity, and origin ACS 2023
- Neighborhood character
- Diverse neighborhood (Simpson 0.69)
- Race & ethnicity
- Hispanic / Latino 49% Two or more races 23% Asian 18% White 15% Black 13% Native American 2%
- Hispanic origin (detail)
- Mexican 45%
- Common ancestry
- Ukrainian 1% Romanian 1% Lithuanian 1%
- Foreign-born
- 36% · Canada, Vietnam, China
- Languages at home
- 38% English-only · Spanish 39% Vietnamese 9% Other Asian/Pacific 5%
Political lean MEDSL · San Diego
- 2024 margin
- D (+16.8) · D 56.9% · R 40.1% · Other 2.9%
- 2008→2024 swing
- +6.6pp toward D · 2008: 10.2pp · 2024: 16.8pp
- All cycles
- 2024: D+16.8 2020: D+22.8 2016: D+17.8 2012: D+5.1 2008: D+10.2
Not yet ingested
- Civics
- —
Market trends
- HPI YoY
- ▼ -679.97%
- Current HPI
- 483.3536
- Rent YoY
- ▲ 2.65%
- Metro
- San Diego-Chula Vista-Carlsbad, CA
- State GDP YoY
- ▲ 3.21%
- F500 in state
- 116
Industry mix (Fortune 500 HQ in CA)
| Industry | F500 HQs | Revenue |
|---|---|---|
| Technology | 27 | $1,492B |
|
||
| Financial Services | 3 | $174B |
|
||
| Retail | 3 | $44B |
|
||
| Insurance | 3 | $26B |
|
||
| Media / Entertainment | 2 | $115B |
|
||
| Pharmaceuticals / Biotech | 2 | $62B |
|
||
Price history
+780.8% since first listed7 events — show timeline
- 2026-03-25 Price Changed $2,290,000 SDMLS
- 2026-02-02 Price Changed $2,300,000 SDMLS
- 2026-01-02 Relisted — SDMLS
- 2026-01-01 Listing Removed — SDMLS
- 2025-10-27 Listed $2,350,000 SDMLS
- 1994-12-07 Sold (Public Records) $195,000 Public Records
- 1983-07-22 Sold (Public Records) $260,000 Public Records
Property tax history
+10.7%/yrLatest (2025): $19,148 · +288.2% YoY. Source: county tax records.
Cash-flow waterfall
monthlySold comps — $/sqft
last 12 mo · ≤1 miLoading sold comps…