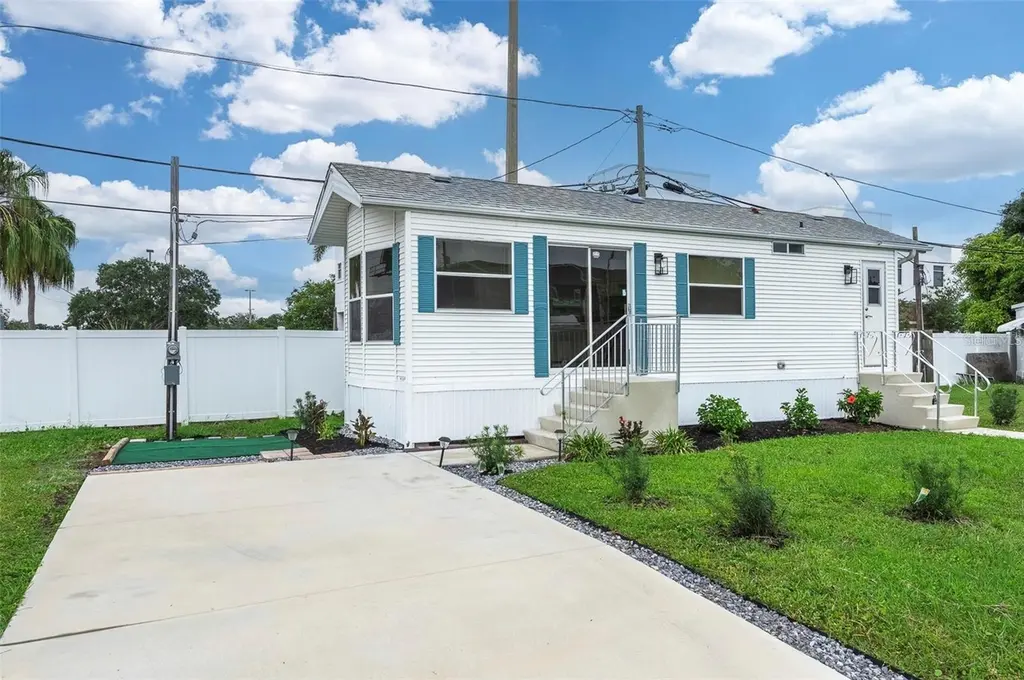
6720 Park Blvd N #1 · Pinellas Park, FL
Flood risk 5/10 · Moderate
- FEMA flood zone
- X (shaded)
- Chance of flooding over 30 yrs
- 0.46%
- Est. flood insurance / yr
- $507 – $1,088
Fire risk 1/10 · Minimal
- Est. fire insurance / yr
- $947 – $1,759
Heat risk 10/10 · Severe
- Hot days now (above 107°F)
- 7 days/yr
- Hot days in 30 yrs
- 25 days/yr
Wind risk 10/10 · Severe
- Chance of severe wind over 30 yrs
- 99.0%
Air-quality risk 4/10 · Minor
- Unhealthy air days now
- 4 days/yr
- Unhealthy air days in 30 yrs
- 4 days/yr
Risk factors via First Street. Map © Google.
Why this score? — see what drove the B- grade
The composite is a weighted blend of 9 inputs, each scored 0–100. Each bar is that input's sub-score; the figure is the points it added to the 100-point composite (weight × sub-score).
- Cash flow +29.2/30.0
- 1% rule +10.0/10.0
- DSCR +10.0/10.0
- ARV discount +7.5/15.0
- Schools +4.3/10.0
- Livability +3.9/5.0
- Condition / age +2.5/5.0
- Rent growth +1.8/5.0
- Appreciation +0.0/10.0
$79,000
🖨 Deal sheet (PDF) 📄 Offer letter ✓ Due diligence
Listing remarks
Charming and affordable manufactured home located in a resident-owned community—perfect for those looking to escape the northern winters and enjoy the Florida lifestyle year-round! This well-maintained home offers low monthly maintenance fees of just $207, which include water, sewer, lawn care, and garbage pickup. Ideally situated just minutes from Largo Mall, Seminole City Center, a variety of restaurants, and both Clearwater and Tampa International Airports, with our beautiful sugar sand beaches only approximately 8 miles away. Owner will consider Owner Financing. This property is located in a no-flood zone and experienced no water damage during recent storms, offering added peace
Key facts
- Manufactured home
- No flood zone
- 6.21 acre lot
Tags
Property features AI
Finance
- Other: Property type: Residential; Property subtype: Manufactured Home; Total lot size: 6.21 acres
- Financial info: Total annual fees: $2,484
- HOA & community: Has HOA with monthly fee of $207; Association contact: Peter Brown; Community features include street lights; Senior community; Pets allowed (max weight 50 lbs)
Exterior
- Parking: Parking available (details not provided)
- Utilities: Public water; Public sewer; Cable available; Electricity available; Water connected
- Home design: Manufactured double-wide home; Single-story; Faces west; Entry level: One
- Construction: Vinyl siding; Shingle roof; Crawlspace foundation with pillar/post/pier
- Exterior features: Exterior lighting; Rain gutters; Asphalt road access
Interior
- Kitchen: Exhaust fan; Microwave; Range; Refrigerator
- Bedrooms: 1 bedroom
- Flooring: Laminate
- Bathrooms: 1 full bathroom
- Heating & cooling: Ductless heating; Mini-split cooling
- Interior features: Ceiling fans; Eat-in kitchen; Kitchen/family room combo; Window treatments
- Laundry & utility: Common area laundry
Neighborhood map
What this means for you Summary
Snapshot
- This is a 1-bed/1.0-bath manufactured listed at $79k.
Deal economics
- At list price, monthly cash flow is $275 ($3k/yr) — positive.
- The deal already cash-flows at list — no discount required.
- Meets the 1% rule at list price ($1k rent vs $79k).
- Recommended offer: $74k (6.0% below list) — sets the bar for market timing.
- Cap rate 10.5% vs local median 4.0% in Pinellas Park — top-decile yield for the area; either an underpriced asset or a hidden risk that comps aren't pricing in. Stress-test before assuming the spread holds.
Location & tenants
- Location reads 78/100 on livability (#170 in FL, #2,546 nationally) — a middle-class / working-renter tenant base. Strengths: commute A+, cost of living A+, housing A+; Watch: employment D+, schools D-, amenities F.
- Pinellas (suburban): math 51% / reading 51% proficiency, ranked #31 of 73 in FL (top 42%) — acceptable for families but not a draw, mixed tenant base, ~2y average lease.
- Market conditions: Rents soft (-3.0%/yr); 226 active listings in the ZIP; 1 comparable units currently listed for rent nearby; 2,676 units permitted in Pinellas County in 2024 (1,422 in 5+ unit buildings).
Forward outlook
- Local home prices are declining (-3.0%/yr); year-one equity from $546 of loan paydown is wiped out by about $2k of value loss. Plan a longer hold.
- Pinellas County population projected at +14% by 2050 — modest demand growth; plan on rents tracking national, not racing it.
Negotiation context
- It's been on market 77 days — a 6% lower offer ($74k) is reasonable based on typical stale-listing flexibility.
- 3 sale attempts since 2y ago with the ask held roughly flat each time — persistent listings suggest the price (not the market) is what's stuck; bring a comps-based counter.
Risks & watch-outs
- Climate carrying-cost: moderate flood risk; severe wind risk, 99% chance of damaging wind over 30y; extreme-heat days projected 7→25/yr by 2055 (HVAC capex compounding) — expect insurance premiums to compound above CPI over the hold.
Questions for the listing agent
- It's been on market 77 days. Have you received any prior offers? Is the seller open to a 6% concession, seller financing, or rate buy-down credit?
- What does the HOA fee cover, when was the last increase, and are there any pending special assessments or reserve-fund shortfalls?
- Why hasn't it sold? Are there any deal-killer items the seller is aware of (foundation, flood, title, zoning, code violations)?
- Is there a deadline driving the sale (1031 exchange, divorce, estate, relocation)? That informs how much negotiation room exists.
- Schools are D-rated, which usually means shorter tenancies and higher turnover. Who's the typical renter profile here, and what's been the actual vacancy rate?
- What's the average days-on-market for RENTAL listings here right now (not sales)? A rising rental-DOM trend means longer vacancies and softer asking-rent achievability than the comps imply.
- What's the recent tenant-quality profile in this submarket — average credit score on applications, eviction rate, late-payment / NSF rate, and stable-employment percentage? A property-management company in the area should have these aggregated.
- How much new for-sale + rental construction is in the pipeline within 1–3 miles? Heavy new supply typically softens prices + rents 12–24 months out; constrained supply supports both.
Investment metrics
- 1% rule
- 1.68% ✓
- Cap rate
- 10.48%
- Cash-on-cash
- 14.94%
- DSCR
- 1.66
- GRM
- 5.0
CMA / ARV
No comps found within radius.
Projected returns pro-forma
-3.0% appreciation · 0.0% rent growth · sell at horizon
- IRR
- 1.3%
- Equity multiple
- 1.05×
- Total profit
- $1,013
- Equity at exit
- $11,779
- IRR
- 6.6%
- Equity multiple
- 1.41×
- Total profit
- $9,105
- Equity at exit
- $6,830
Cash invested: $22,120 (down + closing). Projections, not guarantees.
Landlord ↔ Tenant lean methodology
- Overall (STATE)
- 87 Strongly Landlord-Friendly
- State Florida
- 87 Strongly Landlord-Friendly · R+3
- County
- — inherits STATE
- City
- — inherits STATE
ZIP-level market 33781
- Rents YoY
- -3.0%
- Active inventory
- 226
- Price-to-rent
- 5.0×
Monthly cashflow live
- Estimated rent
- $1,325 medium interval (Pro) →
- Mortgage (P&I)
- −$414
- Tax from tax record
- −$117 /mo · $1,406/yr
- Insurance
- −$33
- HOA
- −$207
- Vacancy / Maint / Mgmt
- −$278
- Net cashflow
- $275
Break-even live
Sensitivity live
| Price | -10% $320 | -5% $298 | +0% $275 | +5% $253 | +10% $231 |
|---|---|---|---|---|---|
| Rent | -10% $171 | -5% $223 | +0% $275 | +5% $328 | +10% $380 |
| Rate | -1.0pp $315 | -0.5pp $295 | base $275 | +0.5pp $255 | +1.0pp $234 |
UW: 25.0% down · 7.5% · 30yr · 1.5% tax · 5.0% vac · 8.0% maint · 8.0% mgmt
Financing live
Cash to close
- Down payment
- $19,750
- Closing costs
- $2,370
- Reserves months
- —
- Total cash needed
- —
Loan-product check · same deal, 3 products live
Conventional
25% down · 7.5% · 30yr
- Down + closing
- —
- Monthly P&I
- —
- Monthly cashflow
- —
- DSCR
- —
- Eligible?
- —
Personal DTI + credit; lowest rate.
DSCR
20% down · 8.5% · 30yr
- Down + closing
- —
- Monthly P&I
- —
- Monthly cashflow
- —
- DSCR
- —
- Eligible?
- —
No personal income docs; deal must DSCR.
Hard money
10% down · 12.0% · 12mo
- Down + closing
- —
- Monthly P&I
- —
- Monthly cashflow
- —
- DSCR
- —
- Eligible?
- —
Short-term bridge; refi at stabilization.
Rent comps 1 comps
| Address | Beds | Baths | Sqft | Rent | $/sqft | DOM | Units | Dist |
|---|---|---|---|---|---|---|---|---|
| 5720 79th Ave Unit B Pinellas Park, FL | — | 1.0 | 276 | $1,200 | $4.35 | 25d | 1 | 1.27mi |
HOA detail
- Monthly dues
- $207 · $2,484/yr
- Likely covers
- watersewertrashlandscaping
Listing history 18 events
-
2026-06-18days on market $79,000 Active 77 DOM
-
2026-06-17days on market $79,000 Active 76 DOM
-
2026-06-16days on market $79,000 Active 75 DOM
-
2026-06-15days on market $79,000 Active 74 DOM
-
2026-06-13days on market $79,000 Active 72 DOM
-
2026-06-09days on market $79,000 Active 68 DOM
-
2026-06-08days on market $79,000 Active 67 DOM
-
2026-06-07days on market $79,000 Active 66 DOM
-
2026-06-04days on market $79,000 Active 63 DOM
-
2026-06-03days on market $79,000 Active 62 DOM
-
2026-06-01days on market $79,000 Active 60 DOM
-
2026-05-31days on market $79,000 Active 59 DOM
-
2026-04-02$79,000 Active
-
2026-02-28historical
-
2026-02-05price $99,900
-
2025-08-30$119,900 Active
-
2025-02-13historical
-
2024-08-23$155,900 Active
ⓘ Source: listings_history table (triggers on properties + properties_extension) + one-shot
backfill from property_details.listing_events for pre-trigger history.
Tax reassessment forecast FL · Resets to sale price
- Current annual tax
- $1,406 · $117/mo
- Projected year-2 tax
- $1,406 · $117/mo
- Expected delta
- $0/yr ($0/mo · 0.0%)
ⓘ Screening estimate from a state-policy table — verify with the county assessor before closing.
Climate risk First Street
- Flood 5/10 Major FEMA zone X (shaded) · 46% chance over 30 yrs
- Wildfire 1/10 Low
- Heat 10/10 Extreme 7 d/yr ≥107°F today · 25 d/yr by 30 yrs out
- Wind 10/10 Extreme 99% chance of damaging wind over 30 yrs
- Air quality 4/10 Moderate 4 unhealthy d/yr today · 4 by 30 yrs out
Nearby sold comps map
Loading sold comps map…
Walkable amenities ~0.75 mi
Loading nearby amenities…
Taxation est. · year 1
- Rental income
- $15,900
- − Mortgage interest
- −$4,425
- − Property taxes
- −$1,406
- − Insurance
- −$395
- − Repairs & maintenance
- −$1,272
- − Management
- −$1,272
- − HOA
- −$2,484
- − Depreciation
- −$2,298
- Taxable income
- $2,348
- Est. tax owed @ 24.0%
- −$563
- After-tax cash flow
- $2,741/yr
For passive investors: Depreciation is non-cash, so a rental often shows a tax loss while cash-flowing — sheltering income. Rental losses are passive: they offset passive income freely, and up to $25,000/yr can offset ordinary (W-2) income if you actively participate and your MAGI is under $100k (phasing out to $0 by $150k); unused losses carry forward. On sale, claimed depreciation is recaptured at up to 25%, and gains may owe capital-gains tax (a 1031 exchange can defer both). Figures are a year-1 estimate at your 24.0% rate — not tax advice; consult a CPA.
Schools (NCES district)
- District
- Pinellas
- NCES district ID
- 1201560
- Math proficiency
- 51% ▼ -5.00%
- Reading proficiency
- 51% ▼ -3.00%
- Median HH income
- $46,270
- Composite
- 43.27/100
- National rank
- #3046
- State rank
- #31 of 73 in FL
Livability — Pinellas Park
- Score
- 78/100
- State rank
- #170
- US rank
- #2546
Category grades
Schools grade is shown separately in the Schools card above.
Census & demographics
- Census place
- Pinellas Park, FL
- County
- Pinellas County · 939,478 people
- City population
- 50,533
- Metro
- Tampa-St. Petersburg-Clearwater, FL
- Population (ZIP)
- 28,072
- Household income
- $57,785
- Rent vs Own
- Severe rent burden
- 1115.0
Population outlook (Pinellas County) Hauer SSP2
- Today (2025)
- 1,027,532 people
- By 2030
- 1,063,586 · +3.5%
- By 2040
- 1,125,020 · +9.5%
- By 2050
- 1,168,637 · +13.7%
- By 2075
- 1,265,188 · +23.1%
- By 2100
- 1,260,357 · +22.7%
Race, ethnicity, and origin ACS 2023
- Neighborhood character
- Diverse neighborhood (Simpson 0.60)
- Race & ethnicity
- White 59% Hispanic / Latino 16% Asian 14% Two or more races 11% Black 7%
- Hispanic origin (detail)
- Mexican 2% Puerto Rican 6% Cuban 5%
- Common ancestry
- Romanian 3% Lithuanian 3% Slovak 2%
- Foreign-born
- 18% · Canada, Vietnam, Jamaica
- Languages at home
- 72% English-only · Spanish 12% Vietnamese 7% Other Asian/Pacific 3%
Political lean MEDSL · Pinellas
- 2024 margin
- Lean R (+5.2) · D 46.9% · R 52.1%
- 2008→2024 swing
- -13.5pp toward R · 2008: 8.3pp · 2024: -5.2pp
- All cycles
- 2024: R+5.2 2020: D+0.2 2016: R+1.1 2012: D+5.6 2008: D+8.3
Not yet ingested
- Civics
- —
Market trends
- HPI YoY
- ▼ -409.77%
- Current HPI
- 348.546
- Rent YoY
- ▼ -2.95%
- Metro
- Tampa-St. Petersburg-Clearwater, FL
- State GDP YoY
- ▲ 3.28%
- F500 in state
- 36
Industry mix (Fortune 500 HQ in FL)
| Industry | F500 HQs | Revenue |
|---|---|---|
| Industrial Technology | 2 | $29B |
|
||
| Insurance | 2 | $17B |
|
||
| Retail | 1 | $60B |
|
||
| Technology Distribution | 1 | $58B |
|
||
| Homebuilding | 1 | $35B |
|
||
| Technology Manufacturing | 1 | $35B |
|
||
Price history
-49.3% since first listed6 events — show timeline
- 2026-04-02 Listed $79,000 Stellar MLS as Distributed by MLS Grid
- 2026-02-28 Listing Removed — Stellar MLS as Distributed by MLS Grid
- 2026-02-05 Price Changed $99,900 Stellar MLS as Distributed by MLS Grid
- 2025-08-30 Listed $119,900 Stellar MLS as Distributed by MLS Grid
- 2025-02-13 Listing Removed — Stellar MLS as Distributed by MLS Grid
- 2024-08-23 Listed $155,900 Stellar MLS as Distributed by MLS Grid
Property tax history
+10.7%/yrLatest (2025): $1,406 · +226.3% YoY. Source: county tax records.
Cash-flow waterfall
monthlySold comps — $/sqft
last 12 mo · ≤1 miLoading sold comps…