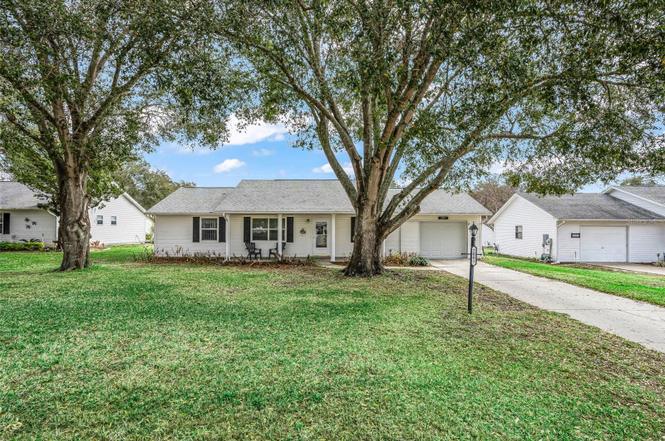
2003 Tweed Ct · Silver Lake, FL
Flood risk 1/10 · Minimal
- FEMA flood zone
- X (unshaded)
- Chance of flooding over 30 yrs
- 0.0%
- Est. flood insurance / yr
- $507 – $1,088
Fire risk 2/10 · Minimal
- Est. fire insurance / yr
- $947 – $1,759
Heat risk 8/10 · Major
- Hot days now (above 107°F)
- 7 days/yr
- Hot days in 30 yrs
- 22 days/yr
Wind risk 9/10 · Severe
- Chance of severe wind over 30 yrs
- 99.0%
Air-quality risk 2/10 · Minimal
- Unhealthy air days now
- 1 days/yr
- Unhealthy air days in 30 yrs
- 1 days/yr
Risk factors via First Street. Map © Google.
Why this score? — see what drove the D- grade
The composite is a weighted blend of 9 inputs, each scored 0–100. Each bar is that input's sub-score; the figure is the points it added to the 100-point composite (weight × sub-score).
- Cash flow +11.1/30.0
- ARV discount +7.5/15.0
- Schools +4.2/10.0
- 1% rule +3.8/10.0
- DSCR +3.2/10.0
- Livability +3.2/5.0
- Rent growth +2.5/5.0
- Condition / age +2.5/5.0
- Appreciation +0.0/10.0
$199,500
🖨 Deal sheet (PDF) 📄 Offer letter ✓ Due diligence
Listing remarks
NEW IMPROVED PRICE!! MOVE IN READY!! HIGHLANDS 55+ COMMUNITY WITH LOADS OF ACTIVITIES TO CHOOSE FROM. PRIDE OF OWNERSHIP WITH THIS 2/2 WELLINGTON II SPLIT PLAN HOME WITH LOADS OF UPDATES. LOCATED ON A DEAD END STREET. ROOF 2019, WATER HEATER REPLACED 2023, WASHER AND DRYER 2018. ALL FLOORS ARE TILE PLANK AND VINYL PLANK IN FAMILY ROOM. NO CARPET. Large living room with cathedral ceilings opens on to dining room area with sliders to glassed in Florida Room. KITCHEN HAS BEEN UPDATED WITH CABINETS REFACED, UPGRADED GRANITE-LOOK COUNTERTOPS, AND WHITE APPLIANCES. PANTRY CLOSET. Primary bedroom with en-suite with upgraded cabinets and countertops, updated walk-in shower with glass door. 10
Key facts
- Guest bath
- En-suite
- Updated kitchen
Tags
Property features AI
Finance
- Other: Condo land included; Property is zoned RES (residential)
- Financial info: Total monthly fees reported as $215; total annual fees reported as $2,580; Lease restrictions apply
- HOA & community: Has HOA (Association name: Rene/Denise) — monthly fee $215; HOA fee includes cable TV, common area taxes, pool, escrow reserves, fidelity bond, internet, management, private road, recreational facilities, and sewer; Association amenities: clubhouse, recreation facilities, tennis courts, pickleball courts, shuffleboard, spa/hot tub, storage; Association approval required; On-site property manager; Community features include deed restrictions, buyer approval required, clubhouse, golf carts allowed, tennis courts; Pets allowed; Senior community
Exterior
- Parking: Attached oversized garage (14x26) — 1 garage space
- Utilities: Public water; Private sewer; Cable connected; Electricity connected; Natural gas connected; Sewer connected; Underground utilities; Water connected
- Home design: Single family residence; One story; West-facing
- Construction: Vinyl siding and frame construction; Shingle roof; Slab foundation; Built by PRINGLE
- Exterior features: Covered front porch; Porch; Rain gutters; Sliding doors; Mature landscaping; Level lot; Street dead-end; Private maintained road; Asphalt road surface
Interior
- Kitchen: Dishwasher; Disposal; Microwave; Range; Refrigerator; Eat-in kitchen
- Bedrooms: 2 bedrooms
- Flooring: Ceramic tile; Vinyl
- Bathrooms: 2 full bathrooms
- Heating & cooling: Central heating; Central air conditioning
- Interior features: Cathedral ceilings; Ceiling fans; Eat-in kitchen; Open floorplan; Split bedroom layout; Walk-in closets; Window treatments
- Laundry & utility: Washer and dryer included; Laundry area in garage; Gas water heater
Neighborhood map
What this means for you Summary
Snapshot
- This is a 2-bed/2.0-bath condo listed at $200k.
Deal economics
- At list price, monthly cash flow is $-81 ($-973/yr) — negative.
- To cash-flow at today's rent, offer at most $185k (7.2% below list).
- To meet the 1% rule (rent ≥ 1% of price), the offer needs to be $175k (12.3% below list).
- Recommended offer: $175k (12.3% below list) — sets the bar for 1% rule.
Location & tenants
- Location reads 65/100 on livability (#644 in FL) — a middle-class / working-renter tenant base. Strengths: crime A+, housing A+, cost of living A; Watch: amenities F, commute F, health & safety F.
- Lake (suburban): math 49% / reading 50% proficiency, ranked #37 of 73 in FL (top 51%) — families likely to look elsewhere, expect single-tenant / working-renter base with shorter leases.
- Zoned schools: Treadway Elementary School (math 53% / reading 48%, grade D+, #1,055 of 2,144 statewide, top 50%, 879 students, 66% FRL); Tavares Middle School (math 43% / reading 40%, grade F, #348 of 571 statewide, top 62%, 1,070 students, 58% FRL); Tavares High School (math 32% / reading 40%, grade F, #359 of 667 statewide, top 55%, 1,507 students, 45% FRL).
- Market conditions: 288 active listings in the ZIP; 1 comparable units currently listed for rent nearby; 4,799 units permitted in Lake County in 2024 (814 in 5+ unit buildings).
- This rent runs 39% of the median local income ($54k/yr) — at the standard rent-burdened threshold; future hikes will face affordability resistance.
Forward outlook
- Local home prices are declining (-3.0%/yr); year-one equity from $1k of loan paydown is wiped out by about $6k of value loss. Plan a longer hold.
- Lake County population projected at +37% by 2050 — long-run rental-demand tailwind backs the buy-and-hold thesis.
Negotiation context
- It's been on market 77 days — a 6% lower offer ($188k) is reasonable based on typical stale-listing flexibility.
- 2 sale attempts since 22y ago; this cycle's ask has dropped $16k (7%) from the opening price — seller is motivated, your offer sets the floor, not the list.
- Current owner paid $105k; list at $200k implies a 90% gain — meaningful room to come down on a strong offer.
Risks & watch-outs
- Climate carrying-cost: severe wind risk, 99% chance of damaging wind over 30y; extreme-heat days projected 7→22/yr by 2055 (HVAC capex compounding) — expect insurance premiums to compound above CPI over the hold.
Questions for the listing agent
- What do current leases actually rent for vs. the listed asking? Can we see a recent rent roll and the last 12 months of T-12 income?
- It's been on market 77 days. Have you received any prior offers? Is the seller open to a 12% concession, seller financing, or rate buy-down credit?
- What does the HOA fee cover, when was the last increase, and are there any pending special assessments or reserve-fund shortfalls?
- Any open or pending special assessments — roof, HVAC, plumbing, elevator, façade? What's the per-unit balance and payoff schedule, and is the seller paying it off at close or rolling it to the buyer?
- Why hasn't it sold? Are there any deal-killer items the seller is aware of (foundation, flood, title, zoning, code violations)?
- Is there a deadline driving the sale (1031 exchange, divorce, estate, relocation)? That informs how much negotiation room exists.
- Schools are F-rated, which usually means shorter tenancies and higher turnover. Who's the typical renter profile here, and what's been the actual vacancy rate?
- The area grade is low — what's the realistic commute time and amenity access for the typical tenant pool here? Any planned neighborhood developments (good or bad) we should know about?
- What's the average days-on-market for RENTAL listings here right now (not sales)? A rising rental-DOM trend means longer vacancies and softer asking-rent achievability than the comps imply.
- What's the recent tenant-quality profile in this submarket — average credit score on applications, eviction rate, late-payment / NSF rate, and stable-employment percentage? A property-management company in the area should have these aggregated.
- How much new apartment / multifamily construction is in the pipeline within 1–3 miles? Heavy new supply (>2% of stock underway) typically softens rents 12–24 months out; light construction supports rent growth.
Investment metrics
- 1% rule
- 0.88% ✗
- Cap rate
- 5.81%
- Cash-on-cash
- -1.74%
- DSCR
- 0.92
- GRM
- 9.5
CMA / ARV
No comps found within radius.
Projected returns pro-forma
-3.0% appreciation · 3.0% rent growth · sell at horizon
- IRR
- -19.1%
- Equity multiple
- 0.33×
- Total profit
- $-37,412
- Equity at exit
- $29,746
- IRR
- -11.6%
- Equity multiple
- 0.30×
- Total profit
- $-38,907
- Equity at exit
- $17,249
Cash invested: $55,860 (down + closing). Projections, not guarantees.
Landlord ↔ Tenant lean methodology
- Overall (STATE)
- 87 Strongly Landlord-Friendly
- State Florida
- 87 Strongly Landlord-Friendly · R+3
- County
- — inherits STATE
- City
- — inherits STATE
ZIP-level market 34788
- Home prices YoY
- -18.2%
- Active inventory
- 288
- Price-to-rent
- 9.5×
Monthly cashflow live
- Estimated rent
- $1,749 medium interval (Pro) →
- Mortgage (P&I)
- −$1,046
- Tax from tax record
- −$119 /mo · $1,424/yr
- Insurance
- −$83
- HOA
- −$215
- Vacancy / Maint / Mgmt
- −$367
- Net cashflow
- $-81
Break-even live
Sensitivity live
| Price | -10% $32 | -5% $-25 | +0% $-81 | +5% $-138 | +10% $-194 |
|---|---|---|---|---|---|
| Rent | -10% $-219 | -5% $-150 | +0% $-81 | +5% $-12 | +10% $57 |
| Rate | -1.0pp $19 | -0.5pp $-30 | base $-81 | +0.5pp $-133 | +1.0pp $-185 |
UW: 25.0% down · 7.5% · 30yr · 1.5% tax · 5.0% vac · 8.0% maint · 8.0% mgmt
Financing live
Cash to close
- Down payment
- $49,875
- Closing costs
- $5,985
- Reserves months
- —
- Total cash needed
- —
Loan-product check · same deal, 3 products live
Conventional
25% down · 7.5% · 30yr
- Down + closing
- —
- Monthly P&I
- —
- Monthly cashflow
- —
- DSCR
- —
- Eligible?
- —
Personal DTI + credit; lowest rate.
DSCR
20% down · 8.5% · 30yr
- Down + closing
- —
- Monthly P&I
- —
- Monthly cashflow
- —
- DSCR
- —
- Eligible?
- —
No personal income docs; deal must DSCR.
Hard money
10% down · 12.0% · 12mo
- Down + closing
- —
- Monthly P&I
- —
- Monthly cashflow
- —
- DSCR
- —
- Eligible?
- —
Short-term bridge; refi at stabilization.
Rent comps 1 comps
| Address | Beds | Baths | Sqft | Rent | $/sqft | DOM | Units | Dist |
|---|---|---|---|---|---|---|---|---|
| 35 Aberdeen Cir Leesburg, FL | 2.0 | 2.0 | 1072 | $1,400 | $1.31 | 25d | 1 | 0.44mi |
HOA detail condo
- Monthly dues
- $215 · $2,580/yr
- Likely covers
- water
- Assessments
- None detected in remarks — confirm with the listing agent.
Listing history 8 events
-
2026-05-08status Pending
-
2026-04-09price $199,500
-
2026-03-19price $205,000
-
2026-03-10price $210,000
-
2026-02-20$215,000 Active
-
2004-08-19soldstatus $105,000
-
2004-08-18soldstatus $105,000
-
2004-07-12$110,000
ⓘ Source: listings_history table (triggers on properties + properties_extension) + one-shot
backfill from property_details.listing_events for pre-trigger history.
Tax reassessment forecast FL · Resets to sale price
- Current annual tax
- $1,424 · $119/mo
- Projected year-2 tax
- $1,656 · $138/mo
- Expected delta
- +$232/yr (+$19/mo · 16.3%)
ⓘ Screening estimate from a state-policy table — verify with the county assessor before closing.
Climate risk First Street
- Flood 1/10 Low FEMA zone X (unshaded) · 0% chance over 30 yrs
- Wildfire 2/10 Low
- Heat 8/10 Severe 7 d/yr ≥107°F today · 22 d/yr by 30 yrs out
- Wind 9/10 Extreme 99% chance of damaging wind over 30 yrs
- Air quality 2/10 Low 1 unhealthy d/yr today · 1 by 30 yrs out
Nearby sold comps map
Loading sold comps map…
Walkable amenities ~0.75 mi
Loading nearby amenities…
Taxation est. · year 1
- Rental income
- $20,992
- − Mortgage interest
- −$11,175
- − Property taxes
- −$1,424
- − Insurance
- −$998
- − Repairs & maintenance
- −$1,679
- − Management
- −$1,679
- − HOA
- −$2,580
- − Depreciation
- −$5,804
- Taxable loss
- −$4,347
- Est. tax savings @ 24.0%
- +$1,043
- After-tax cash flow
- $71/yr
For passive investors: Depreciation is non-cash, so a rental often shows a tax loss while cash-flowing — sheltering income. Rental losses are passive: they offset passive income freely, and up to $25,000/yr can offset ordinary (W-2) income if you actively participate and your MAGI is under $100k (phasing out to $0 by $150k); unused losses carry forward. On sale, claimed depreciation is recaptured at up to 25%, and gains may owe capital-gains tax (a 1031 exchange can defer both). Figures are a year-1 estimate at your 24.0% rate — not tax advice; consult a CPA.
Schools (NCES district)
- District
- Lake
- NCES district ID
- 1201050
- Math proficiency
- 49% ▼ -7.00%
- Reading proficiency
- 50% ▼ -4.00%
- Median HH income
- $46,632
- Composite
- 42.05/100
- National rank
- #3327
- State rank
- #37 of 73 in FL
Livability — Silver Lake
- Score
- 65/100
- State rank
- #644
- US rank
- #12722
Category grades
Schools grade is shown separately in the Schools card above.
Census & demographics
- County
- Lake County · 364,602 people
- Metro
- Orlando-Kissimmee-Sanford, FL
- Population (ZIP)
- 22,137
- Household income
- $54,147
- Rent vs Own
- Severe rent burden
- 406.0
Population outlook (Lake County) Hauer SSP2
- Today (2025)
- 386,640 people
- By 2030
- 417,107 · +7.9%
- By 2040
- 476,676 · +23.3%
- By 2050
- 531,296 · +37.4%
- By 2075
- 648,303 · +67.7%
- By 2100
- 698,530 · +80.7%
Race, ethnicity, and origin ACS 2023
- Neighborhood character
- Predominantly White (79%)
- Race & ethnicity
- White 79% Hispanic / Latino 12% Two or more races 7% Black 5% Asian 1%
- Hispanic origin (detail)
- Mexican 3% Puerto Rican 6%
- Common ancestry
- Romanian 4% Lithuanian 3% Slovak 2%
- Foreign-born
- 5% · Canada, South Korea
- Languages at home
- 88% English-only · Spanish 9% German/W. Germanic 1% Tagalog/Filipino 1%
Political lean MEDSL · Lake
- 2024 margin
- Strong R (+24.7) · D 37.3% · R 62.0%
- 2008→2024 swing
- -11.2pp toward R · 2008: -13.5pp · 2024: -24.7pp
- All cycles
- 2024: R+24.7 2020: R+20.0 2016: R+23.1 2012: R+17.1 2008: R+13.5
Not yet ingested
- Civics
- —
Market trends
- HPI YoY
- ▼ -61.07%
- Current HPI
- 273.6616
- Rent YoY
- —
- Metro
- Orlando-Kissimmee-Sanford, FL
- State GDP YoY
- ▲ 3.28%
- F500 in state
- 36
Industry mix (Fortune 500 HQ in FL)
| Industry | F500 HQs | Revenue |
|---|---|---|
| Industrial Technology | 2 | $29B |
|
||
| Insurance | 2 | $17B |
|
||
| Retail | 1 | $60B |
|
||
| Technology Distribution | 1 | $58B |
|
||
| Homebuilding | 1 | $35B |
|
||
| Technology Manufacturing | 1 | $35B |
|
||
Price history
+81.4% since first listed8 events — show timeline
- 2026-05-08 Pending — Stellar MLS as Distributed by MLS Grid
- 2026-04-09 Price Changed $199,500 Stellar MLS as Distributed by MLS Grid
- 2026-03-19 Price Changed $205,000 Stellar MLS as Distributed by MLS Grid
- 2026-03-10 Price Changed $210,000 Stellar MLS as Distributed by MLS Grid
- 2026-02-20 Listed $215,000 Stellar MLS as Distributed by MLS Grid
- 2004-08-19 Sold (Public Records) $105,000 Public Records
- 2004-08-18 Sold (MLS) $105,000 Stellar MLS as Distributed by MLS Grid
- 2004-07-12 Listed $110,000 Stellar MLS as Distributed by MLS Grid
Property tax history
+8.8%/yrLatest (2025): $1,424 · +3.9% YoY. Source: county tax records.
Cash-flow waterfall
monthlySold comps — $/sqft
last 12 mo · ≤1 miLoading sold comps…