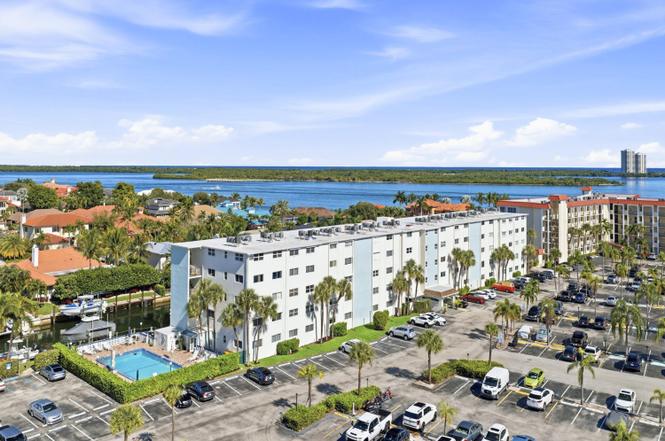
 🌊 Lakefront
109 Paradise Harbour Blvd #415 · North Palm Beach, FL
Flood risk 7/10 · Major
- FEMA flood zone
- X (shaded)
- Chance of flooding over 30 yrs
- 0.91%
- Est. flood insurance / yr
- $507 – $1,088
Fire risk 3/10 · Minor
- Est. fire insurance / yr
- $947 – $1,759
Heat risk 10/10 · Severe
- Hot days now (above 105°F)
- 7 days/yr
- Hot days in 30 yrs
- 25 days/yr
Wind risk 10/10 · Severe
- Chance of severe wind over 30 yrs
- 99.0%
Air-quality risk 2/10 · Minimal
- Unhealthy air days now
- 0 days/yr
- Unhealthy air days in 30 yrs
- 1 days/yr
Risk factors via First Street. Map © Google.
Why this score? — see what drove the C+ grade
The composite is a weighted blend of 9 inputs, each scored 0–100. Each bar is that input's sub-score; the figure is the points it added to the 100-point composite (weight × sub-score).
- Cash flow +23.8/30.0
- 1% rule +10.0/10.0
- DSCR +7.7/10.0
- ARV discount +7.5/15.0
- Schools +4.3/10.0
- Livability +3.9/5.0
- Rent growth +2.6/5.0
- Condition / age +2.5/5.0
- Appreciation +0.0/10.0
$249,900
🖨 Deal sheet 📄 Offer letter ✓ Due diligence
Listing remarks
Fully renovated 2BR, 2 bath Condo. New laminate floors, kitchen, newer AC, screened patio and door. Located in the Village of North Palm Beach and close to restaurants, shopping and I-95. Concrete and roof repairs complete per the Structural Integrity Reserve Study.
Key facts
- Screened patio
- Close to restaurants
- Close to i-95
Tags
Property features AI
Finance
- HOA & community: Monthly association fee (includes insurance, water, sewer); Association amenities: Boating, Elevator(s), Laundry, Pool, Storage, Trash chute, Sidewalks; Pets not allowed
Exterior
- Parking: Assigned parking; 1 open parking space
- Security: Fire alarm; Smoke detectors
- Utilities: Public water; Public sewer; Three-phase electric; Cable available
- Home design: Condominium; Resale unit; Faces southeast; 5-story building
- Construction: Concrete/Stucco/CBS construction
- Exterior features: Intracoastal waterfront
Interior
- Kitchen: Disposal; Dishwasher; Electric range; Microwave; Refrigerator; Electric water heater
- Bedrooms: 2 bedrooms on the main level
- Flooring: Ceramic tile; Laminate
- Bathrooms: 2 full bathrooms on the main level
- Heating & cooling: Electric heating (central individual); Central individual cooling; Exhaust fan; Paddle fan(s)
- Interior features: Walk-in closets; Partially furnished
- Laundry & utility: Building laundry available
Neighborhood map
What this means for you Summary
Snapshot
- This is a 2-bed/2.0-bath condo listed at $250k.
Deal economics
- At list price, monthly cash flow is $413 ($5k/yr) — positive.
- The deal already cash-flows at list — no discount required.
- Meets the 1% rule at list price ($4k rent vs $250k).
- Recommended offer: $220k (12.0% below list) — sets the bar for market timing.
Location & tenants
- Location reads 77/100 on livability (#184 in FL, #2,894 nationally) — a middle-class / working-renter tenant base. Strengths: crime A+, employment A+, housing A+; Watch: amenities F, commute F, cost of living D-.
- Palm Beach (suburban): math 46% / reading 53% proficiency, ranked #34 of 73 in FL (top 47%) — families likely to look elsewhere, expect single-tenant / working-renter base with shorter leases.
- Market conditions: Rents flat; 400 active listings in the ZIP; 10 comparable units currently listed for rent nearby; rentals at typical pace (median 24d on market — plan ~3-4 weeks tenant-placement turnaround); solid renter incomes; 3,974 units permitted in Palm Beach County in 2024 (1,012 in 5+ unit buildings).
- At $4,061/mo this rent would consume 53% of the median local household income ($92k/yr) (locally 835% of renters already pay >50% of income on rent) — very limited rent-growth headroom before tenants either downsize or default.
Forward outlook
- Local home prices are declining (-3.0%/yr); year-one equity from $2k of loan paydown is wiped out by about $7k of value loss. Plan a longer hold.
- Palm Beach County population projected at +30% by 2050 — long-run rental-demand tailwind backs the buy-and-hold thesis.
Negotiation context
- It's been on market 238 days — a 12% lower offer ($220k) is reasonable based on typical stale-listing flexibility.
- 2 sale attempts; this cycle's ask has dropped $235k (48%) from the opening price — seller is motivated, your offer sets the floor, not the list.
- Current owner paid $68k; list at $250k implies a 270% gain — meaningful room to come down on a strong offer.
Risks & watch-outs
- Watch-outs: flood insurance adds $66/mo; HOA is 24% of rent.
- Climate carrying-cost: major flood risk; severe wind risk, 99% chance of damaging wind over 30y; extreme-heat days projected 7→25/yr by 2055 (HVAC capex compounding) — expect insurance premiums to compound above CPI over the hold.
Questions for the listing agent
- It's been on market 238 days. Have you received any prior offers? Is the seller open to a 12% concession, seller financing, or rate buy-down credit?
- Built in 1974 — when were the roof, HVAC, electrical panel, plumbing, and water heater last replaced?
- What's the actual annual flood-insurance premium (NFIP or private), and is the property in a SFHA with mandatory coverage?
- What does the HOA fee cover, when was the last increase, and are there any pending special assessments or reserve-fund shortfalls?
- Any open or pending special assessments — roof, HVAC, plumbing, elevator, façade? What's the per-unit balance and payoff schedule, and is the seller paying it off at close or rolling it to the buyer?
- Why hasn't it sold? Are there any deal-killer items the seller is aware of (foundation, flood, title, zoning, code violations)?
- Is there a deadline driving the sale (1031 exchange, divorce, estate, relocation)? That informs how much negotiation room exists.
- Schools are A-rated — typically a magnet for longer-tenancy family renters. What's the average tenant stay here, and is there a school-zone premium baked into asking?
- This sits on a lake — are riparian / water-frontage rights deeded with the parcel? Any dock permits, shoreline easements, or HOA water-use restrictions?
- What's the documented flood / surge / shoreline-erosion history here (FEMA AND non-FEMA — e.g., storm surge, creek backup, septic-field saturation)?
- Any water-quality or seasonal algae-bloom issues that affect tenant satisfaction or short-term-rental demand?
- What's the average days-on-market for RENTAL listings here right now (not sales)? A rising rental-DOM trend means longer vacancies and softer asking-rent achievability than the comps imply.
- What's the recent tenant-quality profile in this submarket — average credit score on applications, eviction rate, late-payment / NSF rate, and stable-employment percentage? A property-management company in the area should have these aggregated.
- How much new apartment / multifamily construction is in the pipeline within 1–3 miles? Heavy new supply (>2% of stock underway) typically softens rents 12–24 months out; light construction supports rent growth.
Investment metrics
- 1% rule
- 1.63% ✓
- Cap rate
- 8.60%
- Cash-on-cash
- 8.23%
- DSCR
- 1.37
- GRM
- 5.1
CMA / ARV
No comps found within radius.
Projected returns pro-forma
-3.0% appreciation · 0.27% rent growth · sell at horizon
- IRR
- -9.9%
- Equity multiple
- 0.65×
- Total profit
- $-24,304
- Equity at exit
- $37,261
- IRR
- -7.3%
- Equity multiple
- 0.62×
- Total profit
- $-26,533
- Equity at exit
- $21,607
Cash invested: $69,972 (down + closing). Projections, not guarantees.
Landlord ↔ Tenant lean methodology
- Overall (STATE)
- 87 Strongly Landlord-Friendly
- State Florida
- 87 Strongly Landlord-Friendly · R+3
- County
- — inherits STATE
- City
- — inherits STATE
ZIP-level market 33408
- Rents YoY
- 0.3%
- Active inventory
- 400
- Price-to-rent
- 5.1×
Monthly cashflow live
- Estimated rent
- $4,061 high interval (Pro) →
- Mortgage (P&I)
- −$1,311
- Tax from tax record
- −$357 /mo · $4,282/yr
- Insurance
- −$104
- Flood insurance flood zone
- −$66 /mo · $798/yr
- HOA
- −$957
- Vacancy / Maint / Mgmt
- −$853
- Net cashflow
- $413
Break-even live
UW: 25.0% down · 7.5% · 30yr · 1.5% tax · 5.0% vac · 8.0% maint · 8.0% mgmt
Financing live
Cash to close
- Down payment
- $62,475
- Closing costs
- $7,497
- Reserves months
- —
- Total cash needed
- —
Loan-product check · same deal, 3 products live
Conventional
25% down · 7.5% · 30yr
- Down + closing
- —
- Monthly P&I
- —
- Monthly cashflow
- —
- DSCR
- —
- Eligible?
- —
Personal DTI + credit; lowest rate.
DSCR
20% down · 8.5% · 30yr
- Down + closing
- —
- Monthly P&I
- —
- Monthly cashflow
- —
- DSCR
- —
- Eligible?
- —
No personal income docs; deal must DSCR.
Hard money
10% down · 12.0% · 12mo
- Down + closing
- —
- Monthly P&I
- —
- Monthly cashflow
- —
- DSCR
- —
- Eligible?
- —
Short-term bridge; refi at stabilization.
Rent comps 10 comps
| Address | Beds | Baths | Sqft | Rent | $/sqft | DOM | Units | Dist |
|---|---|---|---|---|---|---|---|---|
| 524 Eastwind Dr Unit 524 North Palm Beach, FL | 2.0 | 1.0 | 774 | $3,995 | $5.16 | 24d | 1 | 0.29mi |
| 522 Eastwind Dr North Palm Beach, FL | 2.0 | 2.0 | 948 | $3,995 | $4.21 | 24d | 1 | 0.29mi |
| 526 Eastwind Dr Unit 526 North Palm Beach, FL | 2.0 | 1.0 | 840 | $3,995 | $4.76 | 24d | 1 | 0.30mi |
| 913 Lake Shore Dr Lake Park, FL | 1.0–2.0 | 1.0–2.0 | 1066 | $3,731 | $3.50 | 2d | 9 | 0.61mi |
| 308 Southwind Ct Unit 8 North Palm Beach, FL | 2.0 | 2.0 | 1100 | $2,900 | $2.64 | 24d | 1 | 0.75mi |
| 624 Southwind Cir #2 North Palm Beach, FL | 2.0 | 2.0 | 718 | $3,750 | $5.22 | 24d | 1 | 0.81mi |
| 220 Lake Shore Dr Lake Park, FL | 1.0–3.0 | 1.5–3.5 | 1575 | $14,498 | $9.20 | 4d | 18 | 1.09mi |
| 5400 N Ocean Dr Riviera Beach, FL | 1.0–2.0 | 1.0–2.0 | 1300 | $6,500 | $5.00 | 21d | 3 | 1.20mi |
| 2545 Conroy Dr West Palm Beach, FL | 3.0 | 2.0 | 1066 | $3,295 | $3.09 | 24d | 1 | 1.27mi |
| 20 Yacht Club Dr #405 North Palm Beach, FL | 2.0 | 2.0 | 1010 | $3,000 | $2.97 | 24d | 1 | 1.33mi |
HOA detail condo
- Monthly dues
- $957 · $11,484/yr
- Likely covers
- roof
- Assessments
- None detected in remarks — confirm with the listing agent.
Listing history 23 events
-
2026-06-18days on market $249,900 Active 238 DOM
-
2026-06-17days on market $249,900 Active 237 DOM
-
2026-06-16days on market $249,900 Active 236 DOM
-
2026-06-15days on market $249,900 Active 235 DOM
-
2026-06-13days on market $249,900 Active 233 DOM
-
2026-06-09days on market $249,900 Active 229 DOM
-
2026-06-07days on market $249,900 Active 227 DOM
-
2026-06-04days on market $249,900 Active 224 DOM
-
2026-06-03days on market $249,900 Active 223 DOM
-
2026-06-02price $249,900 Active 221 DOM
-
2026-06-01days on market $265,000 Active 221 DOM
-
2026-05-31days on market $265,000 Active 220 DOM
-
2026-04-23price $265,000
-
2026-04-17price $275,000
-
2026-04-03price $299,999
-
2026-04-03price $315,999
-
2026-03-20price $399,999
-
2026-02-16price $419,900
-
2026-01-04status Active
-
2026-01-02historical
-
2025-11-10price $449,900
-
2025-10-20$485,000 Active
-
1985-11-01soldstatus $67,500
ⓘ Source: listings_history table (triggers on properties + properties_extension) + one-shot
backfill from property_details.listing_events for pre-trigger history.
Tax reassessment forecast FL · Resets to sale price
- Current annual tax
- $4,282 · $357/mo
- Projected year-2 tax
- $4,282 · $357/mo
- Expected delta
- $0/yr ($0/mo · 0.0%)
ⓘ Screening estimate from a state-policy table — verify with the county assessor before closing.
Climate risk First Street
- Flood 7/10 Severe FEMA zone X (shaded) · 91% chance over 30 yrs
- Wildfire 3/10 Moderate
- Heat 10/10 Extreme 7 d/yr ≥105°F today · 25 d/yr by 30 yrs out
- Wind 10/10 Extreme 99% chance of damaging wind over 30 yrs
- Air quality 2/10 Low 0 unhealthy d/yr today · 1 by 30 yrs out
Nearby sold comps map
Loading sold comps map…
Walkable amenities ~0.75 mi
Loading nearby amenities…
Taxation est. · year 1
- Rental income
- $48,735
- − Mortgage interest
- −$13,998
- − Property taxes
- −$4,282
- − Insurance
- −$2,047
- − Repairs & maintenance
- −$3,899
- − Management
- −$3,899
- − HOA
- −$11,484
- − Depreciation
- −$7,270
- Taxable income
- $1,856
- Est. tax owed @ 24.0%
- −$445
- After-tax cash flow
- $4,516/yr
For passive investors: Depreciation is non-cash, so a rental often shows a tax loss while cash-flowing — sheltering income. Rental losses are passive: they offset passive income freely, and up to $25,000/yr can offset ordinary (W-2) income if you actively participate and your MAGI is under $100k (phasing out to $0 by $150k); unused losses carry forward. On sale, claimed depreciation is recaptured at up to 25%, and gains may owe capital-gains tax (a 1031 exchange can defer both). Figures are a year-1 estimate at your 24.0% rate — not tax advice; consult a CPA.
Schools (NCES district)
- District
- Palm Beach
- NCES district ID
- 1201500
- Math proficiency
- 46% ▼ -16.00%
- Reading proficiency
- 53% ▼ -4.00%
- Median HH income
- $53,943
- Composite
- 42.72/100
- National rank
- #3160
- State rank
- #34 of 73 in FL
Livability — North Palm Beach
- Score
- 77/100
- State rank
- #184
- US rank
- #2894
Category grades
Schools grade is shown separately in the Schools card above.
Census & demographics
- Census place
- North Palm Beach, FL
- County
- Palm Beach County · 1,438,312 people
- City population
- 18,817
- Metro
- Miami-Fort Lauderdale-Pompano Beach, FL
- Population (ZIP)
- 18,817
- Household income
- $92,216
- Rent vs Own
- Severe rent burden
- 835.0
Population outlook (Palm Beach County) Hauer SSP2
- Today (2025)
- 1,637,487 people
- By 2030
- 1,743,255 · +6.5%
- By 2040
- 1,948,712 · +19.0%
- By 2050
- 2,132,979 · +30.3%
- By 2075
- 2,530,027 · +54.5%
- By 2100
- 2,706,979 · +65.3%
Race, ethnicity, and origin ACS 2023
- Neighborhood character
- Predominantly White (86%)
- Race & ethnicity
- White 86% Hispanic / Latino 9% Two or more races 7% Black 1% Asian 1%
- Hispanic origin (detail)
- Puerto Rican 2% Cuban 2%
- Common ancestry
- Lithuanian 4% Slovak 3% Romanian 3%
- Foreign-born
- 11% · Canada, Jamaica, Guatemala
- Languages at home
- 89% English-only · Spanish 7% Other Indo-European 1% French/Haitian/Cajun 1%
Political lean MEDSL · Palm Beach
- 2024 margin
- Toss-up / Even · D 50.0% · R 49.2%
- 2008→2024 swing
- -22.1pp toward R · 2008: 22.9pp · 2024: 0.8pp
- All cycles
- 2024: D+0.8 2020: D+12.8 2016: D+15.3 2012: D+17.0 2008: D+22.9
Not yet ingested
- Civics
- —
Market trends
- HPI YoY
- ▼ -223.14%
- Current HPI
- 365.2913
- Rent YoY
- ▲ 0.27%
- Metro
- Miami-Fort Lauderdale-Pompano Beach, FL
- State GDP YoY
- ▲ 3.28%
- F500 in state
- 36
Industry mix (Fortune 500 HQ in FL)
| Industry | F500 HQs | Revenue |
|---|---|---|
| Industrial Technology | 2 | $29B |
|
||
| Insurance | 2 | $17B |
|
||
| Retail | 1 | $60B |
|
||
| Technology Distribution | 1 | $58B |
|
||
| Homebuilding | 1 | $35B |
|
||
| Technology Manufacturing | 1 | $35B |
|
||
Price history
+292.6% since first listed11 events — show timeline
- 2026-04-23 Price Changed $265,000 Beaches MLS
- 2026-04-17 Price Changed $275,000 Beaches MLS
- 2026-04-03 Price Changed $299,999 Beaches MLS
- 2026-04-03 Price Changed $315,999 Beaches MLS
- 2026-03-20 Price Changed $399,999 Beaches MLS
- 2026-02-16 Price Changed $419,900 Beaches MLS
- 2026-01-04 Relisted — Beaches MLS
- 2026-01-02 Listing Removed — Beaches MLS
- 2025-11-10 Price Changed $449,900 Beaches MLS
- 2025-10-20 Listed $485,000 Beaches MLS
- 1985-11-01 Sold (Public Records) $67,500 Public Records
Property tax history
+9.0%/yrLatest (2025): $4,282 · -6.3% YoY. Source: county tax records.
Cash-flow waterfall
monthlySold comps — $/sqft
last 12 mo · ≤1 miLoading sold comps…