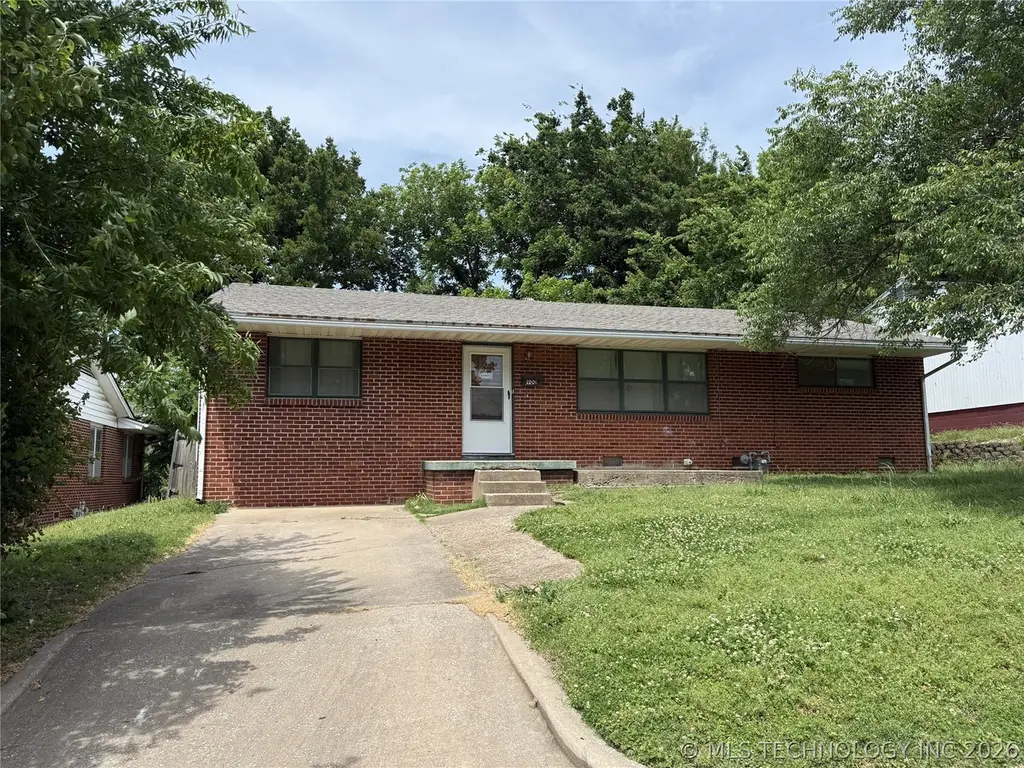
900 Yale Dr · Bartlesville, OK
Flood risk 1/10 · Minimal
- FEMA flood zone
- X (unshaded)
- Chance of flooding over 30 yrs
- 0.0%
- Est. flood insurance / yr
- $507 – $1,088
Fire risk 6/10 · Moderate
- Est. fire insurance / yr
- $2,463 – $4,575
Heat risk 6/10 · Moderate
- Hot days now (above 112°F)
- 7 days/yr
- Hot days in 30 yrs
- 18 days/yr
Wind risk 2/10 · Minimal
- Chance of severe wind over 30 yrs
- 4.0%
Air-quality risk 2/10 · Minimal
- Unhealthy air days now
- 2 days/yr
- Unhealthy air days in 30 yrs
- 2 days/yr
Risk factors via First Street. Map © Google.
Why this score? — see what drove the B+ grade
The composite is a weighted blend of 9 inputs, each scored 0–100. Each bar is that input's sub-score; the figure is the points it added to the 100-point composite (weight × sub-score).
- Cash flow +30.0/30.0
- ARV discount +15.0/15.0
- DSCR +10.0/10.0
- 1% rule +9.2/10.0
- Livability +3.2/5.0
- Schools +2.6/10.0
- Rent growth +2.5/5.0
- Condition / age +2.5/5.0
- Appreciation +0.0/10.0
$95,000
🖨 Deal sheet 📄 Offer letter ✓ Due diligence
Listing remarks
Located in the desirable Pennington Hills 4th subdivision offering 3 bedrooms and 2 full bathrooms. This property features a functional layout with comfortable living spaces, spacious bedrooms, and great potential for homeowners or investors alike. Conveniently located near schools, shopping, dining, and local amenities. With good rental potential, this home could make an excellent investment property or primary residence. Don’t miss this opportunity to own in an established neighborhood in Bartlesville!
Key facts
- 7,200 sq ft lot
- Built 1956
- Listed 18 days
Property features AI
Exterior
- Security: No safety shelter
- Utilities: Electricity available; Natural gas available; Public water; Public sewer
- Home design: Single-story home; Entry level: first; Construction: brick and wood frame
- Construction: Built per public records; Asphalt/fiberglass roof; Slab foundation
- Exterior features: Partial fencing; No other exterior features listed; Faces south
Interior
- Kitchen: Range
- Bedrooms: Master bedroom (first level); Bedroom (first level); Bedroom (first level)
- Bathrooms: Master bath (first level); Hall bath (first level); Total of 2 full bathrooms
- Heating & cooling: Central heating (gas); Central air conditioning
- Interior features: Vinyl windows; No additional interior features listed
- Laundry & utility: Gas water heater
Neighborhood map
What this means for you Summary
Snapshot
- This is a 3-bed/1.0-bath single-family listed at $95k.
Deal economics
- At list price, monthly cash flow is $439 ($5k/yr) — positive.
- The deal already cash-flows at list — no discount required.
- Meets the 1% rule at list price ($1k rent vs $95k).
- Recommended offer: $94k (1.5% below list) — sets the bar for market timing.
- Cap rate 11.8% vs local median 4.7% in Bartlesville — top-decile yield for the area; either an underpriced asset or a hidden risk that comps aren't pricing in. Stress-test before assuming the spread holds.
Location & tenants
- Location reads 64/100 on livability (#175 in OK) — a middle-class / working-renter tenant base. Strengths: cost of living A+, housing A+; Watch: employment C-, schools D+, crime D+.
- Bartlesville (town): math 30% / reading 29% proficiency, ranked #59 of 270 in OK (top 22%) — low school quality limits family demand, transient renter base, plan for 1-2y turnover.
- Market conditions: 231 active listings in the ZIP; 4 comparable units currently listed for rent nearby; rentals leasing fast (median 12d on market — plan ~1-2 weeks tenant-placement turnaround); 46 units permitted in Washington County in 2024 (0 in 5+ unit buildings).
Forward outlook
- Local home prices are declining (-3.0%/yr); year-one equity from $657 of loan paydown is wiped out by about $3k of value loss. Plan a longer hold.
- Washington County population projected at +12% by 2050 — modest demand growth; plan on rents tracking national, not racing it.
- At projected returns (-3.0% appreciation + 3.0% rent growth), your $27k cash investment doubles in ~7 years — after that, you're playing with house money.
Negotiation context
- It's been on market 18 days — a 2% lower offer ($94k) is reasonable based on typical stale-listing flexibility.
- 2 sale attempts since 27y ago with the ask held roughly flat each time — persistent listings suggest the price (not the market) is what's stuck; bring a comps-based counter.
- Current owner paid $49k; list at $95k implies a 94% gain — meaningful room to come down on a strong offer.
Risks & watch-outs
- Watch-outs: built in 1956 — expect roof / HVAC / electrical / plumbing capex.
- Climate carrying-cost: major wildfire risk; extreme-heat days projected 7→18/yr by 2055 (HVAC capex compounding) — expect insurance premiums to compound above CPI over the hold.
Questions for the listing agent
- Built in 1956 — when were the roof, HVAC, electrical panel, plumbing, and water heater last replaced?
- Is there a deadline driving the sale (1031 exchange, divorce, estate, relocation)? That informs how much negotiation room exists.
- Schools are D-rated, which usually means shorter tenancies and higher turnover. Who's the typical renter profile here, and what's been the actual vacancy rate?
- Crime grade is D in this area — have there been break-ins, vandalism, or insurance claims at this property in the last 3 years? What carrier currently insures it and at what premium?
- What's the average days-on-market for RENTAL listings here right now (not sales)? A rising rental-DOM trend means longer vacancies and softer asking-rent achievability than the comps imply.
- What's the recent tenant-quality profile in this submarket — average credit score on applications, eviction rate, late-payment / NSF rate, and stable-employment percentage? A property-management company in the area should have these aggregated.
- How much new for-sale + rental construction is in the pipeline within 1–3 miles? Heavy new supply typically softens prices + rents 12–24 months out; constrained supply supports both.
Investment metrics
- 1% rule
- 1.42% ✓
- Cap rate
- 11.83%
- Cash-on-cash
- 19.79%
- DSCR
- 1.88
- GRM
- 5.8
CMA / ARV
- ARV (on-the-fly)
- $132,458
- Comps found
- 12
Show comp detail 12 sales within ~0.75 mi
| Address | Dist | Beds/Ba | Sqft | Sold | Price | $/sf | Match |
|---|---|---|---|---|---|---|---|
| 4704 Cornell Dr | 0.15mi | 3/1.5 | 1,216 (-5%) | 3mo | $80,000 | $66 | 79 |
| 4800 E Frank Phillips | 0.21mi | 3/1.0 | 1,182 (-8%) | 1mo | $149,000 | $126 | 76 |
| 601 Yale Dr | 0.20mi | 3/1.0 | 1,170 (-9%) | 3mo | $71,200 | $61 | 73 |
| 4105 Fleetwood Dr | 0.56mi | 3/1.0 | 1,314 (+2%) | 2mo | $113,000 | $86 | 69 |
| 129 Fleetwood Pl | 0.52mi | 3/2.0 | 1,260 (-2%) | 0mo | $134,000 | $106 | 68 |
| 4932 Amherst Dr | 0.40mi | 3/1.5 | 1,416 (+10%) | 0mo | $151,650 | $107 | 62 |
| 4947 Baylor Dr | 0.36mi | 3/2.0 | 1,405 (+9%) | 3mo | $120,000 | $85 | 61 |
| 5012 Allen Ct | 0.28mi | 3/1.5 | 1,107 (-14%) | 2mo | $150,000 | $136 | 60 |
| 1001 May Ln | 0.31mi | 3/2.0 | 1,475 (+15%) | 2mo | $175,000 | $119 | 55 |
| 5610 Baylor Dr | 0.52mi | 3/2.0 | 1,407 (+9%) | 3mo | $145,000 | $103 | 53 |
| 5423 Baylor Dr | 0.43mi | 3/2.0 | 1,476 (+15%) | 0mo | $146,000 | $99 | 51 |
| 1242 Saddle Ln | 0.55mi | 3/2.0 | 1,456 (+13%) | 1mo | $150,000 | $103 | 48 |
Match score weights: distance 35% · size 25% · config 20% · recency 20%. Top-matched comps best support the ARV.
Projected returns pro-forma
-3.0% appreciation · 3.0% rent growth · sell at horizon
- IRR
- 11.9%
- Equity multiple
- 1.47×
- Total profit
- $12,552
- Equity at exit
- $14,165
- IRR
- 20.9%
- Equity multiple
- 2.76×
- Total profit
- $46,928
- Equity at exit
- $8,214
Cash invested: $26,600 (down + closing). Projections, not guarantees.
Landlord ↔ Tenant lean methodology
- Overall (STATE)
- 83 Strongly Landlord-Friendly
- State Oklahoma
- 83 Strongly Landlord-Friendly · R+20
- County
- — inherits STATE
- City
- — inherits STATE
ZIP-level market 74006
- Home prices YoY
- -33.2%
- Active inventory
- 231
- Price-to-rent
- 5.8×
Monthly cashflow live
- Estimated rent
- $1,354 medium interval (Pro) →
- Mortgage (P&I)
- −$498
- Tax from tax record
- −$93 /mo · $1,115/yr
- Insurance
- −$40
- HOA
- −$0
- Vacancy / Maint / Mgmt
- −$284
- Net cashflow
- $439
Break-even live
UW: 25.0% down · 7.5% · 30yr · 1.5% tax · 5.0% vac · 8.0% maint · 8.0% mgmt
Financing live
Cash to close
- Down payment
- $23,750
- Closing costs
- $2,850
- Reserves months
- —
- Total cash needed
- —
Loan-product check · same deal, 3 products live
Conventional
25% down · 7.5% · 30yr
- Down + closing
- —
- Monthly P&I
- —
- Monthly cashflow
- —
- DSCR
- —
- Eligible?
- —
Personal DTI + credit; lowest rate.
DSCR
20% down · 8.5% · 30yr
- Down + closing
- —
- Monthly P&I
- —
- Monthly cashflow
- —
- DSCR
- —
- Eligible?
- —
No personal income docs; deal must DSCR.
Hard money
10% down · 12.0% · 12mo
- Down + closing
- —
- Monthly P&I
- —
- Monthly cashflow
- —
- DSCR
- —
- Eligible?
- —
Short-term bridge; refi at stabilization.
Rent comps 4 comps
| Address | Beds | Baths | Sqft | Rent | $/sqft | DOM | Units | Dist |
|---|---|---|---|---|---|---|---|---|
| 4715 SE Adams Blvd Unit 905D Bartlesville, OK | 2.0 | 2.0 | 953 | $900 | $0.94 | 11d | 1 | 0.17mi |
| 5530 Colony Way Bartlesville, OK | 1.0–2.0 | 1.0–2.5 | 1176 | $1,399 | $1.19 | 23d | 4 | 0.44mi |
| 5610 Baylor Dr Bartlesville, OK | 3.0 | 2.0 | 1407 | $1,500 | $1.07 | 3d | 1 | 0.50mi |
| 437 NE Myers Ave Bartlesville, OK | 4.0 | 2.0 | 1405 | $1,500 | $1.07 | 11d | 1 | 1.45mi |
Listing history 11 events
-
2026-06-13status $95,000 Pending 18 DOM
-
2026-06-12days on market $95,000 Active 18 DOM
-
2026-06-09days on market $95,000 Active 15 DOM
-
2026-06-08days on market $95,000 Active 14 DOM
-
2026-06-07statusdays on market $95,000 Active 13 DOM
-
2026-05-14$95,000 Active
-
2005-09-20soldstatus $49,000
-
2005-09-01soldstatus $49,000
-
2004-01-23soldstatus $40,000
-
1999-08-27soldstatus $19,500
-
1999-08-04$24,950
ⓘ Source: listings_history table (triggers on properties + properties_extension) + one-shot
backfill from property_details.listing_events for pre-trigger history.
Tax reassessment forecast OK · Resets to sale price
- Current annual tax
- $1,115 · $93/mo
- Projected year-2 tax
- $1,115 · $93/mo
- Expected delta
- $0/yr ($0/mo · 0.0%)
ⓘ Screening estimate from a state-policy table — verify with the county assessor before closing.
Climate risk First Street
- Flood 1/10 Low FEMA zone X (unshaded) · 0% chance over 30 yrs
- Wildfire 6/10 Major
- Heat 6/10 Major 7 d/yr ≥112°F today · 18 d/yr by 30 yrs out
- Wind 2/10 Low 4% chance of damaging wind over 30 yrs
- Air quality 2/10 Low 2 unhealthy d/yr today · 2 by 30 yrs out
Nearby sold comps map
Loading sold comps map…
Walkable amenities ~0.75 mi
Loading nearby amenities…
Taxation est. · year 1
- Rental income
- $16,244
- − Mortgage interest
- −$5,321
- − Property taxes
- −$1,115
- − Insurance
- −$475
- − Repairs & maintenance
- −$1,300
- − Management
- −$1,300
- − Depreciation
- −$2,764
- Taxable income
- $3,970
- Est. tax owed @ 24.0%
- −$953
- After-tax cash flow
- $4,312/yr
For passive investors: Depreciation is non-cash, so a rental often shows a tax loss while cash-flowing — sheltering income. Rental losses are passive: they offset passive income freely, and up to $25,000/yr can offset ordinary (W-2) income if you actively participate and your MAGI is under $100k (phasing out to $0 by $150k); unused losses carry forward. On sale, claimed depreciation is recaptured at up to 25%, and gains may owe capital-gains tax (a 1031 exchange can defer both). Figures are a year-1 estimate at your 24.0% rate — not tax advice; consult a CPA.
Schools (NCES district)
- District
- Bartlesville
- NCES district ID
- 4003630
- Math proficiency
- 30% ▼ -13.00%
- Reading proficiency
- 29% ▼ -10.00%
- Median HH income
- $48,889
- Composite
- 25.69/100
- National rank
- #7389
- State rank
- #59 of 270 in OK
Livability — Bartlesville
- Score
- 64/100
- State rank
- #175
- US rank
- #13940
Category grades
Schools grade is shown separately in the Schools card above.
Census & demographics
- Census place
- Bartlesville, OK
- County
- Washington County · 41,935 people
- City population
- 41,935
- Metro
- Bartlesville, OK
- Population (ZIP)
- 27,911
- Household income
- $71,796
- Rent vs Own
- Severe rent burden
- 563.0
Population outlook (Washington County) Hauer SSP2
- Today (2025)
- 54,946 people
- By 2030
- 56,249 · +2.4%
- By 2040
- 58,867 · +7.1%
- By 2050
- 61,600 · +12.1%
- By 2075
- 69,355 · +26.2%
- By 2100
- 73,067 · +33.0%
Race, ethnicity, and origin ACS 2023
- Neighborhood character
- Predominantly White (74%)
- Race & ethnicity
- White 74% Two or more races 9% Native American 7% Hispanic / Latino 6% Asian 3% Black 3%
- Hispanic origin (detail)
- Mexican 5%
- Common ancestry
- Lithuanian 3% Slovak 2% Serbian 2%
- Foreign-born
- 5% · Canada, China, Vietnam
- Languages at home
- 93% English-only · Spanish 4% Vietnamese 1% Chinese 1%
Political lean MEDSL · Washington
- 2024 margin
- Solid R (+47.6) · D 25.0% · R 72.7% · Other 2.4%
- 2008→2024 swing
- -3.1pp toward R · 2008: -44.6pp · 2024: -47.6pp
- All cycles
- 2024: R+47.6 2020: R+48.0 2016: R+48.5 2012: R+47.8 2008: R+44.6
Not yet ingested
- Civics
- —
Market trends
- HPI YoY
- ▼ -118.35%
- Current HPI
- 237.9056
- Rent YoY
- —
- Metro
- Bartlesville, OK
- State GDP YoY
- ▲ 1.55%
- F500 in state
- 6
Industry mix (Fortune 500 HQ in OK)
| Industry | F500 HQs | Revenue |
|---|---|---|
| Energy | 3 | $48B |
|
||
Price history
+280.8% since first listed6 events — show timeline
- 2026-05-14 Listed $95,000 MLS Technology, Inc.
- 2005-09-20 Sold (Public Records) $49,000 Public Records
- 2005-09-01 Sold (Public Records) $49,000 Public Records
- 2004-01-23 Sold (Public Records) $40,000 Public Records
- 1999-08-27 Sold (Public Records) $19,500 Public Records
- 1999-08-04 Listed $24,950 MLS Technology, Inc.
Property tax history
+4.6%/yrLatest (2025): $1,115 · +1.8% YoY. Source: county tax records.
Cash-flow waterfall
monthlySold comps — $/sqft
last 12 mo · ≤1 miLoading sold comps…