 Duplex
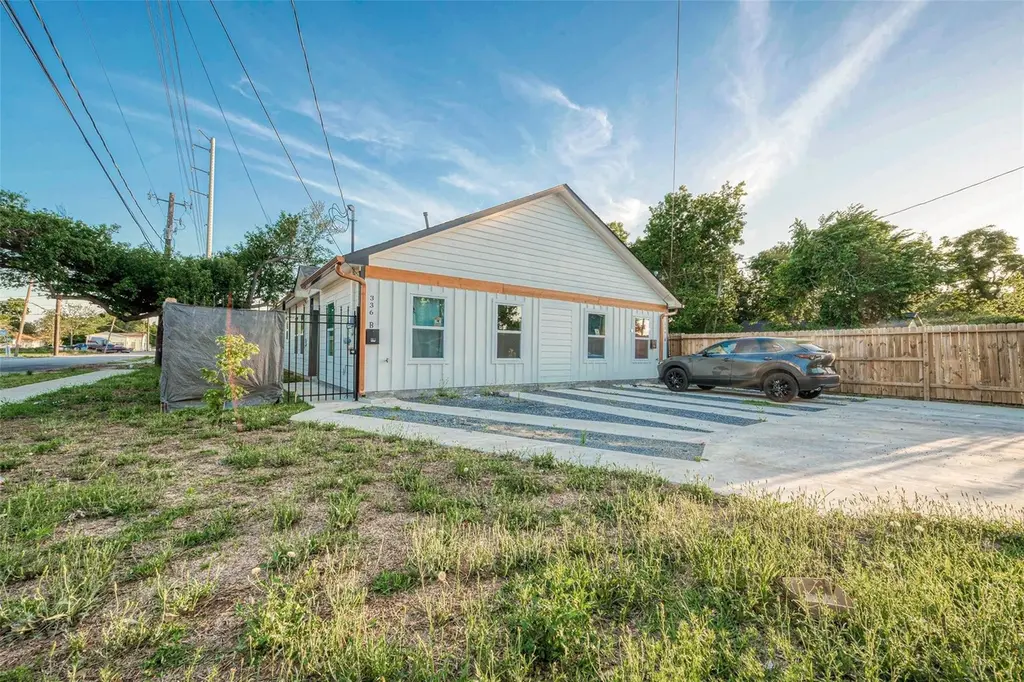
336 De Haven St · Houston, TX
Flood risk 4/10 · Minor
- FEMA flood zone
- X (unshaded)
- Chance of flooding over 30 yrs
- 0.22%
- Est. flood insurance / yr
- $507 – $1,088
Fire risk 3/10 · Minor
- Est. fire insurance / yr
- $1,222 – $2,270
Heat risk 9/10 · Severe
- Hot days now (above 109°F)
- 7 days/yr
- Hot days in 30 yrs
- 22 days/yr
Wind risk 9/10 · Severe
- Chance of severe wind over 30 yrs
- 99.0%
Air-quality risk 2/10 · Minimal
- Unhealthy air days now
- 2 days/yr
- Unhealthy air days in 30 yrs
- 2 days/yr
Risk factors via First Street. Map © Google.
Why this score? — see what drove the D+ grade
The composite is a weighted blend of 9 inputs, each scored 0–100. Each bar is that input's sub-score; the figure is the points it added to the 100-point composite (weight × sub-score).
- ARV discount +10.0/15.0
- Appreciation +10.0/10.0
- Cash flow +9.6/30.0
- 1% rule +4.2/10.0
- Livability +3.7/5.0
- Schools +2.8/10.0
- DSCR +2.7/10.0
- Rent growth +2.5/5.0
- Condition / age +2.5/5.0
$349,990
🖨 Deal sheet 📄 Offer letter ✓ Due diligence
Multi-family units
County records classify this as Multi-Family (2-4 Unit). Listing-text estimate: 2 units. confirmed
Listing remarks MLS
This INCOME-GENERATING duplex is an investor’s dream, combining modern comfort with excellent security. Both units offer spacious layouts with 3 bedrooms and 2 bathrooms, updated finishes, and are situated behind a secure gated entry, providing added peace of mind for tenants and owners alike. Each unit features well-designed kitchens with stainless steel appliances, bright living spaces, and ample storage, making it highly appealing for long-term occupancy. Positioned in a high-demand rental area, this duplex has strong potential for steady cash flow and appreciation. Don’t miss out on this rare opportunity to add a valuable asset to your portfolio in a prime location!
Key facts
- Steady cash flow
- Secure gated entry
- 5,000 sq ft lot
Tags
Neighborhood map
What this means for you Summary
Snapshot
- This is a 2 × 3-bed/2.0-bath units multifamily listed at $350k.
Deal economics
- At list price, monthly cash flow is $-238 ($-3k/yr) — negative. Per door: $-119/mo.
- To cash-flow at today's rent, offer at most $308k (12.0% below list).
- To meet the 1% rule (rent ≥ 1% of price), the offer needs to be $323k (7.8% below list).
- Recommended offer: $308k (12.0% below list) — sets the bar for cash-flow.
- Cap rate 5.5% vs local median 3.2% in Houston — top-decile yield for the area; either an underpriced asset or a hidden risk that comps aren't pricing in. Stress-test before assuming the spread holds.
Location & tenants
- Location reads 74/100 on livability (#184 in TX, #4,771 nationally) — a middle-class / working-renter tenant base. Strengths: amenities A+, cost of living A+, housing A+; Watch: schools D, crime F.
- Galena Park ISD (suburban): math 32% / reading 33% proficiency, ranked #578 of 826 in TX (top 70%) — families likely to look elsewhere, expect single-tenant / working-renter base with shorter leases; 74% free/reduced lunch — lower-income household profile, screen leases tightly.
- Market conditions: 153 active listings in the ZIP; 1 comparable units currently listed for rent nearby; 29,883 units permitted in Harris County in 2024 (8,621 in 5+ unit buildings).
- At $3,227/mo this rent would consume 80% of the median local household income ($48k/yr) (locally 457% of renters already pay >50% of income on rent) — very limited rent-growth headroom before tenants either downsize or default.
Forward outlook
- In year one you build about $37k of equity ($2k loan paydown + $35k appreciation (10.0% local appreciation)).
- Harris County population projected at +47% by 2050 — long-run rental-demand tailwind backs the buy-and-hold thesis.
- By year 2, paydown + projected appreciation supports a ~$60k cash-out refi (75% LTV) — recoverable capital for the next deal without selling this one.
Negotiation context
- It's been on market 371 days — a 12% lower offer ($308k) is reasonable based on typical stale-listing flexibility.
- 9 sale attempts since 9y ago with the ask held roughly flat each time — persistent listings suggest the price (not the market) is what's stuck; bring a comps-based counter.
Risks & watch-outs
- Watch-outs: property tax is 2.8% of price.
- Climate carrying-cost: severe wind risk, 99% chance of damaging wind over 30y; extreme-heat days projected 7→22/yr by 2055 (HVAC capex compounding) — expect insurance premiums to compound above CPI over the hold.
Questions for the listing agent
- What do current leases actually rent for vs. the listed asking? Can we see a recent rent roll and the last 12 months of T-12 income?
- It's been on market 371 days. Have you received any prior offers? Is the seller open to a 12% concession, seller financing, or rate buy-down credit?
- Can we see the unit-by-unit rent roll, current vacancy, and any below-market leases? What's the average tenancy length?
- What capital expenditures (roof, boiler, parking lot, exteriors) have been made in the last 5 years, and what's planned in the next 2?
- Property tax is high relative to price — has the assessment been appealed recently, and will the sale trigger a re-assessment?
- Why hasn't it sold? Are there any deal-killer items the seller is aware of (foundation, flood, title, zoning, code violations)?
- Is there a deadline driving the sale (1031 exchange, divorce, estate, relocation)? That informs how much negotiation room exists.
- Schools are D-rated, which usually means shorter tenancies and higher turnover. Who's the typical renter profile here, and what's been the actual vacancy rate?
- Crime grade is F in this area — have there been break-ins, vandalism, or insurance claims at this property in the last 3 years? What carrier currently insures it and at what premium?
- The area grade is low — what's the realistic commute time and amenity access for the typical tenant pool here? Any planned neighborhood developments (good or bad) we should know about?
- What's the average days-on-market for RENTAL listings here right now (not sales)? A rising rental-DOM trend means longer vacancies and softer asking-rent achievability than the comps imply.
- What's the recent tenant-quality profile in this submarket — average credit score on applications, eviction rate, late-payment / NSF rate, and stable-employment percentage? A property-management company in the area should have these aggregated.
- How much new apartment / multifamily construction is in the pipeline within 1–3 miles? Heavy new supply (>2% of stock underway) typically softens rents 12–24 months out; light construction supports rent growth.
Investment metrics
- 1% rule
- 0.92% ✗
- Cap rate
- 5.48%
- Cash-on-cash
- -2.91%
- DSCR
- 0.87
- GRM
- 9.0
CMA / ARV
- ARV (median comp)
- $370,490
- List price
- $349,990
- Delta
- -5.53%
- Verdict
- FAIR
- Comps
- 20 within 1.0 mi
Show comp detail 4 sales within ~0.75 mi
| Address | Dist | Beds/Ba | Sqft | Sold | Price | $/sf | Match |
|---|---|---|---|---|---|---|---|
| 330 Clearwater AB St | 0.19mi | 6/2.0 | 2,368 (-1%) | 13mo | $369,900 | $156 | 70 |
| 328 Clearwater AB St | 0.20mi | 6/2.0 | 2,368 (-1%) | 13mo | $369,900 | $156 | 70 |
| 405 Clearwater AB St | 0.22mi | 6/2.0 | 2,368 (-1%) | 12mo | $369,900 | $156 | 69 |
| 407 Clearwater AB St | 0.22mi | 6/2.0 | 2,368 (-1%) | 12mo | $369,900 | $156 | 69 |
Match score weights: distance 35% · size 25% · config 20% · recency 20%. Top-matched comps best support the ARV.
Projected returns pro-forma
10.0% appreciation · 3.0% rent growth · sell at horizon
- IRR
- 22.2%
- Equity multiple
- 2.79×
- Total profit
- $175,732
- Equity at exit
- $315,299
- IRR
- 20.0%
- Equity multiple
- 6.41×
- Total profit
- $529,968
- Equity at exit
- $679,954
Cash invested: $97,997 (down + closing). Projections, not guarantees.
Landlord ↔ Tenant lean methodology
- Overall (STATE)
- 87 Strongly Landlord-Friendly
- State Texas
- 87 Strongly Landlord-Friendly · R+5
- County
- — inherits STATE
- City
- — inherits STATE
ZIP-level market 77029
- Home prices YoY
- 7.2%
- Active inventory
- 153
- Price-to-rent
- 18.1×
Monthly cashflow live
- Estimated rent
- $3,227 high interval (Pro) →
- Mortgage (P&I)
- −$1,835
- Tax from tax record
- −$806 /mo · $9,673/yr
- Insurance
- −$146
- HOA
- −$0
- Vacancy / Maint / Mgmt
- −$678
- Net cashflow
- $-238
Break-even live
2-unit breakdown (identical units grouped — click to expand)
| Units | Beds | Baths | Est. rent |
|---|---|---|---|
| 2× units | 3 | 2 | $3,228 |
| #1 | 3 | 2 | $1,614 |
| #2 | 3 | 2 | $1,614 |
| Total (2 units) | $3,227 | ||
UW: 25.0% down · 7.5% · 30yr · 1.5% tax · 5.0% vac · 8.0% maint · 8.0% mgmt
Financing live
Cash to close
- Down payment
- $87,498
- Closing costs
- $10,500
- Reserves months
- —
- Total cash needed
- —
Loan-product check · same deal, 3 products live
Conventional
25% down · 7.5% · 30yr
- Down + closing
- —
- Monthly P&I
- —
- Monthly cashflow
- —
- DSCR
- —
- Eligible?
- —
Personal DTI + credit; lowest rate.
DSCR
20% down · 8.5% · 30yr
- Down + closing
- —
- Monthly P&I
- —
- Monthly cashflow
- —
- DSCR
- —
- Eligible?
- —
No personal income docs; deal must DSCR.
Hard money
10% down · 12.0% · 12mo
- Down + closing
- —
- Monthly P&I
- —
- Monthly cashflow
- —
- DSCR
- —
- Eligible?
- —
Short-term bridge; refi at stabilization.
Rent comps 1 comps
| Address | Beds | Baths | Sqft | Rent | $/sqft | DOM | Units | Dist |
|---|---|---|---|---|---|---|---|---|
| 220 Armstrong St Houston, TX | 5.0 | 2.0 | 1900 | $2,000 | $1.05 | 44d | 1 | 0.20mi |
Listing history 45 events
-
2026-06-18days on market $349,990 Active 371 DOM
-
2026-06-17days on market $349,990 Active 370 DOM
-
2026-06-16days on market $349,990 Active 369 DOM
-
2026-06-15days on market $349,990 Active 368 DOM
-
2026-06-13days on market $349,990 Active 366 DOM
-
2026-06-13days on market $349,990 Active 365 DOM
-
2026-06-09days on market $349,990 Active 362 DOM
-
2026-06-08days on market $349,990 Active 361 DOM
-
2026-06-07days on market $349,990 Active 360 DOM
-
2026-06-04days on market $349,990 Active 357 DOM
-
2026-06-03days on market $349,990 Active 356 DOM
-
2026-06-02days on market $349,990 Active 355 DOM
-
2026-06-01days on market $349,990 Active 354 DOM
-
2026-05-31days on market $349,990 Active 353 DOM
-
2026-04-22status Active 690-char remark
Show marketing remark (690 chars)
This INCOME-GENERATING duplex is an investor’s dream, combining modern comfort with excellent security. Both units offer spacious layouts with 3 bedrooms and 2 bathrooms, updated finishes, and are situated behind a secure gated entry, providing added peace of mind for tenants and owners alike. Each unit features well-designed kitchens with stainless steel appliances, bright living spaces, and ample storage, making it highly appealing for long-term occupancy. Positioned in a high-demand rental area, this duplex has strong potential for steady cash flow and appreciation. Don’t miss out on this rare opportunity to add a valuable asset to your portfolio in a prime location!
-
2026-02-20status Pending 690-char remark
Show marketing remark (690 chars)
This INCOME-GENERATING duplex is an investor’s dream, combining modern comfort with excellent security. Both units offer spacious layouts with 3 bedrooms and 2 bathrooms, updated finishes, and are situated behind a secure gated entry, providing added peace of mind for tenants and owners alike. Each unit features well-designed kitchens with stainless steel appliances, bright living spaces, and ample storage, making it highly appealing for long-term occupancy. Positioned in a high-demand rental area, this duplex has strong potential for steady cash flow and appreciation. Don’t miss out on this rare opportunity to add a valuable asset to your portfolio in a prime location!
-
2026-01-13status Pending 690-char remark
Show marketing remark (690 chars)
This INCOME-GENERATING duplex is an investor’s dream, combining modern comfort with excellent security. Both units offer spacious layouts with 3 bedrooms and 2 bathrooms, updated finishes, and are situated behind a secure gated entry, providing added peace of mind for tenants and owners alike. Each unit features well-designed kitchens with stainless steel appliances, bright living spaces, and ample storage, making it highly appealing for long-term occupancy. Positioned in a high-demand rental area, this duplex has strong potential for steady cash flow and appreciation. Don’t miss out on this rare opportunity to add a valuable asset to your portfolio in a prime location!
-
2025-07-24status Active 690-char remark
Show marketing remark (690 chars)
This INCOME-GENERATING duplex is an investor’s dream, combining modern comfort with excellent security. Both units offer spacious layouts with 3 bedrooms and 2 bathrooms, updated finishes, and are situated behind a secure gated entry, providing added peace of mind for tenants and owners alike. Each unit features well-designed kitchens with stainless steel appliances, bright living spaces, and ample storage, making it highly appealing for long-term occupancy. Positioned in a high-demand rental area, this duplex has strong potential for steady cash flow and appreciation. Don’t miss out on this rare opportunity to add a valuable asset to your portfolio in a prime location!
-
2025-07-14status Pending 690-char remark
Show marketing remark (690 chars)
This INCOME-GENERATING duplex is an investor’s dream, combining modern comfort with excellent security. Both units offer spacious layouts with 3 bedrooms and 2 bathrooms, updated finishes, and are situated behind a secure gated entry, providing added peace of mind for tenants and owners alike. Each unit features well-designed kitchens with stainless steel appliances, bright living spaces, and ample storage, making it highly appealing for long-term occupancy. Positioned in a high-demand rental area, this duplex has strong potential for steady cash flow and appreciation. Don’t miss out on this rare opportunity to add a valuable asset to your portfolio in a prime location!
-
2025-04-16price $349,990 690-char remark
Show marketing remark (690 chars)
This INCOME-GENERATING duplex is an investor’s dream, combining modern comfort with excellent security. Both units offer spacious layouts with 3 bedrooms and 2 bathrooms, updated finishes, and are situated behind a secure gated entry, providing added peace of mind for tenants and owners alike. Each unit features well-designed kitchens with stainless steel appliances, bright living spaces, and ample storage, making it highly appealing for long-term occupancy. Positioned in a high-demand rental area, this duplex has strong potential for steady cash flow and appreciation. Don’t miss out on this rare opportunity to add a valuable asset to your portfolio in a prime location!
-
2025-04-01$364,990 Active 690-char remark
Show marketing remark (690 chars)
This INCOME-GENERATING duplex is an investor’s dream, combining modern comfort with excellent security. Both units offer spacious layouts with 3 bedrooms and 2 bathrooms, updated finishes, and are situated behind a secure gated entry, providing added peace of mind for tenants and owners alike. Each unit features well-designed kitchens with stainless steel appliances, bright living spaces, and ample storage, making it highly appealing for long-term occupancy. Positioned in a high-demand rental area, this duplex has strong potential for steady cash flow and appreciation. Don’t miss out on this rare opportunity to add a valuable asset to your portfolio in a prime location!
-
2025-04-01historical
Show marketing remark (690 chars)
This INCOME-GENERATING duplex is an investor’s dream, combining modern comfort with excellent security. Both units offer spacious layouts with 3 bedrooms and 2 bathrooms, updated finishes, and are situated behind a secure gated entry, providing added peace of mind for tenants and owners alike. Each unit features well-designed kitchens with stainless steel appliances, bright living spaces, and ample storage, making it highly appealing for long-term occupancy. Positioned in a high-demand rental area, this duplex has strong potential for steady cash flow and appreciation. Don’t miss out on this rare opportunity to add a valuable asset to your portfolio in a prime location!
-
2025-01-22price $374,990
-
2024-10-25$384,990 Active
-
2024-10-25historical
-
2024-06-21status Active
-
2024-06-05historical
-
2024-05-10price $384,990
-
2024-04-30price $399,990
-
2024-04-29$400,000 Active
-
2023-10-03soldstatus Sold
-
2023-10-03soldstatus
-
2023-08-29status Pending
-
2023-08-25status Option Pending
-
2023-07-26price $380,000
-
2023-07-13$390,000 Active
-
2023-03-23soldstatus
-
2022-03-15soldstatus Sold
-
2022-02-23status Pending
-
2022-02-14$45,000 Active
-
2018-05-07soldstatus Sold
-
2018-02-01status Pending
-
2018-02-01price $14,500
-
2017-06-23$12,500 Active
-
1988-01-02soldstatus
ⓘ Source: listings_history table (triggers on properties + properties_extension) + one-shot
backfill from property_details.listing_events for pre-trigger history.
Tax reassessment forecast TX · Resets to sale price
- Current annual tax
- $9,673 · $806/mo
- Projected year-2 tax
- $9,673 · $806/mo
- Expected delta
- $0/yr ($0/mo · 0.0%)
ⓘ Screening estimate from a state-policy table — verify with the county assessor before closing.
Climate risk First Street
- Flood 4/10 Moderate FEMA zone X (unshaded) · 22% chance over 30 yrs
- Wildfire 3/10 Moderate
- Heat 9/10 Extreme 7 d/yr ≥109°F today · 22 d/yr by 30 yrs out
- Wind 9/10 Extreme 99% chance of damaging wind over 30 yrs
- Air quality 2/10 Low 2 unhealthy d/yr today · 2 by 30 yrs out
Nearby sold comps map
Loading sold comps map…
Walkable amenities ~0.75 mi
Loading nearby amenities…
Taxation est. · year 1
- Rental income
- $38,724
- − Mortgage interest
- −$19,605
- − Property taxes
- −$9,673
- − Insurance
- −$1,750
- − Repairs & maintenance
- −$3,098
- − Management
- −$3,098
- − Depreciation
- −$10,182
- Taxable loss
- −$8,681
- Est. tax savings @ 24.0%
- +$2,084
- After-tax cash flow
- $-772/yr
For passive investors: Depreciation is non-cash, so a rental often shows a tax loss while cash-flowing — sheltering income. Rental losses are passive: they offset passive income freely, and up to $25,000/yr can offset ordinary (W-2) income if you actively participate and your MAGI is under $100k (phasing out to $0 by $150k); unused losses carry forward. On sale, claimed depreciation is recaptured at up to 25%, and gains may owe capital-gains tax (a 1031 exchange can defer both). Figures are a year-1 estimate at your 24.0% rate — not tax advice; consult a CPA.
Schools (NCES district)
- District
- Galena Park ISD
- NCES district ID
- 4820250
- Math proficiency
- 32% ▼ -20.00%
- Reading proficiency
- 33% ▼ -7.00%
- Median HH income
- $43,158
- Composite
- 27.62/100
- National rank
- #6927
- State rank
- #578 of 826 in TX
Livability — Houston
- Score
- 74/100
- State rank
- #184
- US rank
- #4771
Category grades
Schools grade is shown separately in the Schools card above.
Census & demographics
- Census place
- Houston, TX
- County
- Harris County · 4,702,590 people
- City population
- 3,226,434
- Metro
- Houston-The Woodlands-Sugar Land, TX
- Population (ZIP)
- 16,154
- Household income
- $48,279
- Rent vs Own
- Severe rent burden
- 457.0
Population outlook (Harris County) Hauer SSP2
- Today (2025)
- 5,571,493 people
- By 2030
- 6,089,821 · +9.3%
- By 2040
- 7,142,806 · +28.2%
- By 2050
- 8,185,864 · +46.9%
- By 2075
- 10,574,329 · +89.8%
- By 2100
- 12,109,958 · +117.4%
Race, ethnicity, and origin ACS 2023
- Neighborhood character
- Predominantly Hispanic (72%)
- Race & ethnicity
- Hispanic / Latino 72% Two or more races 32% Black 22% White 5%
- Hispanic origin (detail)
- Mexican 66%
- Foreign-born
- 31% · Canada
- Languages at home
- 39% English-only · Spanish 61%
Political lean MEDSL · Harris
- 2024 margin
- Lean D (+5.5) · D 52.0% · R 46.4% · Other 1.6%
- 2008→2024 swing
- +3.9pp toward D · 2008: 1.6pp · 2024: 5.5pp
- All cycles
- 2024: D+5.5 2020: D+13.3 2016: D+12.4 2012: D+0.1 2008: D+1.6
Not yet ingested
- Civics
- —
Market trends
- HPI YoY
- ▲ 18.53%
- Current HPI
- 276.1811
- Rent YoY
- —
- Metro
- Houston-The Woodlands-Sugar Land, TX
- State GDP YoY
- ▲ 3.95%
- F500 in state
- 110
Industry mix (Fortune 500 HQ in TX)
| Industry | F500 HQs | Revenue |
|---|---|---|
| Energy | 16 | $1,198B |
|
||
| Technology | 5 | $198B |
|
||
| Engineering / Construction | 4 | $72B |
|
||
| Energy Services | 3 | $60B |
|
||
| Utilities | 3 | $41B |
|
||
| Healthcare | 2 | $330B |
|
||
Price history
+2699.9% since first listed31 events — show timeline
- 2026-04-22 Relisted — HARMLS
- 2026-02-20 Pending — HARMLS
- 2026-01-13 Pending — HARMLS
- 2025-07-24 Relisted — HARMLS
- 2025-07-14 Pending — HARMLS
- 2025-04-16 Price Changed $349,990 HARMLS
- 2025-04-01 Listing Removed — HARMLS
- 2025-04-01 Listed $364,990 HARMLS
- 2025-01-22 Price Changed $374,990 HARMLS
- 2024-10-25 Listing Removed — HARMLS
- 2024-10-25 Listed $384,990 HARMLS
- 2024-06-21 Relisted — HARMLS
- 2024-06-05 Listing Removed — HARMLS
- 2024-05-10 Price Changed $384,990 HARMLS
- 2024-04-30 Price Changed $399,990 HARMLS
- 2024-04-29 Listed $400,000 HARMLS
- 2023-10-03 Sold (Public Records) — Public Records
- 2023-10-03 Sold (MLS) — HARMLS
- 2023-08-29 Pending — HARMLS
- 2023-08-25 Pending — HARMLS
- 2023-07-26 Price Changed $380,000 HARMLS
- 2023-07-13 Listed $390,000 HARMLS
- 2023-03-23 Sold (Public Records) — Public Records
- 2022-03-15 Sold (MLS) — HARMLS
- 2022-02-23 Pending — HARMLS
- 2022-02-14 Listed $45,000 HARMLS
- 2018-05-07 Sold (MLS) — HARMLS
- 2018-02-01 Pending — HARMLS
- 2018-02-01 Price Changed $14,500 HARMLS
- 2017-06-23 Listed $12,500 HARMLS
- 1988-01-02 Sold (Public Records) — Public Records
Property tax history
+31.1%/yrLatest (2025): $9,673 · +17.0% YoY. Source: county tax records.
Cash-flow waterfall
monthlySold comps — $/sqft
last 12 mo · ≤1 miLoading sold comps…