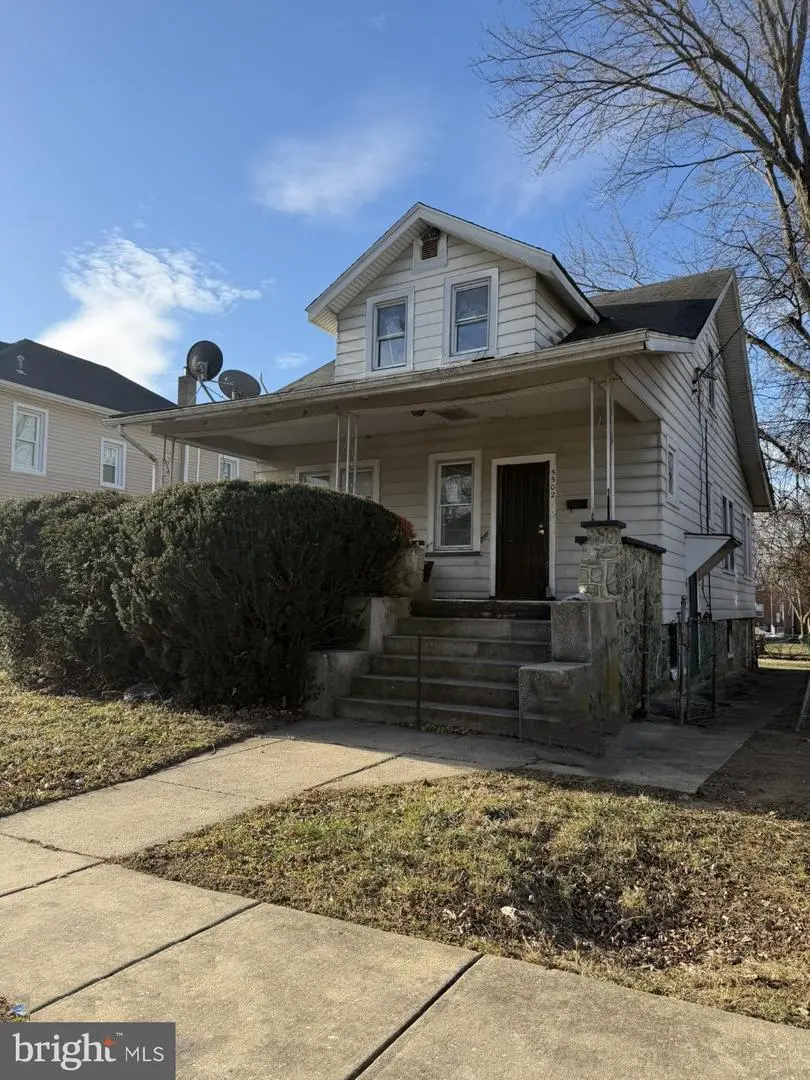
5502 Gist Ave · Baltimore, MD
Flood risk 1/10 · Minimal
- FEMA flood zone
- X (unshaded)
- Chance of flooding over 30 yrs
- 0.0%
- Est. flood insurance / yr
- $473 – $860
Fire risk 1/10 · Minimal
- Est. fire insurance / yr
- $755 – $1,403
Heat risk 7/10 · Major
- Hot days now (above 103°F)
- 7 days/yr
- Hot days in 30 yrs
- 15 days/yr
Wind risk 4/10 · Minor
- Chance of severe wind over 30 yrs
- 21.0%
Air-quality risk 3/10 · Minor
- Unhealthy air days now
- 3 days/yr
- Unhealthy air days in 30 yrs
- 4 days/yr
Risk factors via First Street. Map © Google.
Why this score? — see what drove the B- grade
The composite is a weighted blend of 9 inputs, each scored 0–100. Each bar is that input's sub-score; the figure is the points it added to the 100-point composite (weight × sub-score).
- Cash flow +25.6/30.0
- ARV discount +15.0/15.0
- DSCR +8.5/10.0
- 1% rule +7.5/10.0
- Livability +3.8/5.0
- Rent growth +3.1/5.0
- Condition / age +2.5/5.0
- Schools +1.0/10.0
- Appreciation +0.0/10.0
$170,000
🖨 Deal sheet 📄 Offer letter ✓ Due diligence
Listing remarks MLS
Traditional styled single family home, nestled in the heart of Baltimore City's Arlington neighborhood. Super layout with lots of space for a growing family. When you arrive, you are greeted by the covered front porch. Step inside and you will a grand foyer and the living room to the right. Continue your tour and you will see the separate dining , which is right off the kitchen in the back. The kitchen can be opened into the living room for a more open concept. You will also find a bedroom and a full bath on this level. Venture upstairs to the 2nd floor and you will find three spacious bedrooms. You will love the unfinished lower level as it gives you the opportunity to finish and create your own separate living space. The large and completely fenced-in backyard has a porch and patio area and greenspace that will allow you to enjoy your outdoor celebrations. Did I forget to mention that you also have lots of off-street parking? Well, you do! With easy access to public transportation and major highways, commuting is a breeze. Don't let this investment opportunity slip.
Key facts
- 8,542 sq ft lot
- Built 1939
- Listed 36 days
Neighborhood map
What this means for you Summary
Snapshot
- This is a 4-bed/2.0-bath single-family listed at $170k.
Deal economics
- At list price, monthly cash flow is $403 ($5k/yr) — positive.
- The deal already cash-flows at list — no discount required.
- Meets the 1% rule at list price ($2k rent vs $170k).
- Recommended offer: $165k (3.0% below list) — sets the bar for market timing.
- Cap rate 9.1% vs local median 6.0% in Baltimore — top-decile yield for the area; either an underpriced asset or a hidden risk that comps aren't pricing in. Stress-test before assuming the spread holds.
Location & tenants
- Location reads 76/100 on livability (#90 in MD, #3,396 nationally) — a middle-class / working-renter tenant base. Strengths: amenities A+, commute A+, housing A+; Watch: schools D, crime F.
- Baltimore City Public Schools (urban): math 7% / reading 16% proficiency, ranked #24 of 24 in MD (top 100%) — low school quality limits family demand, transient renter base, plan for 1-2y turnover; 79% free/reduced lunch — lower-income household profile, screen leases tightly.
- Market conditions: Rents rising (+2.4%/yr); 351 active listings in the ZIP; 15 comparable units currently listed for rent nearby; rentals at typical pace (median 24d on market — plan ~3-4 weeks tenant-placement turnaround); 40% of comp listings sitting > 30 days — soft ceiling on asking rent; 1,273 units permitted in Baltimore city in 2024 (1,104 in 5+ unit buildings).
- At $2,133/mo this rent would consume 50% of the median local household income ($52k/yr) (locally 3644% of renters already pay >50% of income on rent) — very limited rent-growth headroom before tenants either downsize or default.
Forward outlook
- Local home prices are declining (-3.0%/yr); year-one equity from $1k of loan paydown is wiped out by about $5k of value loss. Plan a longer hold.
- Baltimore County population projected to shrink 4% by 2050 — rents likely to lag national; underwrite the cash flow, not the appreciation.
Negotiation context
- It's been on market 36 days — a 3% lower offer ($165k) is reasonable based on typical stale-listing flexibility.
Risks & watch-outs
- Watch-outs: built in 1939 — expect roof / HVAC / electrical / plumbing capex.
- Climate carrying-cost: extreme-heat days projected 7→15/yr by 2055 (HVAC capex compounding) — expect insurance premiums to compound above CPI over the hold.
Questions for the listing agent
- It's been on market 36 days. Have you received any prior offers? Is the seller open to a 3% concession, seller financing, or rate buy-down credit?
- Built in 1939 — when were the roof, HVAC, electrical panel, plumbing, and water heater last replaced?
- Is there a deadline driving the sale (1031 exchange, divorce, estate, relocation)? That informs how much negotiation room exists.
- Schools are D-rated, which usually means shorter tenancies and higher turnover. Who's the typical renter profile here, and what's been the actual vacancy rate?
- Crime grade is F in this area — have there been break-ins, vandalism, or insurance claims at this property in the last 3 years? What carrier currently insures it and at what premium?
- What's the average days-on-market for RENTAL listings here right now (not sales)? A rising rental-DOM trend means longer vacancies and softer asking-rent achievability than the comps imply.
- What's the recent tenant-quality profile in this submarket — average credit score on applications, eviction rate, late-payment / NSF rate, and stable-employment percentage? A property-management company in the area should have these aggregated.
- How much new for-sale + rental construction is in the pipeline within 1–3 miles? Heavy new supply typically softens prices + rents 12–24 months out; constrained supply supports both.
Investment metrics
- 1% rule
- 1.25% ✓
- Cap rate
- 9.14%
- Cash-on-cash
- 10.17%
- DSCR
- 1.45
- GRM
- 6.6
CMA / ARV
- ARV (median comp)
- $244,308
- List price
- $170,000
- Delta
- -30.42%
- Verdict
- UNDERPRICED
- Comps
- 20 within 1.0 mi
Show comp detail 6 sales within ~0.75 mi
| Address | Dist | Beds/Ba | Sqft | Sold | Price | $/sf | Match |
|---|---|---|---|---|---|---|---|
| 5502 Gist Ave | 0.00mi | 4/1.0 | 1,180 (0%) | 0mo | $162,000 | $137 | 96 |
| 3813 Glen Ave | 0.32mi | 3/2.5 (-1) | 1,302 (+10%) | 3mo | $275,000 | $211 | 58 |
| 3413 Menlo Dr | 0.56mi | 5/3.0 (+1) | 1,274 (+8%) | 6mo | $349,000 | $274 | 47 |
| 3203 Glen Ave | 0.64mi | 3/2.0 (-1) | 1,200 (+2%) | 24mo | $200,000 | $167 | 42 |
| 3402 Parkington Ave | 0.65mi | 3/2.0 (-1) | 1,284 (+9%) | 13mo | $300,000 | $234 | 39 |
| 5808 Bland Ave | 0.66mi | 3/2.0 (-1) | 1,288 (+9%) | 18mo | $325,000 | $252 | 34 |
Match score weights: distance 35% · size 25% · config 20% · recency 20%. Top-matched comps best support the ARV.
Projected returns pro-forma
-3.0% appreciation · 2.41% rent growth · sell at horizon
- IRR
- -1.7%
- Equity multiple
- 0.94×
- Total profit
- $-3,018
- Equity at exit
- $25,348
- IRR
- 7.4%
- Equity multiple
- 1.54×
- Total profit
- $25,745
- Equity at exit
- $14,698
Cash invested: $47,600 (down + closing). Projections, not guarantees.
Landlord ↔ Tenant lean methodology
- Overall (CITY)
- 12 Strongly Tenant-Friendly
- State Maryland
- 27 Tenant-Leaning · D+14
- County
- — inherits STATE
- City Baltimore
- 12 Strongly Tenant-Friendly · D+58
ZIP-level market 21215
- Rents YoY
- 2.4%
- Active inventory
- 351
- Price-to-rent
- 6.6×
Monthly cashflow live
- Estimated rent
- $2,133 high interval (Pro) →
- Mortgage (P&I)
- −$891
- Tax from tax record
- −$320 /mo · $3,836/yr
- Insurance
- −$71
- HOA
- −$0
- Vacancy / Maint / Mgmt
- −$448
- Net cashflow
- $403
Break-even live
UW: 25.0% down · 7.5% · 30yr · 1.5% tax · 5.0% vac · 8.0% maint · 8.0% mgmt
Financing live
Cash to close
- Down payment
- $42,500
- Closing costs
- $5,100
- Reserves months
- —
- Total cash needed
- —
Loan-product check · same deal, 3 products live
Conventional
25% down · 7.5% · 30yr
- Down + closing
- —
- Monthly P&I
- —
- Monthly cashflow
- —
- DSCR
- —
- Eligible?
- —
Personal DTI + credit; lowest rate.
DSCR
20% down · 8.5% · 30yr
- Down + closing
- —
- Monthly P&I
- —
- Monthly cashflow
- —
- DSCR
- —
- Eligible?
- —
No personal income docs; deal must DSCR.
Hard money
10% down · 12.0% · 12mo
- Down + closing
- —
- Monthly P&I
- —
- Monthly cashflow
- —
- DSCR
- —
- Eligible?
- —
Short-term bridge; refi at stabilization.
Rent comps 15 comps
| Address | Beds | Baths | Sqft | Rent | $/sqft | DOM | Units | Dist |
|---|---|---|---|---|---|---|---|---|
| 3912 Mortimer Ave Baltimore, MD | 3.0 | 2.0 | 1204 | $2,723 | $2.26 | 43d | 1 | 0.15mi |
| 5301 Maple Ave Baltimore, MD | 3.0 | 1.0 | 960 | $1,700 | $1.77 | 43d | 1 | 0.58mi |
| 3784 Columbus Dr Baltimore, MD | 4.0 | 2.0 | 1250 | $2,200 | $1.76 | 23d | 1 | 0.91mi |
| 5115 Pembridge Ave Baltimore, MD | 3.0 | 2.0 | 1088 | $2,150 | $1.98 | 43d | 1 | 0.94mi |
| 3705 Midheights Rd Baltimore, MD | 3.0 | 1.5 | 1024 | $1,900 | $1.86 | 23d | 1 | 0.95mi |
| 3016 Thorndale Ave Baltimore, MD | 1.0–3.0 | 1.0 | 700 | $1,200 | $1.71 | 4d | 14 | 0.97mi |
| 3727 Milford Ave Gwynn Oak, MD | 3.0 | 1.0 | 900 | $1,450 | $1.61 | 43d | 1 | 1.13mi |
| 3607 Labyrinth Rd Baltimore, MD | 1.0–3.0 | 1.0–2.0 | 925 | $2,100 | $2.27 | 19d | 5 | 1.16mi |
| 3807 Bowers Ave Gwynn Oak, MD | 3.0 | 1.5 | 1152 | $2,200 | $1.91 | 43d | 1 | 1.19mi |
| 5801 Western Run Dr Baltimore, MD | 3.0 | 1.0–2.0 | 835 | $1,979 | $2.37 | 2d | 7 | 1.20mi |
| 6609 Eberle Dr Baltimore, MD | 1.0–3.0 | 1.0–2.0 | 1011 | $1,787 | $1.77 | 1d | 25 | 1.28mi |
| 3601 Howard Park Ave Unit 2 Baltimore, MD | 3.0 | 1.0 | 1000 | $1,650 | $1.65 | 43d | 1 | 1.30mi |
| 6310 Greenspring Ave Baltimore, MD | 2.0–3.0 | 1.5–2.0 | 1080 | $1,940 | $1.80 | 3d | 6 | 1.42mi |
| 4230 Towanda Ave Baltimore, MD | 3.0 | 2.0 | 1400 | $1,800 | $1.29 | 17d | 1 | 1.43mi |
| 2915 Oakford Ave Baltimore, MD | 3.0 | 2.0 | 1102 | $1,600 | $1.45 | 17d | 1 | 1.44mi |
Listing history 1 events
-
2026-04-14$170,000 Active 1084-char remark
Show marketing remark (1084 chars)
Traditional styled single family home, nestled in the heart of Baltimore City's Arlington neighborhood. Super layout with lots of space for a growing family. When you arrive, you are greeted by the covered front porch. Step inside and you will a grand foyer and the living room to the right. Continue your tour and you will see the separate dining , which is right off the kitchen in the back. The kitchen can be opened into the living room for a more open concept. You will also find a bedroom and a full bath on this level. Venture upstairs to the 2nd floor and you will find three spacious bedrooms. You will love the unfinished lower level as it gives you the opportunity to finish and create your own separate living space. The large and completely fenced-in backyard has a porch and patio area and greenspace that will allow you to enjoy your outdoor celebrations. Did I forget to mention that you also have lots of off-street parking? Well, you do! With easy access to public transportation and major highways, commuting is a breeze. Don't let this investment opportunity slip.
ⓘ Source: listings_history table (triggers on properties + properties_extension) + one-shot
backfill from property_details.listing_events for pre-trigger history.
Tax reassessment forecast MD · Partial reset (capped growth)
- Current annual tax
- $3,836 · $320/mo
- Projected year-2 tax
- $3,836 · $320/mo
- Expected delta
- $0/yr ($0/mo · 0.0%)
ⓘ Screening estimate from a state-policy table — verify with the county assessor before closing.
Climate risk First Street
- Flood 1/10 Low FEMA zone X (unshaded) · 0% chance over 30 yrs
- Wildfire 1/10 Low
- Heat 7/10 Severe 7 d/yr ≥103°F today · 15 d/yr by 30 yrs out
- Wind 4/10 Moderate 21% chance of damaging wind over 30 yrs
- Air quality 3/10 Moderate 3 unhealthy d/yr today · 4 by 30 yrs out
Nearby sold comps map
Loading sold comps map…
Walkable amenities ~0.75 mi
Loading nearby amenities…
Taxation est. · year 1
- Rental income
- $25,601
- − Mortgage interest
- −$9,523
- − Property taxes
- −$3,836
- − Insurance
- −$850
- − Repairs & maintenance
- −$2,048
- − Management
- −$2,048
- − Depreciation
- −$4,945
- Taxable income
- $2,350
- Est. tax owed @ 24.0%
- −$564
- After-tax cash flow
- $4,276/yr
For passive investors: Depreciation is non-cash, so a rental often shows a tax loss while cash-flowing — sheltering income. Rental losses are passive: they offset passive income freely, and up to $25,000/yr can offset ordinary (W-2) income if you actively participate and your MAGI is under $100k (phasing out to $0 by $150k); unused losses carry forward. On sale, claimed depreciation is recaptured at up to 25%, and gains may owe capital-gains tax (a 1031 exchange can defer both). Figures are a year-1 estimate at your 24.0% rate — not tax advice; consult a CPA.
Schools (NCES district)
- District
- Baltimore City Public Schools
- NCES district ID
- 2400090
- Math proficiency
- 7% ▼ -9.00%
- Reading proficiency
- 16% ▼ -5.00%
- Median HH income
- $42,108
- Composite
- 10.08/100
- National rank
- #9805
- State rank
- #24 of 24 in MD
Livability — Baltimore
- Score
- 76/100
- State rank
- #90
- US rank
- #3396
Category grades
Schools grade is shown separately in the Schools card above.
Census & demographics
- Census place
- Baltimore, MD
- County
- Baltimore City · 558,601 people
- City population
- 588,727
- Metro
- Baltimore-Columbia-Towson, MD
- Population (ZIP)
- 52,229
- Household income
- $51,587
- Rent vs Own
- Severe rent burden
- 3644.0
Population outlook (Baltimore County) Hauer SSP2
- Today (2025)
- 624,249 people
- By 2030
- 621,541 · -0.4%
- By 2040
- 609,756 · -2.3%
- By 2050
- 597,249 · -4.3%
- By 2075
- 552,236 · -11.5%
- By 2100
- 513,934 · -17.7%
Race, ethnicity, and origin ACS 2023
- Neighborhood character
- Predominantly Black (73%)
- Race & ethnicity
- Black 73% White 17% Hispanic / Latino 5% Two or more races 4% Asian 1%
- Common ancestry
- Scotch-Irish 2% Romanian 2% Italian 1%
- Foreign-born
- 9% · Canada, South Korea
- Languages at home
- 91% English-only · Spanish 4% French/Haitian/Cajun 1% Other Indo-European 1%
Political lean MEDSL · Baltimore
- 2024 margin
- Solid D (+73.0) · D 85.2% · R 12.2% · Other 2.6%
- 2008→2024 swing
- -2.5pp toward R · 2008: 75.5pp · 2024: 73.0pp
- All cycles
- 2024: D+73.0 2020: D+76.6 2016: D+74.6 2012: D+76.4 2008: D+75.5
Not yet ingested
- Civics
- —
Market trends
- HPI YoY
- ▼ -318.58%
- Current HPI
- 291.4926
- Rent YoY
- ▲ 2.41%
- Metro
- Baltimore-Columbia-Towson, MD
- State GDP YoY
- ▲ 2.97%
- F500 in state
- 12
Industry mix (Fortune 500 HQ in MD)
| Industry | F500 HQs | Revenue |
|---|---|---|
| Aerospace / Defense | 1 | $71B |
|
||
| Utilities | 1 | $25B |
|
||
| Hotels | 1 | $24B |
|
||
| Consumer Goods | 1 | $7B |
|
||
| Real Estate | 1 | $6B |
|
||
| Chemicals | 1 | $2B |
|
||
Price history
1 event — show timeline
- 2026-04-14 Listed $170,000 BRIGHT MLS
Property tax history
+0.1%/yrLatest (2025): $3,836 · +4.4% YoY. Source: county tax records.
Cash-flow waterfall
monthlySold comps — $/sqft
last 12 mo · ≤1 miLoading sold comps…