10621 Lovegrass Seed Ln · Pasadena Hills, FL
Flood risk 1/10 · Minimal
- FEMA flood zone
- X (unshaded)
- Chance of flooding over 30 yrs
- 0.0%
- Est. flood insurance / yr
- $507 – $1,088
Fire risk 5/10 · Moderate
- Est. fire insurance / yr
- $947 – $1,759
Heat risk 9/10 · Severe
- Hot days now (above 109°F)
- 7 days/yr
- Hot days in 30 yrs
- 25 days/yr
Wind risk 10/10 · Severe
- Chance of severe wind over 30 yrs
- 99.0%
Air-quality risk 2/10 · Minimal
- Unhealthy air days now
- 2 days/yr
- Unhealthy air days in 30 yrs
- 2 days/yr
Risk factors via First Street. Map © Google.
Why this score? — see what drove the F grade
The composite is a weighted blend of 9 inputs, each scored 0–100. Each bar is that input's sub-score; the figure is the points it added to the 100-point composite (weight × sub-score).
- Cash flow +8.7/30.0
- ARV discount +4.4/15.0
- Schools +4.3/10.0
- Appreciation +3.8/10.0
- Livability +3.2/5.0
- 1% rule +2.7/10.0
- Rent growth +2.6/5.0
- Condition / age +2.5/5.0
- DSCR +2.4/10.0
$289,900
🖨 Deal sheet 📄 Offer letter ✓ Due diligence
Listing remarks
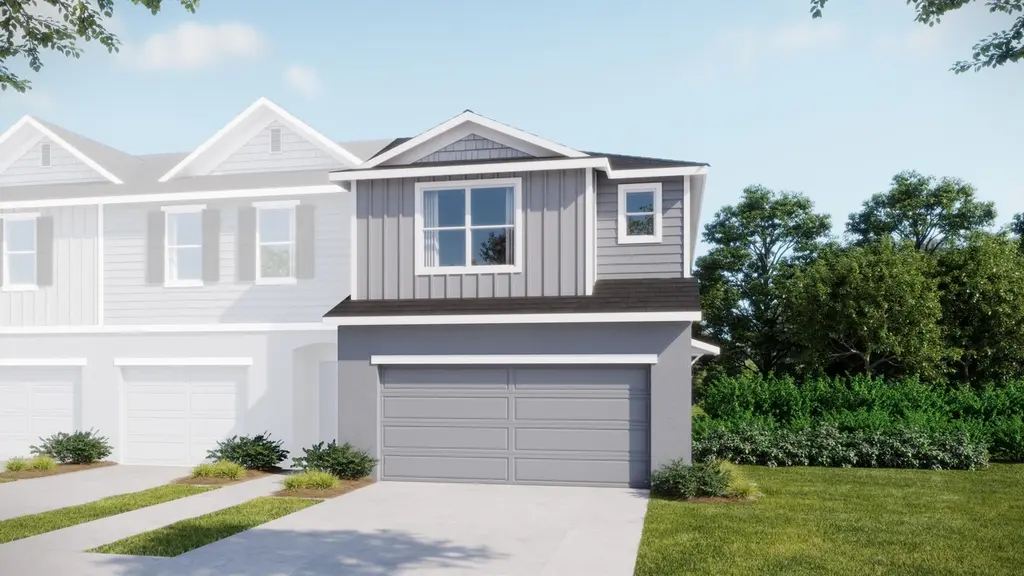
Welcome to The St. Sebastian - Your Ideal Townhome Awaits! Looking for the perfect townhome? The St. Sebastian offers spacious, comfortable living with 3 bedrooms, 2 bathrooms, and a 2-car garage-all spread across over 1,600 square feet. The main floor features an open-concept layout, seamlessly connecting a modern kitchen with the dining and living areas-ideal for entertaining and everyday family life. Upstairs, retreat to the three bedrooms, including a luxurious master suite complete with a spa-inspired bathroom. Enjoy your own private backyard, perfect for summer barbecues and relaxing with friends and family. Don't miss your chance to call The St. Sebastian home-schedule a tour today!
Key facts
- Private backyard
- Modern kitchen
- Open-concept layout
Tags
Property features AI
Finance
- Financial info: List price $289,900
Exterior
- Parking: 2 total parking spaces; 2-car garage
- Home design: Single-family residence (St Sebastian plan)
- Exterior features: Address: 10621 Lovegrass Seed Ln, San Antonio, FL 33576
Interior
- Bedrooms: 3 bedrooms
- Bathrooms: 2 full bathrooms and 1 half bathroom (2.5 total)
- Interior features: Spec home — St Sebastian plan; Living area approximately 1,684
Neighborhood map
What this means for you Summary
Snapshot
- This is a 3-bed/2.5-bath townhouse listed at $290k.
Deal economics
- At list price, monthly cash flow is $-245 ($-3k/yr) — negative.
- To cash-flow at today's rent, offer at most $254k (12.2% below list).
- To meet the 1% rule (rent ≥ 1% of price), the offer needs to be $223k (23.2% below list).
- Recommended offer: $223k (23.2% below list) — sets the bar for 1% rule.
- Cap rate 5.3% vs local median 3.7% in Pasadena Hills — top-decile yield for the area; either an underpriced asset or a hidden risk that comps aren't pricing in. Stress-test before assuming the spread holds.
Location & tenants
- Location reads 63/100 on livability (#723 in FL) — a middle-class / working-renter tenant base. Strengths: housing A+, crime A-, cost of living A-; Watch: schools F, amenities F, commute F.
- Pasco (suburban): math 50% / reading 52% proficiency, ranked #32 of 73 in FL (top 44%) — acceptable for families but not a draw, mixed tenant base, ~2y average lease.
- Market conditions: Rents flat; 364 active listings in the ZIP; 40 comparable units currently listed for rent nearby; rentals at typical pace (median 25d on market — plan ~3-4 weeks tenant-placement turnaround); solid renter incomes; 6,765 units permitted in Pasco County in 2024 (1,250 in 5+ unit buildings).
- This rent runs 35% of the median local income ($76k/yr) — at the standard rent-burdened threshold; future hikes will face affordability resistance.
Forward outlook
- Local home prices are declining (-2.3%/yr); year-one equity from $2k of loan paydown is wiped out by about $7k of value loss. Plan a longer hold.
- Pasco County population projected at +29% by 2050 — long-run rental-demand tailwind backs the buy-and-hold thesis.
Negotiation context
- Only 2 days on market — expect competitive offers; lowballing is unlikely to land.
Risks & watch-outs
- Climate carrying-cost: severe wind risk, 99% chance of damaging wind over 30y; moderate wildfire risk; extreme-heat days projected 7→25/yr by 2055 (HVAC capex compounding) — expect insurance premiums to compound above CPI over the hold.
Questions for the listing agent
- What do current leases actually rent for vs. the listed asking? Can we see a recent rent roll and the last 12 months of T-12 income?
- Is there a deadline driving the sale (1031 exchange, divorce, estate, relocation)? That informs how much negotiation room exists.
- Schools are F-rated, which usually means shorter tenancies and higher turnover. Who's the typical renter profile here, and what's been the actual vacancy rate?
- The area grade is low — what's the realistic commute time and amenity access for the typical tenant pool here? Any planned neighborhood developments (good or bad) we should know about?
- What's the average days-on-market for RENTAL listings here right now (not sales)? A rising rental-DOM trend means longer vacancies and softer asking-rent achievability than the comps imply.
- What's the recent tenant-quality profile in this submarket — average credit score on applications, eviction rate, late-payment / NSF rate, and stable-employment percentage? A property-management company in the area should have these aggregated.
- How much new for-sale + rental construction is in the pipeline within 1–3 miles? Heavy new supply typically softens prices + rents 12–24 months out; constrained supply supports both.
Investment metrics
- 1% rule
- 0.77% ✗
- Cap rate
- 5.28%
- Cash-on-cash
- -3.62%
- DSCR
- 0.84
- GRM
- 10.9
CMA / ARV
- ARV (on-the-fly)
- $271,124
- Comps found
- 12
Show comp detail 12 sales within ~0.75 mi
| Address | Dist | Beds/Ba | Sqft | Sold | Price | $/sf | Match |
|---|---|---|---|---|---|---|---|
| 10171 Trumpet Honeysuckle Way | 0.27mi | 3/2.5 | 1,634 (-3%) | 10mo | $245,900 | $150 | 74 |
| 10233 Trumpet Honeysuckle Way | 0.28mi | 3/2.5 | 1,634 (-3%) | 11mo | $236,850 | $145 | 73 |
| 10186 Trumpet Honeysuckle Way | 0.24mi | 3/2.5 | 1,787 (+6%) | 10mo | $288,500 | $161 | 70 |
| 10646 Ironwood Tree Way | 0.63mi | 3/2.5 | 1,666 (-1%) | 2mo | $264,900 | $159 | 67 |
| 10647 Ironwood Tree Way | 0.65mi | 3/2.5 | 1,684 (0%) | 6mo | $304,200 | $181 | 65 |
| 10653 Ironwood Tree Way | 0.65mi | 3/2.5 | 1,684 (0%) | 6mo | $276,050 | $164 | 65 |
| 10670 Ironwood Tree Way | 0.65mi | 3/2.5 | 1,639 (-3%) | 3mo | $252,900 | $154 | 63 |
| 10663 Ironwood Tree Way | 0.66mi | 3/2.5 | 1,639 (-3%) | 4mo | $276,900 | $169 | 62 |
| 32122 Eastern Redbud Br | 0.73mi | 3/2.5 | 1,694 (+1%) | 6mo | $264,900 | $156 | 60 |
| 32128 Eastern Redbud Br | 0.73mi | 3/2.5 | 1,694 (+1%) | 6mo | $289,900 | $171 | 60 |
| 10193 Trumpet Honeysuckle Way | 0.27mi | 2/2.5 (-1) | 1,541 (-8%) | 11mo | $234,400 | $152 | 59 |
| 32132 Eastern Redbud Br | 0.73mi | 3/2.5 | 1,694 (+1%) | 10mo | $276,900 | $163 | 57 |
Match score weights: distance 35% · size 25% · config 20% · recency 20%. Top-matched comps best support the ARV.
Projected returns pro-forma
-2.32% appreciation · 0.37% rent growth · sell at horizon
- IRR
- -20.2%
- Equity multiple
- 0.26×
- Total profit
- $-59,946
- Equity at exit
- $52,093
- IRR
- -18.4%
- Equity multiple
- -0.07×
- Total profit
- $-87,181
- Equity at exit
- $40,566
Cash invested: $81,172 (down + closing). Projections, not guarantees.
Landlord ↔ Tenant lean methodology
- Overall (STATE)
- 87 Strongly Landlord-Friendly
- State Florida
- 87 Strongly Landlord-Friendly · R+3
- County
- — inherits STATE
- City
- — inherits STATE
ZIP-level market 33576
- Home prices YoY
- -0.8%
- Rents YoY
- 0.4%
- Active inventory
- 364
- Price-to-rent
- 10.9×
Monthly cashflow live
- Estimated rent
- $2,226 high interval (Pro) →
- Mortgage (P&I)
- −$1,520
- Tax est. 1.5%
- −$362 /mo · $4,348/yr
- Insurance
- −$121
- HOA
- −$0
- Vacancy / Maint / Mgmt
- −$467
- Net cashflow
- $-245
Break-even live
UW: 25.0% down · 7.5% · 30yr · 1.5% tax · 5.0% vac · 8.0% maint · 8.0% mgmt
Financing live
Cash to close
- Down payment
- $72,475
- Closing costs
- $8,697
- Reserves months
- —
- Total cash needed
- —
Loan-product check · same deal, 3 products live
Conventional
25% down · 7.5% · 30yr
- Down + closing
- —
- Monthly P&I
- —
- Monthly cashflow
- —
- DSCR
- —
- Eligible?
- —
Personal DTI + credit; lowest rate.
DSCR
20% down · 8.5% · 30yr
- Down + closing
- —
- Monthly P&I
- —
- Monthly cashflow
- —
- DSCR
- —
- Eligible?
- —
No personal income docs; deal must DSCR.
Hard money
10% down · 12.0% · 12mo
- Down + closing
- —
- Monthly P&I
- —
- Monthly cashflow
- —
- DSCR
- —
- Eligible?
- —
Short-term bridge; refi at stabilization.
Rent comps 40 comps
| Address | Beds | Baths | Sqft | Rent | $/sqft | DOM | Units | Dist |
|---|---|---|---|---|---|---|---|---|
| 10019 Curley Rd San Antonio, FL | 4.0 | 2.0 | 1304 | $1,900 | $1.46 | 24d | 1 | 0.14mi |
| 10171 Trumpet Honeysuckle Way San Antonio, FL | 3.0 | 2.5 | 1634 | $1,900 | $1.16 | 24d | 1 | 0.24mi |
| 10114 Honey Hammock Way San Antonio, FL | 3.0 | 2.5 | 1634 | $1,895 | $1.16 | 20d | 1 | 0.25mi |
| 10110 Honey Hammock Way San Antonio, FL | 2.0 | 2.5 | 1513 | $1,995 | $1.32 | 24d | 1 | 0.25mi |
| 10250 Honey Hammock Way San Antonio, FL | 3.0 | 2.5 | 1676 | $1,979 | $1.18 | 24d | 1 | 0.28mi |
| 10334 Trumpet Honeysuckle Way San Antonio, FL | 3.0 | 3.0 | 1634 | $2,000 | $1.22 | 24d | 1 | 0.28mi |
| 10121 Honey Hammock Way San Antonio, FL | 3.0 | 2.5 | 1666 | $2,100 | $1.26 | 24d | 1 | 0.28mi |
| 10321 Trumpet Honeysuckle Way San Antonio, FL | 3.0 | 2.5 | 1666 | $2,000 | $1.20 | 22d | 1 | 0.29mi |
| 10375 Trumpet Honeysuckle Way San Antonio, FL | 3.0 | 2.5 | 1666 | $2,000 | $1.20 | 18d | 1 | 0.33mi |
| 32201 Powderpuff Mimosa Dr San Antonio, FL | 3.0 | 3.0 | 1634 | $2,050 | $1.25 | 24d | 1 | 0.36mi |
| 32067 Spiceberry St San Antonio, FL | 3.0 | 2.5 | 1634 | $2,000 | $1.22 | 5d | 1 | 0.36mi |
| 9853 Branching Ship Trce Wesley Chapel, FL | 4.0 | 2.0 | 1817 | $2,650 | $1.46 | 12d | 1 | 0.38mi |
| 32146 Powderpuff Mimosa Dr San Antonio, FL | 3.0 | 2.5 | 1801 | $2,050 | $1.14 | 20d | 1 | 0.39mi |
| 32127 Powderpuff Mimosa Dr San Antonio, FL | 3.0 | 2.5 | 1634 | $2,100 | $1.29 | 24d | 1 | 0.41mi |
| 32009 Spiceberry St San Antonio, FL | 2.0 | 2.5 | 1513 | $1,900 | $1.26 | 18d | 1 | 0.41mi |
| 32010 Spiceberry St Wesley Chapel, FL | 3.0 | 2.5 | 1634 | $2,100 | $1.29 | 12d | 1 | 0.42mi |
| 32077 Powderpuff Mimosa Dr San Antonio, FL | 2.0 | 2.5 | 1541 | $2,100 | $1.36 | 24d | 1 | 0.46mi |
| 10443 Lavender Aster Trl San Antonio, FL | 3.0 | 2.5 | 1666 | $1,950 | $1.17 | 24d | 1 | 0.51mi |
| 9864 Allendale St Wesley Chapel South, FL | 3.0 | 2.5 | 1666 | $2,100 | $1.26 | 24d | 1 | 0.56mi |
| 10583 Tupper Cay Dr San Antonio, FL | 3.0 | 2.0 | 1770 | $2,950 | $1.67 | 4d | 1 | 0.60mi |
| 31921 Conchshell Sail St Wesley Chapel, FL | 3.0–4.0 | 2.5 | 1793 | $2,599 | $1.45 | 2d | 7 | 0.60mi |
| 10647 Ironwood Tree Way San Antonio, FL | 3.0 | 2.5 | 1712 | $2,400 | $1.40 | 24d | 1 | 0.61mi |
| 9851 Feaster Dr Wesley Chapel, FL | 3.0 | 2.5 | 1666 | $1,800 | $1.08 | 20d | 1 | 0.61mi |
| 10708 Ironwood Tree Way San Antonio, FL | 3.0 | 2.5 | 1600 | $2,100 | $1.31 | 18d | 1 | 0.65mi |
| 32118 Pond Apple Bnd San Antonio, FL | 3.0 | 2.5 | 1732 | $2,400 | $1.39 | 24d | 1 | 0.65mi |
| 32112 Pond Apple Bnd Unit 1 San Antonio, FL | 3.0 | 2.5 | 1700 | $2,000 | $1.18 | 24d | 1 | 0.66mi |
| 10715 Ironwood Tree Way San Antonio, FL | 3.0 | 2.5 | 1681 | $2,050 | $1.22 | 15d | 1 | 0.66mi |
| 9493 Rally Spring Loop Wesley Chapel, FL | 4.0 | 3.0 | 2207 | $2,500 | $1.13 | 22d | 1 | 0.68mi |
| 9610 Rally Spring Loop Wesley Chapel, FL | 3.0 | 2.0 | 2020 | $2,750 | $1.36 | 5d | 1 | 0.69mi |
| 31856 Cardinal Yard Dr San Antonio, FL | 2.0 | 2.0 | 1783 | $2,500 | $1.40 | 24d | 1 | 0.70mi |
| 32067 Eastern Redbud Br San Antonio, FL | 3.0 | 2.5 | 1639 | $2,250 | $1.37 | 24d | 1 | 0.74mi |
| 10817 Ironwood Tree Way San Antonio, FL | 3.0 | 2.5 | 1694 | $2,250 | $1.33 | 2d | 1 | 0.75mi |
| 10817 Ironwood Tree Way San Antonio, FL | 3.0 | 2.5 | 1694 | $2,250 | $1.33 | 24d | 1 | 0.75mi |
| 10888 Quail Grove Way San Antonio, FL | 3.0 | 2.0 | 1690 | $2,400 | $1.42 | 24d | 1 | 0.81mi |
| 10959 Cotton Vale Pl San Antonio, FL | 3.0 | 2.0 | 1844 | $2,100 | $1.14 | 20d | 1 | 0.83mi |
| 10959 Cotton Vale Pl San Antonio, FL | 3.0 | 2.0 | 1844 | $2,100 | $1.14 | 3d | 1 | 0.83mi |
| 11672 Radiant Shore Loop San Antonio, FL | 4.0 | 2.5 | 1870 | $2,495 | $1.33 | 15d | 1 | 0.91mi |
| 11545 Radiant Shore Loop San Antonio, FL | 3.0 | 2.0 | 1451 | $2,250 | $1.55 | 24d | 1 | 0.95mi |
| 10462 Weldon Cork Way San Antonio, FL | 2.0 | 2.5 | 1747 | $2,200 | $1.26 | 15d | 1 | 0.96mi |
| 32094 Hawthorne Cottage Pl San Antonio, FL | 4.0 | 2.0 | 1936 | $2,795 | $1.44 | 24d | 1 | 0.98mi |
Listing history 3 events
-
2026-06-18days on market $289,900 Active 2 DOM
-
2026-06-17remarks 698-char remark
-
2026-06-17$289,900 Active 1 DOM
ⓘ Source: listings_history table (triggers on properties + properties_extension) + one-shot
backfill from property_details.listing_events for pre-trigger history.
Climate risk First Street
- Flood 1/10 Low FEMA zone X (unshaded) · 0% chance over 30 yrs
- Wildfire 5/10 Major
- Heat 9/10 Extreme 7 d/yr ≥109°F today · 25 d/yr by 30 yrs out
- Wind 10/10 Extreme 99% chance of damaging wind over 30 yrs
- Air quality 2/10 Low 2 unhealthy d/yr today · 2 by 30 yrs out
Nearby sold comps map
Loading sold comps map…
Walkable amenities ~0.75 mi
Loading nearby amenities…
Taxation est. · year 1
- Rental income
- $26,712
- − Mortgage interest
- −$16,239
- − Property taxes
- −$4,348
- − Insurance
- −$1,450
- − Repairs & maintenance
- −$2,137
- − Management
- −$2,137
- − Depreciation
- −$8,433
- Taxable loss
- −$8,033
- Est. tax savings @ 24.0%
- +$1,928
- After-tax cash flow
- $-1,011/yr
For passive investors: Depreciation is non-cash, so a rental often shows a tax loss while cash-flowing — sheltering income. Rental losses are passive: they offset passive income freely, and up to $25,000/yr can offset ordinary (W-2) income if you actively participate and your MAGI is under $100k (phasing out to $0 by $150k); unused losses carry forward. On sale, claimed depreciation is recaptured at up to 25%, and gains may owe capital-gains tax (a 1031 exchange can defer both). Figures are a year-1 estimate at your 24.0% rate — not tax advice; consult a CPA.
Schools (NCES district)
- District
- Pasco
- NCES district ID
- 1201530
- Math proficiency
- 50% ▼ -10.00%
- Reading proficiency
- 52% ▼ -5.00%
- Median HH income
- $45,039
- Composite
- 43.14/100
- National rank
- #3074
- State rank
- #32 of 73 in FL
Livability — Pasadena Hills
- Score
- 63/100
- State rank
- #723
- US rank
- #15499
Category grades
Schools grade is shown separately in the Schools card above.
Census & demographics
- County
- Pasco County · 524,098 people
- Metro
- Tampa-St. Petersburg-Clearwater, FL
- Population (ZIP)
- 6,273
- Household income
- $76,388
- Rent vs Own
- Severe rent burden
- 31.0
Population outlook (Pasco County) Hauer SSP2
- Today (2025)
- 570,045 people
- By 2030
- 605,844 · +6.3%
- By 2040
- 674,806 · +18.4%
- By 2050
- 736,022 · +29.1%
- By 2075
- 862,900 · +51.4%
- By 2100
- 906,364 · +59.0%
Race, ethnicity, and origin ACS 2023
- Neighborhood character
- Predominantly White (81%)
- Race & ethnicity
- White 81% Hispanic / Latino 12% Two or more races 5% Black 5%
- Hispanic origin (detail)
- Mexican 3% Puerto Rican 5%
- Common ancestry
- Romanian 5% Lithuanian 3% Slovak 2%
- Foreign-born
- 7% · Canada
- Languages at home
- 91% English-only · Spanish 6% Other Indo-European 1%
Political lean MEDSL · Pasco
- 2024 margin
- Strong R (+25.2) · D 36.9% · R 62.1% · Other 1.0%
- 2008→2024 swing
- -21.6pp toward R · 2008: -3.6pp · 2024: -25.2pp
- All cycles
- 2024: R+25.2 2020: R+20.1 2016: R+21.6 2012: R+6.7 2008: R+3.6
Not yet ingested
- Civics
- —
Market trends
- HPI YoY
- ▼ -2.32%
- Current HPI
- 281.7138
- Rent YoY
- ▲ 0.37%
- Metro
- Tampa-St. Petersburg-Clearwater, FL
- State GDP YoY
- ▲ 3.28%
- F500 in state
- 36
Industry mix (Fortune 500 HQ in FL)
| Industry | F500 HQs | Revenue |
|---|---|---|
| Industrial Technology | 2 | $29B |
|
||
| Insurance | 2 | $17B |
|
||
| Retail | 1 | $60B |
|
||
| Technology Distribution | 1 | $58B |
|
||
| Homebuilding | 1 | $35B |
|
||
| Technology Manufacturing | 1 | $35B |
|
||
Cash-flow waterfall
monthlySold comps — $/sqft
last 12 mo · ≤1 miLoading sold comps…