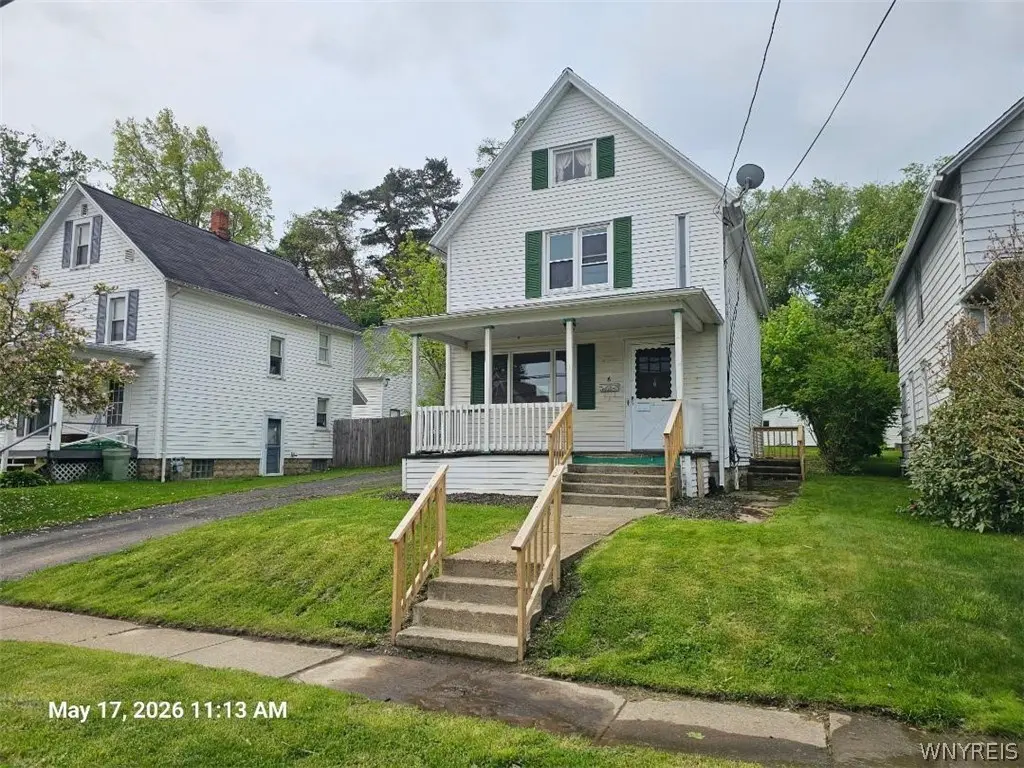
6 Ward Ave · Silver Creek, NY
Flood risk 1/10 · Minimal
- FEMA flood zone
- X
- Chance of flooding over 30 yrs
- 0.0%
- Est. flood insurance / yr
- $473 – $860
Fire risk 3/10 · Minor
- Est. fire insurance / yr
- $691 – $1,283
Heat risk 2/10 · Minimal
- Hot days now (above 93°F)
- 7 days/yr
- Hot days in 30 yrs
- 16 days/yr
Wind risk 1/10 · Minimal
- Chance of severe wind over 30 yrs
- —
Air-quality risk 2/10 · Minimal
- Unhealthy air days now
- 1 days/yr
- Unhealthy air days in 30 yrs
- 2 days/yr
Risk factors via First Street. Map © Google.
Why this score? — see what drove the B- grade
The composite is a weighted blend of 9 inputs, each scored 0–100. Each bar is that input's sub-score; the figure is the points it added to the 100-point composite (weight × sub-score).
- Cash flow +30.0/30.0
- 1% rule +10.0/10.0
- DSCR +10.0/10.0
- ARV discount +7.5/15.0
- Schools +4.0/10.0
- Livability +3.2/5.0
- Rent growth +2.5/5.0
- Condition / age +2.5/5.0
- Appreciation +0.0/10.0
$59,900
🖨 Deal sheet 📄 Offer letter ✓ Due diligence
Listing remarks
Great Curb Appeal, 3-bedroom 1.5 bath Colonial, Open front Porch and rear deck for outdoor enjoyment and entertaining, , Eat in Kitchen and formal dining room .
Key facts
- Formal dining room
- Eat in kitchen
- Open front porch
Tags
Property features AI
Finance
- Other: Assessed value listed; Annual tax information available
- Financial info: Property has a land lease
Exterior
- Parking: No garage
- Utilities: Public water (connected); Sewer connected
- Home design: 2-story home; Existing structure; Resale property
- Construction: Aluminum siding; Vinyl siding; Asphalt roof; Block foundation
- Exterior features: Concrete driveway; Rectangular lot (50 x 150)
Interior
- Kitchen: Eat-in kitchen
- Bedrooms: Total rooms: 8; Basement present (full)
- Flooring: Hardwood; Varied flooring types
- Bathrooms: 1 full bathroom; 1 half bathroom; 1 main-level bathroom
- Heating & cooling: Gas heating; Baseboard heating; Hot water heating
- Interior features: Ceiling fans; Separate/formal dining room; Entrance foyer; Eat-in kitchen; Separate/formal living room; Additional interior features noted in remarks
- Laundry & utility: Gas water heater
Neighborhood map
What this means for you Summary
Snapshot
- This is a 3-bed/1.5-bath single-family listed at $60k.
Deal economics
- At list price, monthly cash flow is $512 ($6k/yr) — positive.
- The deal already cash-flows at list — no discount required.
- Meets the 1% rule at list price ($1k rent vs $60k).
- Recommended offer: $59k (1.5% below list) — sets the bar for market timing.
Location & tenants
- Location reads 65/100 on livability (#698 in NY) — a middle-class / working-renter tenant base. Strengths: cost of living A+, housing A+, crime A-; Watch: amenities F, commute F, health & safety F.
- Silver Creek Central School District (rural): math 43% / reading 51% proficiency, ranked #435 of 590 in NY (top 74%) — families likely to look elsewhere, expect single-tenant / working-renter base with shorter leases.
- Market conditions: 29 active listings in the ZIP; 127 units permitted in Chautauqua County in 2024 (0 in 5+ unit buildings).
Forward outlook
- Local home prices are declining (-3.0%/yr); year-one equity from $414 of loan paydown is wiped out by about $2k of value loss. Plan a longer hold.
- Chautauqua County population projected at -22% by 2050 — secular population decline; favor cash flow + early exit over multi-decade hold.
- At projected returns (-3.0% appreciation + 3.0% rent growth), your $17k cash investment doubles in ~4 years — after that, you're playing with house money.
Negotiation context
- It's been on market 22 days — a 2% lower offer ($59k) is reasonable based on typical stale-listing flexibility.
Risks & watch-outs
- Watch-outs: built in 1900 — expect roof / HVAC / electrical / plumbing capex.
Questions for the listing agent
- Built in 1900 — when were the roof, HVAC, electrical panel, plumbing, and water heater last replaced?
- Is there a deadline driving the sale (1031 exchange, divorce, estate, relocation)? That informs how much negotiation room exists.
- What's the average days-on-market for RENTAL listings here right now (not sales)? A rising rental-DOM trend means longer vacancies and softer asking-rent achievability than the comps imply.
- What's the recent tenant-quality profile in this submarket — average credit score on applications, eviction rate, late-payment / NSF rate, and stable-employment percentage? A property-management company in the area should have these aggregated.
- How much new for-sale + rental construction is in the pipeline within 1–3 miles? Heavy new supply typically softens prices + rents 12–24 months out; constrained supply supports both.
Investment metrics
- 1% rule
- 1.96% ✓
- Cap rate
- 16.54%
- Cash-on-cash
- 36.61%
- DSCR
- 2.63
- GRM
- 4.3
CMA / ARV
- ARV (on-the-fly)
- $150,800
- Comps found
- 5
Show comp detail 5 sales within ~0.75 mi
| Address | Dist | Beds/Ba | Sqft | Sold | Price | $/sf | Match |
|---|---|---|---|---|---|---|---|
| 122 Main St | 0.09mi | 3/1.5 | 1,181 (-9%) | 9mo | $146,000 | $124 | 73 |
| 12194 Old Main Rd | 0.47mi | 2/1.5 (-1) | 1,285 (-1%) | 18mo | $190,000 | $148 | 56 |
| 320 Central Ave | 0.66mi | 3/2.0 | 1,418 (+9%) | 2mo | $165,000 | $116 | 50 |
| 22 Hickory St | 0.71mi | 3/1.5 | 1,197 (-8%) | 14mo | $129,900 | $109 | 42 |
| 58 Robinson St | 0.44mi | 3/1.0 | 1,130 (-13%) | 22mo | $92,784 | $82 | 38 |
Match score weights: distance 35% · size 25% · config 20% · recency 20%. Top-matched comps best support the ARV.
Projected returns pro-forma
-3.0% appreciation · 3.0% rent growth · sell at horizon
- IRR
- 32.4%
- Equity multiple
- 2.37×
- Total profit
- $22,903
- Equity at exit
- $8,931
- IRR
- 39.5%
- Equity multiple
- 4.70×
- Total profit
- $61,983
- Equity at exit
- $5,179
Cash invested: $16,772 (down + closing). Projections, not guarantees.
Landlord ↔ Tenant lean methodology
- Overall (STATE)
- 15 Strongly Tenant-Friendly
- State New York
- 15 Strongly Tenant-Friendly · D+10
- County
- — inherits STATE
- City
- — inherits STATE
ZIP-level market 14136
- Home prices YoY
- -4.1%
- Active inventory
- 29
- Price-to-rent
- 4.3×
Monthly cashflow live
- Estimated rent
- $1,172 medium interval (Pro) →
- Mortgage (P&I)
- −$314
- Tax est. 1.5%
- −$75 /mo · $898/yr
- Insurance
- −$25
- HOA
- −$0
- Vacancy / Maint / Mgmt
- −$246
- Net cashflow
- $512
Break-even live
UW: 25.0% down · 7.5% · 30yr · 1.5% tax · 5.0% vac · 8.0% maint · 8.0% mgmt
Financing live
Cash to close
- Down payment
- $14,975
- Closing costs
- $1,797
- Reserves months
- —
- Total cash needed
- —
Loan-product check · same deal, 3 products live
Conventional
25% down · 7.5% · 30yr
- Down + closing
- —
- Monthly P&I
- —
- Monthly cashflow
- —
- DSCR
- —
- Eligible?
- —
Personal DTI + credit; lowest rate.
DSCR
20% down · 8.5% · 30yr
- Down + closing
- —
- Monthly P&I
- —
- Monthly cashflow
- —
- DSCR
- —
- Eligible?
- —
No personal income docs; deal must DSCR.
Hard money
10% down · 12.0% · 12mo
- Down + closing
- —
- Monthly P&I
- —
- Monthly cashflow
- —
- DSCR
- —
- Eligible?
- —
Short-term bridge; refi at stabilization.
Listing history 12 events
-
2026-06-13statusdays on market $59,900 Pending 22 DOM
-
2026-06-12days on market $59,900 Active 21 DOM
-
2026-06-09days on market $59,900 Active 18 DOM
-
2026-06-08days on market $59,900 Active 17 DOM
-
2026-06-07days on market $59,900 Active 16 DOM
-
2026-06-07days on market $59,900 Active 15 DOM
-
2026-06-04days on market $59,900 Active 12 DOM
-
2026-06-02days on market $59,900 Active 11 DOM
-
2026-06-01days on market $59,900 Active 10 DOM
-
2026-05-31days on market $59,900 Active 9 DOM
-
2026-05-21$59,900 Active
-
1997-01-31soldstatus $59,000
ⓘ Source: listings_history table (triggers on properties + properties_extension) + one-shot
backfill from property_details.listing_events for pre-trigger history.
Climate risk First Street
- Flood 1/10 Low FEMA zone X · 0% chance over 30 yrs
- Wildfire 3/10 Moderate
- Heat 2/10 Low 7 d/yr ≥93°F today · 16 d/yr by 30 yrs out
- Wind 1/10 Low
- Air quality 2/10 Low 1 unhealthy d/yr today · 2 by 30 yrs out
Nearby sold comps map
Loading sold comps map…
Walkable amenities ~0.75 mi
Loading nearby amenities…
Taxation est. · year 1
- Rental income
- $14,061
- − Mortgage interest
- −$3,355
- − Property taxes
- −$898
- − Insurance
- −$300
- − Repairs & maintenance
- −$1,125
- − Management
- −$1,125
- − Depreciation
- −$1,743
- Taxable income
- $5,515
- Est. tax owed @ 24.0%
- −$1,324
- After-tax cash flow
- $4,817/yr
For passive investors: Depreciation is non-cash, so a rental often shows a tax loss while cash-flowing — sheltering income. Rental losses are passive: they offset passive income freely, and up to $25,000/yr can offset ordinary (W-2) income if you actively participate and your MAGI is under $100k (phasing out to $0 by $150k); unused losses carry forward. On sale, claimed depreciation is recaptured at up to 25%, and gains may owe capital-gains tax (a 1031 exchange can defer both). Figures are a year-1 estimate at your 24.0% rate — not tax advice; consult a CPA.
Schools (NCES district)
- District
- Silver Creek Central School District
- NCES district ID
- 3626880
- Math proficiency
- 43% ▼ -4.00%
- Reading proficiency
- 51% ▲ 6.00%
- Median HH income
- $48,212
- Composite
- 40.1/100
- National rank
- #3804
- State rank
- #435 of 590 in NY
Livability — Silver Creek
- Score
- 65/100
- State rank
- #698
- US rank
- #13141
Category grades
Schools grade is shown separately in the Schools card above.
Census & demographics
- Census place
- Silver Creek, NY
- Population (ZIP)
- 5,274
Population outlook (Chautauqua County) Hauer SSP2
- Today (2025)
- 123,454 people
- By 2030
- 118,509 · -4.0%
- By 2040
- 107,311 · -13.1%
- By 2050
- 96,703 · -21.7%
- By 2075
- 76,757 · -37.8%
- By 2100
- 60,984 · -50.6%
Race, ethnicity, and origin ACS 2023
- Neighborhood character
- Predominantly White (89%)
- Race & ethnicity
- White 89% Two or more races 5% Hispanic / Latino 5% Black 1%
- Hispanic origin (detail)
- Puerto Rican 4%
- Common ancestry
- Romanian 12% Lithuanian 9% Italian 2%
- Foreign-born
- 1%
- Languages at home
- 96% English-only · Spanish 1% Other Indo-European 1% German/W. Germanic 1%
Political lean MEDSL · Chautauqua
- 2024 margin
- Strong R (+22.0) · D 39.0% · R 61.0%
- 2008→2024 swing
- -22.9pp toward R · 2008: 0.9pp · 2024: -22.0pp
- All cycles
- 2024: R+22.0 2020: R+19.8 2016: R+24.6 2012: R+8.2 2008: D+0.9
Not yet ingested
- Civics
- —
Market trends
- HPI YoY
- ▼ -12.33%
- Current HPI
- 291.4708
- Rent YoY
- —
- Metro
- —
- State GDP YoY
- ▲ 2.60%
- F500 in state
- 92
Industry mix (Fortune 500 HQ in NY)
| Industry | F500 HQs | Revenue |
|---|---|---|
| Financial Services | 10 | $950B |
|
||
| Consumer Goods | 9 | $162B |
|
||
| Insurance | 4 | $225B |
|
||
| Telecommunications | 2 | $144B |
|
||
| Pharmaceuticals | 2 | $112B |
|
||
| Media / Entertainment | 2 | $69B |
|
||
Price history
+1.5% since first listed2 events — show timeline
- 2026-05-21 Listed $59,900 WNYREIS
- 1997-01-31 Sold (Public Records) $59,000 Public Records
Property tax history
+3.0%/yrLatest (2025): $3,440 · +3.7% YoY. Source: county tax records.
Cash-flow waterfall
monthlySold comps — $/sqft
last 12 mo · ≤1 miLoading sold comps…