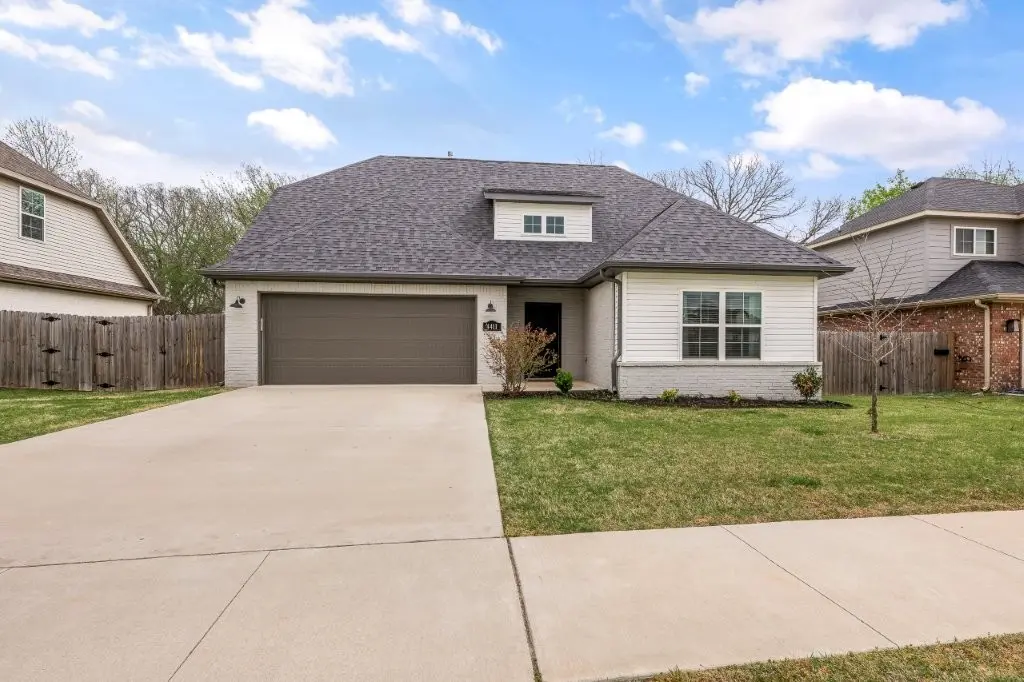
4411 SW Bison St · Bentonville, AR
Flood risk No data
- FEMA flood zone
- —
- Chance of flooding over 30 yrs
- —
- Est. flood insurance / yr
- —
Fire risk No data
- Est. fire insurance / yr
- —
Heat risk No data
- Hot days now (above threshold)
- —
- Hot days in 30 yrs
- —
Wind risk No data
- Chance of severe wind over 30 yrs
- —
Air-quality risk No data
- Unhealthy air days now
- —
- Unhealthy air days in 30 yrs
- —
Risk factors via First Street. Map © Google.
Why this score? — see what drove the D grade
The composite is a weighted blend of 9 inputs, each scored 0–100. Each bar is that input's sub-score; the figure is the points it added to the 100-point composite (weight × sub-score).
- Appreciation +10.0/10.0
- ARV discount +8.3/15.0
- Cash flow +6.4/30.0
- Schools +5.2/10.0
- Livability +4.2/5.0
- Rent growth +2.6/5.0
- Condition / age +2.5/5.0
- 1% rule +1.0/10.0
- DSCR +0.7/10.0
$350,000
🖨 Deal sheet (PDF) 📄 Offer letter ✓ Due diligence
Listing remarks MLS
New Construction! Wonderful plan with open concept that still gives main living privacy! Spacious eat-in kitchen with center island and dining area that provides subtle separation from the main living room. Stainless appliances, gas range, granite, full tile backsplash, walk-in-pantry, and ample counter cabinet space! The living room is full of natural light with a view of the large covered back patio, has a gas log fireplace, and crown molding. The main suite bath offers a walk-in shower with glass door, two vanities, enclosed toilet, and large closet.
Key facts
- Open floor plan
- Walk in pantry
- Center island
Tags
Property features AI
Finance
- HOA & community: Monthly association fee
Exterior
- Parking: Attached garage with garage door opener; Two covered parking spaces
- Security: Smoke detectors
- Utilities: Electricity available; Natural gas available; Public water; Public sewer
- Home design: Two-story home; Faces west; Slab foundation; Brick and vinyl siding; Architectural shingle roof
- Construction: Built as a resale property (less than 25 years old)
- Exterior features: Concrete driveway; Covered patio; Patio; Back yard fencing; Lot is cleared, landscaped and level; Outside city limits; Subdivision setting; Public road frontage
Interior
- Kitchen: Kitchen; Eat-in kitchen; Dishwasher; Gas oven; Gas range; Microwave; Plumbed for ice maker
- Bedrooms: Three bedrooms on the second level; Additional main-level rooms (various sizes)
- Flooring: Carpet; Laminate; Simulated wood; Tile
- Bathrooms: Two full bathrooms; One half bathroom
- Heating & cooling: Gas heating; Electric cooling
- Interior features: Attic; Ceiling fans; Granite counters; Pantry; Storage; Walk-in closets; Window treatments; Double-pane windows; Blinds
- Laundry & utility: Washer hookup; Dryer hookup; Gas water heater
Neighborhood map
What this means for you Summary
Snapshot
- This is a 4-bed/2.5-bath single-family listed at $350k.
Deal economics
- At list price, monthly cash flow is $-614 ($-7k/yr) — negative.
- To cash-flow at today's rent, offer at most $242k (31.0% below list).
- To meet the 1% rule (rent ≥ 1% of price), the offer needs to be $211k (39.8% below list).
- Recommended offer: $211k (39.8% below list) — sets the bar for 1% rule.
- Cap rate 4.2% vs local median 2.6% in Bentonville — top-decile yield for the area; either an underpriced asset or a hidden risk that comps aren't pricing in. Stress-test before assuming the spread holds.
Location & tenants
- Location reads 83/100 on livability (#2 in AR, #864 nationally) — a professional / high-income tenant draw. Strengths: employment A+, housing A+, health & safety A+; Watch: amenities F.
- Bentonville School District (urban): math 59% / reading 59% proficiency, ranked #3 of 238 in AR (top 1%) — acceptable for families but not a draw, mixed tenant base, ~2y average lease.
- Market conditions: Rents flat; 710 active listings in the ZIP; 20 comparable units currently listed for rent nearby; rentals at typical pace (median 25d on market — plan ~3-4 weeks tenant-placement turnaround); high-income renter base; 4,359 units permitted in Benton County in 2024 (402 in 5+ unit buildings).
Forward outlook
- In year one you build about $37k of equity ($2k loan paydown + $35k appreciation (10.0% local appreciation)).
- Benton County population projected at +56% by 2050 — long-run rental-demand tailwind backs the buy-and-hold thesis.
- By year 2, paydown + projected appreciation supports a ~$60k cash-out refi (75% LTV) — recoverable capital for the next deal without selling this one.
Negotiation context
- Only 5 days on market — expect competitive offers; lowballing is unlikely to land.
- 2 sale attempts since 3y ago with the ask held roughly flat each time — persistent listings suggest the price (not the market) is what's stuck; bring a comps-based counter.
Questions for the listing agent
- What do current leases actually rent for vs. the listed asking? Can we see a recent rent roll and the last 12 months of T-12 income?
- Is there a deadline driving the sale (1031 exchange, divorce, estate, relocation)? That informs how much negotiation room exists.
- Schools are A-rated — typically a magnet for longer-tenancy family renters. What's the average tenant stay here, and is there a school-zone premium baked into asking?
- The area grade is low — what's the realistic commute time and amenity access for the typical tenant pool here? Any planned neighborhood developments (good or bad) we should know about?
- What's the average days-on-market for RENTAL listings here right now (not sales)? A rising rental-DOM trend means longer vacancies and softer asking-rent achievability than the comps imply.
- What's the recent tenant-quality profile in this submarket — average credit score on applications, eviction rate, late-payment / NSF rate, and stable-employment percentage? A property-management company in the area should have these aggregated.
- How much new for-sale + rental construction is in the pipeline within 1–3 miles? Heavy new supply typically softens prices + rents 12–24 months out; constrained supply supports both.
Investment metrics
- 1% rule
- 0.60% ✗
- Cap rate
- 4.19%
- Cash-on-cash
- -7.52%
- DSCR
- 0.67
- GRM
- 13.8
CMA / ARV
- ARV (on-the-fly)
- $356,011
- Comps found
- 12
Show comp detail 12 sales within ~0.75 mi
| Address | Dist | Beds/Ba | Sqft | Sold | Price | $/sf | Match |
|---|---|---|---|---|---|---|---|
| 4411 SW Bison St | 0.00mi | 4/2.5 | 1,789 (0%) | 1mo | $343,000 | $192 | 99 |
| 5906 SW Bear Creek Ave | 0.19mi | 4/2.0 | 1,870 (+4%) | 2mo | $364,900 | $195 | 80 |
| 5904 SW Chiefs Ave | 0.22mi | 4/2.0 | 1,870 (+4%) | 1mo | $364,900 | $195 | 80 |
| 5909 SW Chiefs Ave | 0.26mi | 4/2.0 | 1,870 (+4%) | 1mo | $364,900 | $195 | 77 |
| 5803 SW Peaceful Ave | 0.12mi | 3/2.0 (-1) | 1,685 (-6%) | 1mo | $340,000 | $202 | 77 |
| 6002 SW Teppee Ave | 0.26mi | 4/2.5 | 1,940 (+8%) | 0mo | $394,000 | $203 | 73 |
| 5900 SW Chiefs Ave | 0.21mi | 4/3.0 | 1,955 (+9%) | 1mo | $392,500 | $201 | 72 |
| 6001 SW Bear Creek Ave | 0.24mi | 4/3.0 | 1,955 (+9%) | 0mo | $389,500 | $199 | 71 |
| 5905 SW Bear Creek Ave | 0.21mi | 3/2.0 (-1) | 1,669 (-7%) | 1mo | $363,900 | $218 | 71 |
| 4700 SW Tribe St | 0.27mi | 4/3.0 | 1,955 (+9%) | 1mo | $392,500 | $201 | 69 |
| 6002 SW Bear Creek Ave | 0.23mi | 4/2.5 | 2,042 (+14%) | 1mo | $399,900 | $196 | 65 |
| 5903 SW Coywolf St | 0.33mi | 4/2.5 | 2,042 (+14%) | 1mo | $389,900 | $191 | 61 |
Match score weights: distance 35% · size 25% · config 20% · recency 20%. Top-matched comps best support the ARV.
Projected returns pro-forma
10.0% appreciation · 0.39% rent growth · sell at horizon
- IRR
- 18.4%
- Equity multiple
- 2.49×
- Total profit
- $146,079
- Equity at exit
- $315,308
- IRR
- 16.7%
- Equity multiple
- 5.60×
- Total profit
- $450,991
- Equity at exit
- $679,973
Cash invested: $98,000 (down + closing). Projections, not guarantees.
Landlord ↔ Tenant lean methodology
- Overall (STATE)
- 92 Strongly Landlord-Friendly
- State Arkansas
- 92 Strongly Landlord-Friendly · R+14
- County
- — inherits STATE
- City
- — inherits STATE
ZIP-level market 72713
- Home prices YoY
- 3.5%
- Rents YoY
- 0.4%
- Active inventory
- 710
- Price-to-rent
- 13.8×
Monthly cashflow live
- Estimated rent
- $2,108 high interval (Pro) →
- Mortgage (P&I)
- −$1,835
- Tax from tax record
- −$298 /mo · $3,571/yr
- Insurance
- −$146
- HOA
- −$0
- Vacancy / Maint / Mgmt
- −$443
- Net cashflow
- $-614
Break-even live
Sensitivity live
| Price | -10% $-416 | -5% $-515 | +0% $-614 | +5% $-713 | +10% $-812 |
|---|---|---|---|---|---|
| Rent | -10% $-780 | -5% $-697 | +0% $-614 | +5% $-531 | +10% $-447 |
| Rate | -1.0pp $-438 | -0.5pp $-525 | base $-614 | +0.5pp $-704 | +1.0pp $-797 |
UW: 25.0% down · 7.5% · 30yr · 1.5% tax · 5.0% vac · 8.0% maint · 8.0% mgmt
Financing live
Cash to close
- Down payment
- $87,500
- Closing costs
- $10,500
- Reserves months
- —
- Total cash needed
- —
Loan-product check · same deal, 3 products live
Conventional
25% down · 7.5% · 30yr
- Down + closing
- —
- Monthly P&I
- —
- Monthly cashflow
- —
- DSCR
- —
- Eligible?
- —
Personal DTI + credit; lowest rate.
DSCR
20% down · 8.5% · 30yr
- Down + closing
- —
- Monthly P&I
- —
- Monthly cashflow
- —
- DSCR
- —
- Eligible?
- —
No personal income docs; deal must DSCR.
Hard money
10% down · 12.0% · 12mo
- Down + closing
- —
- Monthly P&I
- —
- Monthly cashflow
- —
- DSCR
- —
- Eligible?
- —
Short-term bridge; refi at stabilization.
Rent comps 20 comps
| Address | Beds | Baths | Sqft | Rent | $/sqft | DOM | Units | Dist |
|---|---|---|---|---|---|---|---|---|
| 5809 SW Macasin Ave Bentonville, AR | 4.0 | 2.0 | 1745 | $2,100 | $1.20 | 25d | 1 | 0.09mi |
| 5805 SW Teppee Ave Bentonville, AR | 4.0 | 2.5 | 1854 | $2,145 | $1.16 | 25d | 1 | 0.15mi |
| 4301 SW Pawhuska St Bentonville, AR | 3.0 | 2.0 | 1782 | $1,980 | $1.11 | 25d | 1 | 0.26mi |
| 6000 SW Desert Ave Bentonville, AR | 3.0 | 2.0 | 1669 | $2,050 | $1.23 | 16d | 1 | 0.34mi |
| 621-623 Cosmos St Centerton, AR | 3.0 | 2.0 | 1475 | $1,795 | $1.22 | 15d | 1 | 0.74mi |
| 3401 SW Endearment St Bentonville, AR | 4.0 | 2.5 | 2065 | $2,000 | $0.97 | 25d | 1 | 0.84mi |
| 6812 Memphis Bentonville, AR | 3.0 | 2.5 | 1599 | $1,550 | $0.97 | 25d | 1 | 0.85mi |
| 6604 SW Dignity Ave Bentonville, AR | 3.0 | 3.0 | 1430 | $1,550 | $1.08 | 16d | 1 | 0.86mi |
| 221 Williams Ct Bentonville, AR | 3.0 | 2.0 | 1410 | $1,725 | $1.22 | 25d | 1 | 0.90mi |
| 6800 SW Dignity Ave Bentonville, AR | 3.0 | 2.5 | 1599 | $1,895 | $1.19 | 16d | 1 | 0.95mi |
| 6802 SW Dignity Ave Bentonville, AR | 3.0 | 2.5 | 1599 | $1,895 | $1.19 | 25d | 1 | 0.96mi |
| 3406 SW Lucretia Rd Bentonville, AR | 4.0 | 3.0 | 2393 | $2,800 | $1.17 | 25d | 1 | 0.96mi |
| 231 Palm St Bentonville, AR | 3.0 | 2.0 | 1828 | $2,050 | $1.12 | 25d | 1 | 1.06mi |
| 3600 SW Willowbrook Rd Bentonville, AR | 4.0 | 3.0 | 2612 | $2,600 | $1.00 | 25d | 1 | 1.10mi |
| 3800 SW Mistletoe Ave Unit 1221819P Bentonville, AR | 3.0 | 2.0 | 1593 | $5,861 | $3.68 | 15d | 1 | 1.23mi |
| 890 Tennessee Ave Bentonville, AR | 3.0 | 2.5 | 1250 | $1,595 | $1.28 | 23d | 1 | 1.37mi |
| 1061 Kentucky Ave Bentonville, AR | 3.0 | 2.5 | 1250 | $1,550 | $1.24 | 25d | 1 | 1.38mi |
| 881 Ventnor Ave Centerton, AR | 3.0 | 2.5 | 1250 | $1,550 | $1.24 | 25d | 1 | 1.44mi |
| 960 Ventnor Ave Centerton, AR | 3.0 | 2.5 | 1250 | $1,750 | $1.40 | 25d | 1 | 1.47mi |
| 3200 SW Calm Ridge Rd Bentonville, AR | 4.0 | 2.5 | 2075 | $2,400 | $1.16 | 25d | 1 | 1.50mi |
Listing history 6 events
-
2026-04-13status Pending
-
2026-04-08$350,000 Active
-
2023-03-09soldstatus $325,000
-
2023-03-08soldstatus $325,000 Closed 559-char remark
Show marketing remark (559 chars)
New Construction! Wonderful plan with open concept that still gives main living privacy! Spacious eat-in kitchen with center island and dining area that provides subtle separation from the main living room. Stainless appliances, gas range, granite, full tile backsplash, walk-in-pantry, and ample counter cabinet space! The living room is full of natural light with a view of the large covered back patio, has a gas log fireplace, and crown molding. The main suite bath offers a walk-in shower with glass door, two vanities, enclosed toilet, and large closet.
-
2023-01-20status Pending 559-char remark
Show marketing remark (559 chars)
New Construction! Wonderful plan with open concept that still gives main living privacy! Spacious eat-in kitchen with center island and dining area that provides subtle separation from the main living room. Stainless appliances, gas range, granite, full tile backsplash, walk-in-pantry, and ample counter cabinet space! The living room is full of natural light with a view of the large covered back patio, has a gas log fireplace, and crown molding. The main suite bath offers a walk-in shower with glass door, two vanities, enclosed toilet, and large closet.
-
2023-01-05$325,000 Active 559-char remark
Show marketing remark (559 chars)
New Construction! Wonderful plan with open concept that still gives main living privacy! Spacious eat-in kitchen with center island and dining area that provides subtle separation from the main living room. Stainless appliances, gas range, granite, full tile backsplash, walk-in-pantry, and ample counter cabinet space! The living room is full of natural light with a view of the large covered back patio, has a gas log fireplace, and crown molding. The main suite bath offers a walk-in shower with glass door, two vanities, enclosed toilet, and large closet.
ⓘ Source: listings_history table (triggers on properties + properties_extension) + one-shot
backfill from property_details.listing_events for pre-trigger history.
Tax reassessment forecast AR · Resets to sale price
- Current annual tax
- $3,571 · $298/mo
- Projected year-2 tax
- $3,571 · $298/mo
- Expected delta
- $0/yr ($0/mo · 0.0%)
ⓘ Screening estimate from a state-policy table — verify with the county assessor before closing.
Nearby sold comps map
Loading sold comps map…
Walkable amenities ~0.75 mi
Loading nearby amenities…
Taxation est. · year 1
- Rental income
- $25,292
- − Mortgage interest
- −$19,605
- − Property taxes
- −$3,571
- − Insurance
- −$1,750
- − Repairs & maintenance
- −$2,023
- − Management
- −$2,023
- − Depreciation
- −$10,182
- Taxable loss
- −$13,863
- Est. tax savings @ 24.0%
- +$3,327
- After-tax cash flow
- $-4,038/yr
For passive investors: Depreciation is non-cash, so a rental often shows a tax loss while cash-flowing — sheltering income. Rental losses are passive: they offset passive income freely, and up to $25,000/yr can offset ordinary (W-2) income if you actively participate and your MAGI is under $100k (phasing out to $0 by $150k); unused losses carry forward. On sale, claimed depreciation is recaptured at up to 25%, and gains may owe capital-gains tax (a 1031 exchange can defer both). Figures are a year-1 estimate at your 24.0% rate — not tax advice; consult a CPA.
Schools (NCES district)
- District
- Bentonville School District
- NCES district ID
- 0503060
- Math proficiency
- 59% ▼ -8.00%
- Reading proficiency
- 59% ▼ -6.00%
- Median HH income
- $66,721
- Composite
- 51.85/100
- National rank
- #1661
- State rank
- #3 of 238 in AR
Livability — Bentonville
- Score
- 83/100
- State rank
- #2
- US rank
- #864
Category grades
Schools grade is shown separately in the Schools card above.
Census & demographics
- Census place
- Bentonville, AR
- County
- Benton County · 259,241 people
- City population
- 67,689
- Metro
- Fayetteville-Springdale-Rogers, AR
- Population (ZIP)
- 28,999
- Household income
- $119,853
- Rent vs Own
- Severe rent burden
- 508.0
Population outlook (Benton County) Hauer SSP2
- Today (2025)
- 318,683 people
- By 2030
- 353,481 · +10.9%
- By 2040
- 425,280 · +33.4%
- By 2050
- 497,239 · +56.0%
- By 2075
- 662,114 · +107.8%
- By 2100
- 776,431 · +143.6%
Race, ethnicity, and origin ACS 2023
- Neighborhood character
- Diverse neighborhood (Simpson 0.66)
- Race & ethnicity
- White 54% Asian 20% Two or more races 16% Hispanic / Latino 11% Black 3%
- Hispanic origin (detail)
- Mexican 8%
- Common ancestry
- Italian 2% Slovak 2% Romanian 1%
- Foreign-born
- 22% · Canada, China, Vietnam
- Languages at home
- 79% English-only · Other Asian/Pacific 8% Spanish 6% Other Indo-European 5%
Political lean MEDSL · Benton
- 2024 margin
- Strong R (+27.0) · D 35.2% · R 62.1% · Other 2.7%
- 2008→2024 swing
- +9.6pp toward D · 2008: -36.5pp · 2024: -27.0pp
- All cycles
- 2024: R+27.0 2020: R+26.4 2016: R+34.9 2012: R+40.4 2008: R+36.5
Not yet ingested
- Civics
- —
Market trends
- HPI YoY
- ▲ 10.77%
- Current HPI
- 319.3081
- Rent YoY
- ▲ 0.39%
- Metro
- Fayetteville-Springdale-Rogers, AR
- State GDP YoY
- ▲ 3.80%
- F500 in state
- 10
Industry mix (Fortune 500 HQ in AR)
| Industry | F500 HQs | Revenue |
|---|---|---|
| Retail | 1 | $681B |
|
||
| Food / Agriculture | 1 | $53B |
|
||
| Retail / Energy | 1 | $22B |
|
||
| Transportation / Logistics | 1 | $12B |
|
||
| Energy | 1 | $4B |
|
||
Price history
+7.7% since first listed6 events — show timeline
- 2026-04-13 Pending — NWARMLS
- 2026-04-08 Listed $350,000 NWARMLS
- 2023-03-09 Sold (Public Records) $325,000 Public Records
- 2023-03-08 Sold (MLS) $325,000 NWARMLS
- 2023-01-20 Pending — NWARMLS
- 2023-01-05 Listed $325,000 NWARMLS
Property tax history
+11.4%/yrLatest (2025): $3,571 · -13.7% YoY. Source: county tax records.
Cash-flow waterfall
monthlySold comps — $/sqft
last 12 mo · ≤1 miLoading sold comps…