10315 US Hwy 69 N · Hudson, TX
Flood risk 1/10 · Minimal
- FEMA flood zone
- X (unshaded)
- Chance of flooding over 30 yrs
- 0.0%
- Est. flood insurance / yr
- $507 – $1,088
Fire risk 6/10 · Moderate
- Est. fire insurance / yr
- $1,222 – $2,270
Heat risk 8/10 · Major
- Hot days now (above 109°F)
- 7 days/yr
- Hot days in 30 yrs
- 26 days/yr
Wind risk 8/10 · Major
- Chance of severe wind over 30 yrs
- 80.0%
Air-quality risk 1/10 · Minimal
- Unhealthy air days now
- 0 days/yr
- Unhealthy air days in 30 yrs
- 0 days/yr
Risk factors via First Street. Map © Google.
Why this score? — see what drove the C grade
The composite is a weighted blend of 9 inputs, each scored 0–100. Each bar is that input's sub-score; the figure is the points it added to the 100-point composite (weight × sub-score).
- Cash flow +16.4/30.0
- ARV discount +15.0/15.0
- DSCR +5.1/10.0
- Appreciation +4.9/10.0
- 1% rule +3.7/10.0
- Schools +3.7/10.0
- Livability +3.2/5.0
- Rent growth +2.5/5.0
- Condition / age +2.5/5.0
$189,900
🖨 Deal sheet 📄 Offer letter ✓ Due diligence
Listing remarks MLS
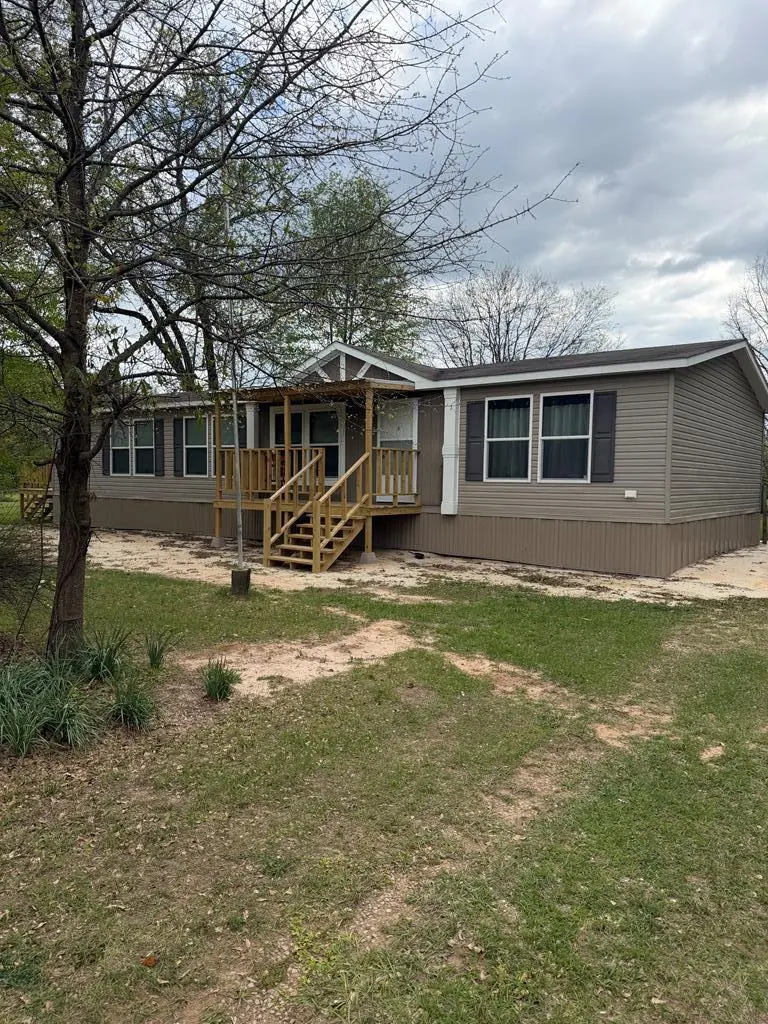
HUGE PRICE IMPROVEMENT!!! Don't miss out on this rare opportunity to live in the Central ISD school district. Amazing mobile home with not one but two decks with a fenced in yard. the home offers a spectacular kitchen with a split floor plan and oversized utility room. Bring your buyers so they can see what all this property has to offer.
Key facts
- Split floor plan
- Two decks
- Fenced in yard
Tags
Neighborhood map
What this means for you Summary
Snapshot
- This is a 3-bed/1.0-bath single-family listed at $190k.
Deal economics
- At list price, monthly cash flow is $106 ($1k/yr) — positive.
- The deal already cash-flows at list — no discount required.
- To meet the 1% rule (rent ≥ 1% of price), the offer needs to be $165k (13.1% below list).
- Recommended offer: $165k (13.1% below list) — sets the bar for 1% rule.
- Cap rate 7.0% vs local median 3.0% in Hudson — top-decile yield for the area; either an underpriced asset or a hidden risk that comps aren't pricing in. Stress-test before assuming the spread holds.
Location & tenants
- Location reads 64/100 on livability (#791 in TX) — a middle-class / working-renter tenant base. Strengths: crime A+, cost of living A+, housing A+; Watch: schools F, amenities F, commute F.
- Central ISD (rural): math 41% / reading 45% proficiency, ranked #294 of 826 in TX (top 36%) — families likely to look elsewhere, expect single-tenant / working-renter base with shorter leases.
- Market conditions: 31 active listings in the ZIP; 120 units permitted in Angelina County in 2024 (0 in 5+ unit buildings).
Forward outlook
- In year one you build about $841 of equity ($1k loan paydown + $-472 appreciation (-0.2% local appreciation)).
Negotiation context
- It's been on market 83 days — a 6% lower offer ($179k) is reasonable based on typical stale-listing flexibility.
Risks & watch-outs
- Climate carrying-cost: severe wind risk, 80% chance of damaging wind over 30y; major wildfire risk; extreme-heat days projected 7→26/yr by 2055 (HVAC capex compounding) — expect insurance premiums to compound above CPI over the hold.
Questions for the listing agent
- It's been on market 83 days. Have you received any prior offers? Is the seller open to a 13% concession, seller financing, or rate buy-down credit?
- Why hasn't it sold? Are there any deal-killer items the seller is aware of (foundation, flood, title, zoning, code violations)?
- Is there a deadline driving the sale (1031 exchange, divorce, estate, relocation)? That informs how much negotiation room exists.
- Schools are F-rated, which usually means shorter tenancies and higher turnover. Who's the typical renter profile here, and what's been the actual vacancy rate?
- What's the average days-on-market for RENTAL listings here right now (not sales)? A rising rental-DOM trend means longer vacancies and softer asking-rent achievability than the comps imply.
- What's the recent tenant-quality profile in this submarket — average credit score on applications, eviction rate, late-payment / NSF rate, and stable-employment percentage? A property-management company in the area should have these aggregated.
- How much new for-sale + rental construction is in the pipeline within 1–3 miles? Heavy new supply typically softens prices + rents 12–24 months out; constrained supply supports both.
Investment metrics
- 1% rule
- 0.87% ✗
- Cap rate
- 6.96%
- Cash-on-cash
- 2.40%
- DSCR
- 1.11
- GRM
- 9.6
CMA / ARV
- ARV (median comp)
- $331,314
- List price
- $189,900
- Delta
- -42.68%
- Verdict
- UNDERPRICED
- Comps
- 2 within 2.0 mi
Projected returns pro-forma
-0.25% appreciation · 3.0% rent growth · sell at horizon
- IRR
- -0.4%
- Equity multiple
- 0.98×
- Total profit
- $-1,045
- Equity at exit
- $52,795
- IRR
- 5.4%
- Equity multiple
- 1.57×
- Total profit
- $30,059
- Equity at exit
- $61,619
Cash invested: $53,172 (down + closing). Projections, not guarantees.
Landlord ↔ Tenant lean methodology
- Overall (STATE)
- 87 Strongly Landlord-Friendly
- State Texas
- 87 Strongly Landlord-Friendly · R+5
- County
- — inherits STATE
- City
- — inherits STATE
ZIP-level market 75969
- Home prices YoY
- -0.1%
- Active inventory
- 31
- Price-to-rent
- 9.6×
Monthly cashflow live
- Estimated rent
- $1,650 medium interval (Pro) →
- Mortgage (P&I)
- −$996
- Tax from tax record
- −$122 /mo · $1,465/yr
- Insurance
- −$79
- HOA
- −$0
- Vacancy / Maint / Mgmt
- −$346
- Net cashflow
- $106
Break-even live
UW: 25.0% down · 7.5% · 30yr · 1.5% tax · 5.0% vac · 8.0% maint · 8.0% mgmt
Financing live
Cash to close
- Down payment
- $47,475
- Closing costs
- $5,697
- Reserves months
- —
- Total cash needed
- —
Loan-product check · same deal, 3 products live
Conventional
25% down · 7.5% · 30yr
- Down + closing
- —
- Monthly P&I
- —
- Monthly cashflow
- —
- DSCR
- —
- Eligible?
- —
Personal DTI + credit; lowest rate.
DSCR
20% down · 8.5% · 30yr
- Down + closing
- —
- Monthly P&I
- —
- Monthly cashflow
- —
- DSCR
- —
- Eligible?
- —
No personal income docs; deal must DSCR.
Hard money
10% down · 12.0% · 12mo
- Down + closing
- —
- Monthly P&I
- —
- Monthly cashflow
- —
- DSCR
- —
- Eligible?
- —
Short-term bridge; refi at stabilization.
Listing history 22 events
-
2026-06-19days on market $189,900 Active 83 DOM
-
2026-06-18days on market $189,900 Active 82 DOM
-
2026-06-17days on market $189,900 Active 81 DOM
-
2026-06-16days on market $189,900 Active 80 DOM
-
2026-06-15days on market $189,900 Active 79 DOM
-
2026-06-14days on market $189,900 Active 77 DOM
-
2026-06-13days on market $189,900 Active 76 DOM
-
2026-06-10days on market $189,900 Active 74 DOM
-
2026-06-09days on market $189,900 Active 73 DOM
-
2026-06-08days on market $189,900 Active 72 DOM
-
2026-06-07days on market $189,900 Active 71 DOM
-
2026-06-05days on market $189,900 Active 68 DOM
-
2026-06-03days on market $189,900 Active 67 DOM
-
2026-06-02days on market $189,900 Active 66 DOM
-
2026-06-01days on market $189,900 Active 65 DOM
-
2026-05-31days on market $189,900 Active 64 DOM
-
2026-05-30days on market $189,900 Active 63 DOM
-
2026-04-14price $189,900 340-char remark
Show marketing remark (340 chars)
HUGE PRICE IMPROVEMENT!!! Don't miss out on this rare opportunity to live in the Central ISD school district. Amazing mobile home with not one but two decks with a fenced in yard. the home offers a spectacular kitchen with a split floor plan and oversized utility room. Bring your buyers so they can see what all this property has to offer.
-
2026-03-26$209,900 Active 340-char remark
Show marketing remark (340 chars)
HUGE PRICE IMPROVEMENT!!! Don't miss out on this rare opportunity to live in the Central ISD school district. Amazing mobile home with not one but two decks with a fenced in yard. the home offers a spectacular kitchen with a split floor plan and oversized utility room. Bring your buyers so they can see what all this property has to offer.
-
2014-06-23soldstatus
-
2013-10-03soldstatus
-
2003-03-21soldstatus
ⓘ Source: listings_history table (triggers on properties + properties_extension) + one-shot
backfill from property_details.listing_events for pre-trigger history.
Tax reassessment forecast TX · Resets to sale price
- Current annual tax
- $1,465 · $122/mo
- Projected year-2 tax
- $3,475 · $290/mo
- Expected delta
- +$2,010/yr (+$167/mo · 137.2%)
ⓘ Screening estimate from a state-policy table — verify with the county assessor before closing.
Climate risk First Street
- Flood 1/10 Low FEMA zone X (unshaded) · 0% chance over 30 yrs
- Wildfire 6/10 Major
- Heat 8/10 Severe 7 d/yr ≥109°F today · 26 d/yr by 30 yrs out
- Wind 8/10 Severe 80% chance of damaging wind over 30 yrs
- Air quality 1/10 Low 0 unhealthy d/yr today · 0 by 30 yrs out
Nearby sold comps map
Loading sold comps map…
Walkable amenities ~0.75 mi
Loading nearby amenities…
Taxation est. · year 1
- Rental income
- $19,796
- − Mortgage interest
- −$10,637
- − Property taxes
- −$1,465
- − Insurance
- −$950
- − Repairs & maintenance
- −$1,584
- − Management
- −$1,584
- − Depreciation
- −$5,524
- Taxable loss
- −$1,948
- Est. tax savings @ 24.0%
- +$467
- After-tax cash flow
- $1,741/yr
For passive investors: Depreciation is non-cash, so a rental often shows a tax loss while cash-flowing — sheltering income. Rental losses are passive: they offset passive income freely, and up to $25,000/yr can offset ordinary (W-2) income if you actively participate and your MAGI is under $100k (phasing out to $0 by $150k); unused losses carry forward. On sale, claimed depreciation is recaptured at up to 25%, and gains may owe capital-gains tax (a 1031 exchange can defer both). Figures are a year-1 estimate at your 24.0% rate — not tax advice; consult a CPA.
Schools (NCES district)
- District
- Central ISD
- NCES district ID
- 4813500
- Math proficiency
- 41% ▼ -11.00%
- Reading proficiency
- 45% ▼ -2.00%
- Median HH income
- $52,994
- Composite
- 37.26/100
- National rank
- #4458
- State rank
- #294 of 826 in TX
Livability — Hudson
- Score
- 64/100
- State rank
- #791
- US rank
- #14441
Category grades
Schools grade is shown separately in the Schools card above.
Census & demographics
- Population (ZIP)
- 4,606
Population outlook (Angelina County) Hauer SSP2
- Today (2025)
- 90,174 people
- By 2030
- 90,697 · +0.6%
- By 2040
- 91,291 · +1.2%
- By 2050
- 91,168 · +1.1%
- By 2075
- 88,961 · -1.3%
- By 2100
- 80,590 · -10.6%
Race, ethnicity, and origin ACS 2023
- Neighborhood character
- Predominantly White (81%)
- Race & ethnicity
- White 81% Hispanic / Latino 11% Black 5% Two or more races 5%
- Hispanic origin (detail)
- Mexican 11%
- Common ancestry
- Lithuanian 1% Slovak 1% Serbian 1%
- Foreign-born
- 1% · Canada
- Languages at home
- 98% English-only · Spanish 2%
Political lean MEDSL · Angelina
- 2024 margin
- Solid R (+52.0) · D 23.7% · R 75.7%
- 2008→2024 swing
- -17.0pp toward R · 2008: -35.0pp · 2024: -52.0pp
- All cycles
- 2024: R+52.0 2020: R+46.1 2016: R+47.3 2012: R+43.9 2008: R+35.0
Not yet ingested
- Civics
- —
Market trends
- HPI YoY
- ▼ -0.25%
- Current HPI
- 235.2344
- Rent YoY
- —
- Metro
- —
- State GDP YoY
- ▲ 3.95%
- F500 in state
- 110
Industry mix (Fortune 500 HQ in TX)
| Industry | F500 HQs | Revenue |
|---|---|---|
| Energy | 16 | $1,198B |
|
||
| Technology | 5 | $198B |
|
||
| Engineering / Construction | 4 | $72B |
|
||
| Energy Services | 3 | $60B |
|
||
| Utilities | 3 | $41B |
|
||
| Healthcare | 2 | $330B |
|
||
Price history
-9.5% since first listed5 events — show timeline
- 2026-04-14 Price Changed $189,900 Deep East Texas MLS
- 2026-03-26 Listed $209,900 Deep East Texas MLS
- 2014-06-23 Sold (Public Records) — Public Records
- 2013-10-03 Sold (Public Records) — Public Records
- 2003-03-21 Sold (Public Records) — Public Records
Property tax history
+1.1%/yrLatest (2025): $1,465 · +1.0% YoY. Source: county tax records.
Cash-flow waterfall
monthlySold comps — $/sqft
last 12 mo · ≤1 miLoading sold comps…