 Multi-family
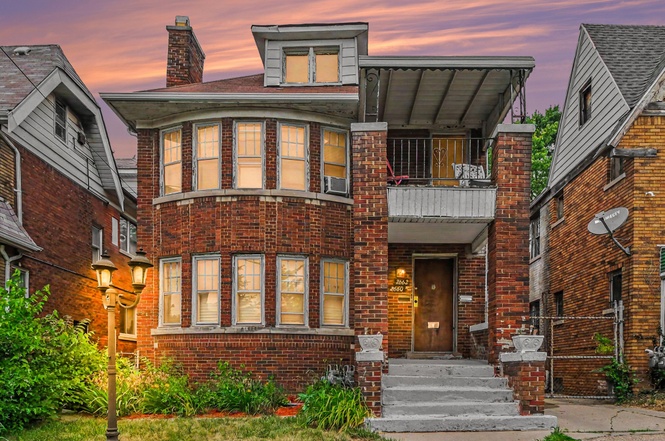
2660 Tuxedo St · Detroit, MI
Flood risk 1/10 · Minimal
- FEMA flood zone
- X (unshaded)
- Chance of flooding over 30 yrs
- 0.0%
- Est. flood insurance / yr
- $473 – $860
Fire risk 1/10 · Minimal
- Est. fire insurance / yr
- $784 – $1,456
Heat risk 3/10 · Minor
- Hot days now (above 97°F)
- 7 days/yr
- Hot days in 30 yrs
- 15 days/yr
Wind risk 2/10 · Minimal
- Chance of severe wind over 30 yrs
- —
Air-quality risk 4/10 · Minor
- Unhealthy air days now
- 4 days/yr
- Unhealthy air days in 30 yrs
- 6 days/yr
Risk factors via First Street. Map © Google.
Why this score? — see what drove the C- grade
The composite is a weighted blend of 9 inputs, each scored 0–100. Each bar is that input's sub-score; the figure is the points it added to the 100-point composite (weight × sub-score).
- Cash flow +26.8/30.0
- DSCR +9.2/10.0
- 1% rule +6.5/10.0
- Rent growth +3.8/5.0
- Livability +3.7/5.0
- Condition / age +2.5/5.0
- Schools +1.3/10.0
- ARV discount +0.0/15.0
- Appreciation +0.0/10.0
$220,000
🖨 Deal sheet 📄 Offer letter ✓ Due diligence
Multi-family units
County records classify this as Multi-Family (2-4 Unit). Listing-text estimate: 1 unit. estimate disagrees with records
Listing remarks MLS
Discover the charm of this ''diamond in the rough'' in the highly sought-after 48206 district--a community on the rise! This stunning, all-brick home features classic turn-of-the-century architecture, including a rare original built-in wall icebox that honors its 1926 heritage. The second floor shines with refinished hardwood flooring throughout and fresh paint. Enjoy modern upgrades including new ceiling fans, light fixtures, and mini-blinds. Exterior updates include new gutters and two spacious rear balconies. With a roof approximately 7 years old, this property offers incredible bones. The unfinished first floor provides a blank canvas to customize to your vision. Don't miss this opportunity to own a piece of history in a top-rated, up-and-coming neighborhood. Sold as-is. Schedule your tour today!
Key facts
- New mini-blinds
- New ceiling fans
- New gutters
Tags
Property features AI
Finance
- Financial info: Tax information available: annual tax noted
Exterior
- Utilities: Public water; Public sewer / sewer connected; Natural gas connected
- Home design: Multi-family residential income property; Total building area approximately 2,840; Lot dimensions about 35 x 125 (approximately 4,356 sq ft / 0.1 acre); Zoned residential
- Construction: Brick construction
- Exterior features: Other-style roof
Interior
- Bedrooms: Two separate 3-bedroom units
- Bathrooms: Each unit has 1 bathroom
- Heating & cooling: Forced air heating (natural gas); Window unit air conditioning
- Interior features: Basement present
Neighborhood map
What this means for you Summary
Snapshot
- This is a 6-bed/3.0-bath multifamily listed at $220k.
Deal economics
- At list price, monthly cash flow is $603 ($7k/yr) — positive.
- The deal already cash-flows at list — no discount required.
- Meets the 1% rule at list price ($3k rent vs $220k).
Location & tenants
- Location reads 73/100 on livability (#218 in MI) — a middle-class / working-renter tenant base. Strengths: amenities A+, commute A+, cost of living A+; Watch: schools F, crime F, employment F.
- Detroit Public Schools Community District (urban): math 10% / reading 24% proficiency, ranked #499 of 540 in MI (top 92%) — low school quality limits family demand, transient renter base, plan for 1-2y turnover; 90% free/reduced lunch — lower-income household profile, screen leases tightly.
- Market conditions: Rents rising fast (+5.2%/yr); 271 active listings in the ZIP; 6 comparable units currently listed for rent nearby; rentals at typical pace (median 15d on market — plan ~3-4 weeks tenant-placement turnaround); 2,639 units permitted in Wayne County in 2024 (1,216 in 5+ unit buildings).
- At $2,540/mo this rent would consume 68% of the median local household income ($45k/yr) (locally 646% of renters already pay >50% of income on rent) — very limited rent-growth headroom before tenants either downsize or default.
Forward outlook
- Local home prices are declining (-3.0%/yr); year-one equity from $2k of loan paydown is wiped out by about $7k of value loss. Plan a longer hold.
- Wayne County population projected at -17% by 2050 — secular population decline; favor cash flow + early exit over multi-decade hold.
- At projected returns (-3.0% appreciation + 5.2% rent growth), your $62k cash investment doubles in ~8 years — after that, you're playing with house money.
Negotiation context
- Only 1 days on market — expect competitive offers; lowballing is unlikely to land.
- 2 sale attempts with the ask held roughly flat each time — persistent listings suggest the price (not the market) is what's stuck; bring a comps-based counter.
Risks & watch-outs
- Watch-outs: built in 1926 — expect roof / HVAC / electrical / plumbing capex.
Questions for the listing agent
- Built in 1926 — when were the roof, HVAC, electrical panel, plumbing, and water heater last replaced?
- Is there a deadline driving the sale (1031 exchange, divorce, estate, relocation)? That informs how much negotiation room exists.
- Schools are F-rated, which usually means shorter tenancies and higher turnover. Who's the typical renter profile here, and what's been the actual vacancy rate?
- Crime grade is F in this area — have there been break-ins, vandalism, or insurance claims at this property in the last 3 years? What carrier currently insures it and at what premium?
- What's the average days-on-market for RENTAL listings here right now (not sales)? A rising rental-DOM trend means longer vacancies and softer asking-rent achievability than the comps imply.
- What's the recent tenant-quality profile in this submarket — average credit score on applications, eviction rate, late-payment / NSF rate, and stable-employment percentage? A property-management company in the area should have these aggregated.
- How much new apartment / multifamily construction is in the pipeline within 1–3 miles? Heavy new supply (>2% of stock underway) typically softens rents 12–24 months out; light construction supports rent growth.
Investment metrics
- 1% rule
- 1.15% ✓
- Cap rate
- 9.58%
- Cash-on-cash
- 11.75%
- DSCR
- 1.52
- GRM
- 7.2
CMA / ARV
- ARV (on-the-fly)
- $164,720
- Comps found
- 12
Show comp detail 12 sales within ~0.75 mi
| Address | Dist | Beds/Ba | Sqft | Sold | Price | $/sf | Match |
|---|---|---|---|---|---|---|---|
| 2716 Elmhurst St | 0.08mi | 6/2.0 | 2,750 (-3%) | 1mo | $225,000 | $82 | 86 |
| 2952 Elmhurst St | 0.16mi | 6/2.5 | 2,950 (+4%) | 2mo | $65,000 | $22 | 82 |
| 2424 Calvert St | 0.37mi | 6/2.5 | 2,900 (+2%) | 5mo | $305,000 | $105 | 73 |
| 2931 Tuxedo St | 0.13mi | 6/2.0 | 2,510 (-12%) | 3mo | $50,000 | $20 | 68 |
| 3025 Tuxedo St | 0.22mi | 6/2.5 | 2,548 (-10%) | 5mo | $150,000 | $59 | 66 |
| 3230 Fullerton St | 0.48mi | 6/2.0 | 2,950 (+4%) | 3mo | $65,000 | $22 | 65 |
| 3316 Sturtevant St | 0.49mi | 6/2.0 | 2,750 (-3%) | 5mo | $215,000 | $78 | 64 |
| 3014 - 3016 Sturtevant St | 0.38mi | 6/2.0 | 2,700 (-5%) | 7mo | $106,000 | $39 | 64 |
| 2642 Webb St | 0.06mi | 6/2.0 | 3,248 (+14%) | 7mo | $190,000 | $58 | 64 |
| 2907 Calvert St | 0.36mi | 6/2.0 | 3,140 (+11%) | 2mo | $130,000 | $41 | 60 |
| 2327 Sturtevant St | 0.43mi | 6/2.0 | 2,666 (-6%) | 7mo | $115,000 | $43 | 60 |
| 1708 Burlingame St | 0.64mi | 6/4.0 | 3,094 (+9%) | 3mo | $236,900 | $77 | 48 |
Match score weights: distance 35% · size 25% · config 20% · recency 20%. Top-matched comps best support the ARV.
Projected returns pro-forma
-3.0% appreciation · 5.2% rent growth · sell at horizon
- IRR
- 3.5%
- Equity multiple
- 1.14×
- Total profit
- $8,464
- Equity at exit
- $32,803
- IRR
- 14.9%
- Equity multiple
- 2.32×
- Total profit
- $81,346
- Equity at exit
- $19,022
Cash invested: $61,600 (down + closing). Projections, not guarantees.
Landlord ↔ Tenant lean methodology
- Overall (STATE)
- 62 Landlord-Friendly
- State Michigan
- 62 Landlord-Friendly · EVEN
- County
- — inherits STATE
- City
- — inherits STATE
ZIP-level market 48206
- Rents YoY
- 5.2%
- Active inventory
- 271
- Price-to-rent
- 14.4×
Monthly cashflow live
- Estimated rent
- $2,540 high interval (Pro) →
- Mortgage (P&I)
- −$1,154
- Tax from tax record
- −$158 /mo · $1,900/yr
- Insurance
- −$92
- HOA
- −$0
- Vacancy / Maint / Mgmt
- −$533
- Net cashflow
- $603
Break-even live
2-unit breakdown (identical units grouped — click to expand)
| Units | Beds | Baths | Est. rent |
|---|---|---|---|
| 2× units | 2 | 1 | $2,540 |
| #1 | 2 | 1 | $1,270 |
| #2 | 2 | 1 | $1,270 |
| Total (2 units) | $2,540 | ||
UW: 25.0% down · 7.5% · 30yr · 1.5% tax · 5.0% vac · 8.0% maint · 8.0% mgmt
Financing live
Cash to close
- Down payment
- $55,000
- Closing costs
- $6,600
- Reserves months
- —
- Total cash needed
- —
Loan-product check · same deal, 3 products live
Conventional
25% down · 7.5% · 30yr
- Down + closing
- —
- Monthly P&I
- —
- Monthly cashflow
- —
- DSCR
- —
- Eligible?
- —
Personal DTI + credit; lowest rate.
DSCR
20% down · 8.5% · 30yr
- Down + closing
- —
- Monthly P&I
- —
- Monthly cashflow
- —
- DSCR
- —
- Eligible?
- —
No personal income docs; deal must DSCR.
Hard money
10% down · 12.0% · 12mo
- Down + closing
- —
- Monthly P&I
- —
- Monthly cashflow
- —
- DSCR
- —
- Eligible?
- —
Short-term bridge; refi at stabilization.
Rent comps 6 comps
| Address | Beds | Baths | Sqft | Rent | $/sqft | DOM | Units | Dist |
|---|---|---|---|---|---|---|---|---|
| 1699 Glynn Ct Detroit, MI | 5.0 | 3.5 | 2542 | $2,500 | $0.98 | 21d | 1 | 0.77mi |
| 8951 La Salle Blvd Detroit, MI | 5.0 | 2.5 | 2440 | $2,500 | $1.02 | 14d | 1 | 0.91mi |
| 2509 Gladstone St Unit NA Detroit, MI | 6.0 | 3.0 | 3008 | $2,000 | $0.66 | 10d | 1 | 1.02mi |
| 2028 Gladstone St Unit 1 Detroit, MI | 5.0 | 2.0 | 2500 | $2,850 | $1.14 | 3d | 1 | 1.09mi |
| 13225 Santa Rosa Dr Detroit, MI | 5.0 | 2.0 | 2100 | $1,700 | $0.81 | 4d | 1 | 1.29mi |
| 3799 W Philadelphia St Detroit, MI | 5.0 | 2.0 | 2200 | $1,650 | $0.75 | 16d | 1 | 1.33mi |
Listing history 2 events
-
2026-06-17remarks 699-char remark
Show marketing remark (811 chars)
Discover the charm of this ''diamond in the rough'' in the highly sought-after 48206 district--a community on the rise! This stunning, all-brick home features classic turn-of-the-century architecture, including a rare original built-in wall icebox that honors its 1926 heritage. The second floor shines with refinished hardwood flooring throughout and fresh paint. Enjoy modern upgrades including new ceiling fans, light fixtures, and mini-blinds. Exterior updates include new gutters and two spacious rear balconies. With a roof approximately 7 years old, this property offers incredible bones. The unfinished first floor provides a blank canvas to customize to your vision. Don't miss this opportunity to own a piece of history in a top-rated, up-and-coming neighborhood. Sold as-is. Schedule your tour today!
-
2026-06-17$220,000 Active 1 DOM
Show marketing remark (811 chars)
Discover the charm of this ''diamond in the rough'' in the highly sought-after 48206 district--a community on the rise! This stunning, all-brick home features classic turn-of-the-century architecture, including a rare original built-in wall icebox that honors its 1926 heritage. The second floor shines with refinished hardwood flooring throughout and fresh paint. Enjoy modern upgrades including new ceiling fans, light fixtures, and mini-blinds. Exterior updates include new gutters and two spacious rear balconies. With a roof approximately 7 years old, this property offers incredible bones. The unfinished first floor provides a blank canvas to customize to your vision. Don't miss this opportunity to own a piece of history in a top-rated, up-and-coming neighborhood. Sold as-is. Schedule your tour today!
ⓘ Source: listings_history table (triggers on properties + properties_extension) + one-shot
backfill from property_details.listing_events for pre-trigger history.
Tax reassessment forecast MI · Partial reset (capped growth)
- Current annual tax
- $1,900 · $158/mo
- Projected year-2 tax
- $2,644 · $220/mo
- Expected delta
- +$744/yr (+$62/mo · 39.2%)
ⓘ Screening estimate from a state-policy table — verify with the county assessor before closing.
Climate risk First Street
- Flood 1/10 Low FEMA zone X (unshaded) · 0% chance over 30 yrs
- Wildfire 1/10 Low
- Heat 3/10 Moderate 7 d/yr ≥97°F today · 15 d/yr by 30 yrs out
- Wind 2/10 Low
- Air quality 4/10 Moderate 4 unhealthy d/yr today · 6 by 30 yrs out
Nearby sold comps map
Loading sold comps map…
Walkable amenities ~0.75 mi
Loading nearby amenities…
Taxation est. · year 1
- Rental income
- $30,480
- − Mortgage interest
- −$12,323
- − Property taxes
- −$1,900
- − Insurance
- −$1,100
- − Repairs & maintenance
- −$2,438
- − Management
- −$2,438
- − Depreciation
- −$6,400
- Taxable income
- $3,880
- Est. tax owed @ 24.0%
- −$931
- After-tax cash flow
- $6,304/yr
For passive investors: Depreciation is non-cash, so a rental often shows a tax loss while cash-flowing — sheltering income. Rental losses are passive: they offset passive income freely, and up to $25,000/yr can offset ordinary (W-2) income if you actively participate and your MAGI is under $100k (phasing out to $0 by $150k); unused losses carry forward. On sale, claimed depreciation is recaptured at up to 25%, and gains may owe capital-gains tax (a 1031 exchange can defer both). Figures are a year-1 estimate at your 24.0% rate — not tax advice; consult a CPA.
Schools (NCES district)
- District
- Detroit Public Schools Community District
- NCES district ID
- 2601103
- Math proficiency
- 10% ▼ -2.00%
- Reading proficiency
- 24% ▲ 6.00%
- Median HH income
- $25,815
- Composite
- 13.06/100
- National rank
- #9564
- State rank
- #499 of 540 in MI
Livability — Detroit
- Score
- 73/100
- State rank
- #218
- US rank
- #5427
Category grades
Schools grade is shown separately in the Schools card above.
Census & demographics
- Census place
- Detroit, MI
- County
- Wayne County · 1,562,939 people
- City population
- 572,865
- Metro
- Detroit-Warren-Dearborn, MI
- Population (ZIP)
- 15,227
- Household income
- $45,046
- Rent vs Own
- Severe rent burden
- 646.0
Population outlook (Wayne County) Hauer SSP2
- Today (2025)
- 1,675,273 people
- By 2030
- 1,620,300 · -3.3%
- By 2040
- 1,502,341 · -10.3%
- By 2050
- 1,384,039 · -17.4%
- By 2075
- 1,124,592 · -32.9%
- By 2100
- 881,193 · -47.4%
Race, ethnicity, and origin ACS 2023
- Neighborhood character
- Predominantly Black (81%)
- Race & ethnicity
- Black 81% White 12% Two or more races 5% Hispanic / Latino 3%
- Common ancestry
- Iranian 3% Romanian 1% Slovak 1%
- Foreign-born
- 4% · Canada
- Languages at home
- 94% English-only · Spanish 4% Other Indo-European 1%
Political lean MEDSL · Wayne
- 2024 margin
- Strong D (+29.0) · D 62.7% · R 33.7% · Other 3.6%
- 2008→2024 swing
- -20.5pp toward R · 2008: 49.5pp · 2024: 29.0pp
- All cycles
- 2024: D+29.0 2020: D+38.1 2016: D+37.3 2012: D+46.9 2008: D+49.5
Not yet ingested
- Civics
- —
Market trends
- HPI YoY
- ▼ -139.60%
- Current HPI
- 130.9545
- Rent YoY
- ▲ 5.20%
- Metro
- Detroit-Warren-Dearborn, MI
- State GDP YoY
- ▲ 1.37%
- F500 in state
- 28
Industry mix (Fortune 500 HQ in MI)
| Industry | F500 HQs | Revenue |
|---|---|---|
| Automotive Parts | 3 | $48B |
|
||
| Automotive | 2 | $372B |
|
||
| Chemicals | 1 | $45B |
|
||
| Automotive Retail | 1 | $29B |
|
||
| Healthcare / Medical Devices | 1 | $23B |
|
||
| Automotive Technology | 1 | $20B |
|
||
Price history
+0.0% since first listed2 events — show timeline
- 2026-06-17 Listed $220,000 REALCOMP
- 2026-06-17 Listed $220,000 MiRealSource-MiMLS
Property tax history
+5.5%/yrLatest (2025): $1,900 · +7.8% YoY. Source: county tax records.
Cash-flow waterfall
monthlySold comps — $/sqft
last 12 mo · ≤1 miLoading sold comps…