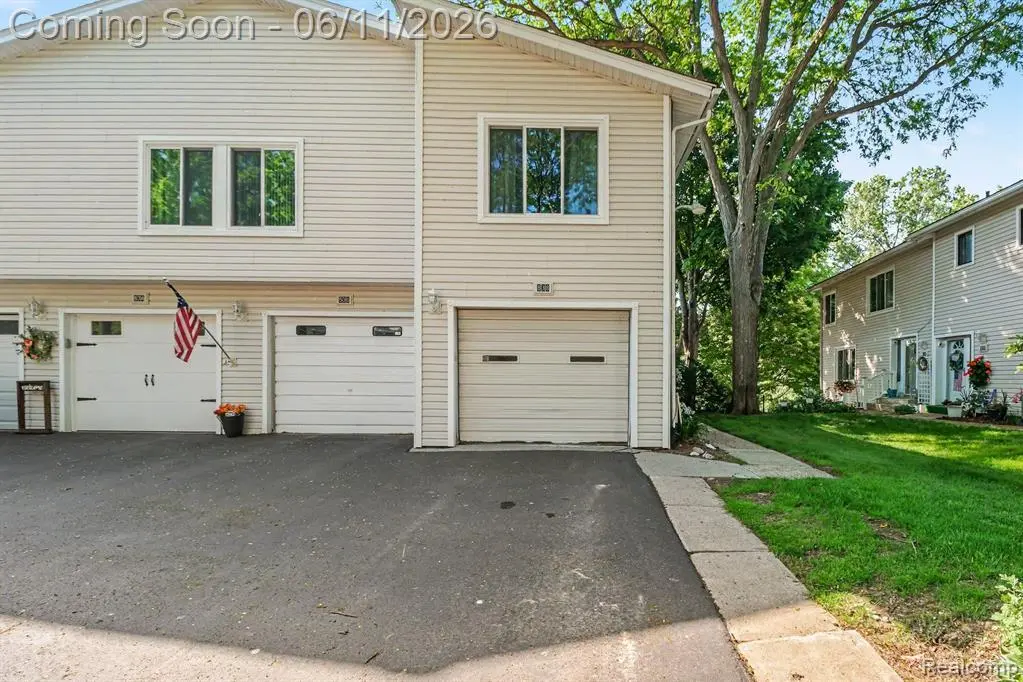
838 Corners Ct · Orion, MI
Flood risk 1/10 · Minimal
- FEMA flood zone
- X (unshaded)
- Chance of flooding over 30 yrs
- 0.0%
- Est. flood insurance / yr
- $473 – $860
Fire risk 1/10 · Minimal
- Est. fire insurance / yr
- $784 – $1,456
Heat risk 2/10 · Minimal
- Hot days now (above 97°F)
- 7 days/yr
- Hot days in 30 yrs
- 15 days/yr
Wind risk 2/10 · Minimal
- Chance of severe wind over 30 yrs
- —
Air-quality risk 3/10 · Minor
- Unhealthy air days now
- 2 days/yr
- Unhealthy air days in 30 yrs
- 4 days/yr
Risk factors via First Street. Map © Google.
Why this score? — see what drove the C- grade
The composite is a weighted blend of 9 inputs, each scored 0–100. Each bar is that input's sub-score; the figure is the points it added to the 100-point composite (weight × sub-score).
- Cash flow +19.5/30.0
- ARV discount +7.5/15.0
- 1% rule +7.0/10.0
- DSCR +6.2/10.0
- Schools +5.1/10.0
- Rent growth +2.5/5.0
- Livability +2.5/5.0
- Condition / age +2.5/5.0
- Appreciation +0.0/10.0
$199,900
🖨 Deal sheet 📄 Offer letter ✓ Due diligence
Listing remarks MLS
Highest and Best due 9/12/23 by 3:00pm. This charming, raised ranch condominium offers 1183 sq. ft. of comfortable living space, featuring 2 bedrooms, 1 bath, laundry facilities and a one-car garage. This home features an inviting open floor plan, allowing for seamless flow between the living, dining, and kitchen areas. The living room boasts ample natural light, and a cozy stone tile surround fireplace with shiplap creating a warm and welcoming atmosphere for relaxation and entertainment. Both bedrooms are generously sized, offering a peaceful retreat at the end of a long day. It is rare for an Orion Corners unit to become available. This is a quaint well-kept community and residents have access to a sparkling community pool, ideal for cooling off during hot summer days or simply lounging by the water. One of the highlights of this property is its prime location. Situated within walking distance of the charming town of Lake Orion, you'll have easy access to a variety of shops, restaurants, and entertainment options. Additionally, the proximity to Lake Orion itself and Paint Creek Trail allows for endless opportunities to enjoy the great outdoors. Don't miss out on the chance to call this beautiful condominium your own. Schedule a showing today and experience the best of Lake Orion living! BATVAI Agent Must be physically present at all showings and inspections.
Key facts
- $334 HOA
- Garage
- Community pool
Property features AI
Finance
- Other: Pets allowed with restrictions (breed restrictions; contact for details)
- HOA & community: Monthly association fee of $334; Association covers lawn maintenance, snow removal, trash removal, water and sewer; Community amenities include a laundry facility and private entry; Has association fee (contact association for details)
Exterior
- Parking: Attached garage with 1 parking space
- Utilities: Public water; Public sewer (included in association services); Electric service (standard); Gas water heater; Natural gas
- Home design: Condominium; Condo/apartment located on 2nd floor or above; Built in 1972
- Construction: Vinyl siding exterior; Slab foundation
- Exterior features: Inground pool; Paved street
Interior
- Kitchen: Laminate flooring; Kitchen approx. 8 x 10; Range/Oven; Refrigerator; Dishwasher; Disposal
- Bedrooms: Bedroom 1 (Second level) — 12 x 16, laminate flooring; Bedroom 2 (Second level) — 12 x 13, laminate flooring
- Flooring: Laminate in bedrooms, living room, dining room and kitchen; Ceramic in bathroom; Linoleum in laundry room
- Bathrooms: One full bathroom (Second level) with ceramic flooring — approx. 5 x 8
- Heating & cooling: Forced air heating; Central air conditioning; Ceiling fan(s); Natural gas heat/fuel; Gas water heater
- Interior features: Cable/Internet available; Living room fireplace; Total of 7 rooms
- Laundry & utility: Laundry room (Second level) approx. 8 x 11 with linoleum flooring; Washer; Dryer
Neighborhood map
What this means for you Summary
Snapshot
- This is a 2-bed/1.0-bath condo listed at $200k.
Deal economics
- At list price, monthly cash flow is $226 ($3k/yr) — positive.
- The deal already cash-flows at list — no discount required.
- Meets the 1% rule at list price ($2k rent vs $200k).
Location & tenants
- Location reads: area grade C — affects rentability + tenant quality, not the cash-flow math above.
- Lake Orion Community Schools (suburban): math 49% / reading 64% proficiency, ranked #45 of 540 in MI (top 8%) — acceptable for families but not a draw, mixed tenant base, ~2y average lease; only 16% free/reduced lunch — higher-income household profile.
- Market conditions: 88 active listings in the ZIP; 7 comparable units currently listed for rent nearby; rentals at typical pace (median 15d on market — plan ~3-4 weeks tenant-placement turnaround); 2,614 units permitted in Oakland County in 2024 (721 in 5+ unit buildings).
Forward outlook
- Local home prices are declining (-3.0%/yr); year-one equity from $1k of loan paydown is wiped out by about $6k of value loss. Plan a longer hold.
- Oakland County population projected at +10% by 2050 — modest demand growth; plan on rents tracking national, not racing it.
Negotiation context
- Only 7 days on market — expect competitive offers; lowballing is unlikely to land.
- 9 sale attempts since 28y ago; this cycle's ask is 8% above the opening price — seller raised mid-cycle; expect resistance to lowballs.
Questions for the listing agent
- Built in 1972 — when were the roof, HVAC, electrical panel, plumbing, and water heater last replaced?
- What does the HOA fee cover, when was the last increase, and are there any pending special assessments or reserve-fund shortfalls?
- Any open or pending special assessments — roof, HVAC, plumbing, elevator, façade? What's the per-unit balance and payoff schedule, and is the seller paying it off at close or rolling it to the buyer?
- Is there a deadline driving the sale (1031 exchange, divorce, estate, relocation)? That informs how much negotiation room exists.
- What's the average days-on-market for RENTAL listings here right now (not sales)? A rising rental-DOM trend means longer vacancies and softer asking-rent achievability than the comps imply.
- What's the recent tenant-quality profile in this submarket — average credit score on applications, eviction rate, late-payment / NSF rate, and stable-employment percentage? A property-management company in the area should have these aggregated.
- How much new apartment / multifamily construction is in the pipeline within 1–3 miles? Heavy new supply (>2% of stock underway) typically softens rents 12–24 months out; light construction supports rent growth.
Investment metrics
- 1% rule
- 1.20% ✓
- Cap rate
- 7.65%
- Cash-on-cash
- 4.84%
- DSCR
- 1.22
- GRM
- 6.9
CMA / ARV
No comps found within radius.
Projected returns pro-forma
-3.0% appreciation · 3.0% rent growth · sell at horizon
- IRR
- -8.6%
- Equity multiple
- 0.68×
- Total profit
- $-17,788
- Equity at exit
- $29,806
- IRR
- 1.0%
- Equity multiple
- 1.07×
- Total profit
- $3,920
- Equity at exit
- $17,284
Cash invested: $55,972 (down + closing). Projections, not guarantees.
Landlord ↔ Tenant lean methodology
- Overall (STATE)
- 62 Landlord-Friendly
- State Michigan
- 62 Landlord-Friendly · EVEN
- County
- — inherits STATE
- City
- — inherits STATE
ZIP-level market 48362
- Active inventory
- 88
- Price-to-rent
- 6.9×
Monthly cashflow live
- Estimated rent
- $2,407 high interval (Pro) →
- Mortgage (P&I)
- −$1,048
- Tax from tax record
- −$210 /mo · $2,522/yr
- Insurance
- −$83
- HOA
- −$334
- Vacancy / Maint / Mgmt
- −$506
- Net cashflow
- $226
Break-even live
UW: 25.0% down · 7.5% · 30yr · 1.5% tax · 5.0% vac · 8.0% maint · 8.0% mgmt
Financing live
Cash to close
- Down payment
- $49,975
- Closing costs
- $5,997
- Reserves months
- —
- Total cash needed
- —
Loan-product check · same deal, 3 products live
Conventional
25% down · 7.5% · 30yr
- Down + closing
- —
- Monthly P&I
- —
- Monthly cashflow
- —
- DSCR
- —
- Eligible?
- —
Personal DTI + credit; lowest rate.
DSCR
20% down · 8.5% · 30yr
- Down + closing
- —
- Monthly P&I
- —
- Monthly cashflow
- —
- DSCR
- —
- Eligible?
- —
No personal income docs; deal must DSCR.
Hard money
10% down · 12.0% · 12mo
- Down + closing
- —
- Monthly P&I
- —
- Monthly cashflow
- —
- DSCR
- —
- Eligible?
- —
Short-term bridge; refi at stabilization.
Rent comps 7 comps
| Address | Beds | Baths | Sqft | Rent | $/sqft | DOM | Units | Dist |
|---|---|---|---|---|---|---|---|---|
| 733 Luna Ct Lake Orion, MI | 3.0 | 1.5 | 1177 | $2,695 | $2.29 | 19d | 1 | 0.38mi |
| 120 S Broadway St Lake Orion, MI | 2.0 | 2.0 | 1065 | $2,950 | $2.77 | 14d | 1 | 0.60mi |
| 120 S Broadway St Lake Orion, MI | 1.0 | 1.0 | 751 | $1,695 | $2.26 | 10d | 1 | 0.60mi |
| 442 Mystic Cove Ln Lake Orion, MI | 2.0–4.0 | 2.0–3.0 | 1989 | $4,850 | $2.44 | 1d | 4 | 0.61mi |
| 45 E Jackson St Apt 2 Lake Orion, MI | 1.0 | 1.0 | 750 | $1,100 | $1.47 | 43d | 1 | 0.64mi |
| 784 Porteous Dr Lake Orion, MI | 2.0 | 1.0 | 875 | $1,600 | $1.83 | 43d | 1 | 0.86mi |
| 711 Kimberly Lake Orion, MI | 1.0–2.0 | 1.0–1.5 | 985 | $1,149 | $1.17 | 1d | 6 | 0.88mi |
HOA detail condo
- Monthly dues
- $334 · $4,008/yr
- Likely covers
- waterpool
- Assessments
- None detected in remarks — confirm with the listing agent.
Listing history 7 events
-
2026-06-17status $199,900 Pending 7 DOM
-
2026-06-17days on market $199,900 Active 7 DOM
-
2026-06-16days on market $199,900 Active 6 DOM
-
2026-06-15days on market $199,900 Active 5 DOM
-
2026-06-13statusdays on market $199,900 Active 3 DOM
-
2026-06-10remarks 699-char remark
-
2026-06-10$199,900 Coming Soon 1 DOM
ⓘ Source: listings_history table (triggers on properties + properties_extension) + one-shot
backfill from property_details.listing_events for pre-trigger history.
Tax reassessment forecast MI · Partial reset (capped growth)
- Current annual tax
- $2,522 · $210/mo
- Projected year-2 tax
- $2,800 · $233/mo
- Expected delta
- +$278/yr (+$23/mo · 11.0%)
ⓘ Screening estimate from a state-policy table — verify with the county assessor before closing.
Climate risk First Street
- Flood 1/10 Low FEMA zone X (unshaded) · 0% chance over 30 yrs
- Wildfire 1/10 Low
- Heat 2/10 Low 7 d/yr ≥97°F today · 15 d/yr by 30 yrs out
- Wind 2/10 Low
- Air quality 3/10 Moderate 2 unhealthy d/yr today · 4 by 30 yrs out
Nearby sold comps map
Loading sold comps map…
Walkable amenities ~0.75 mi
Loading nearby amenities…
Taxation est. · year 1
- Rental income
- $28,886
- − Mortgage interest
- −$11,198
- − Property taxes
- −$2,522
- − Insurance
- −$1,000
- − Repairs & maintenance
- −$2,311
- − Management
- −$2,311
- − HOA
- −$4,008
- − Depreciation
- −$5,815
- Taxable loss
- −$278
- Est. tax savings @ 24.0%
- +$67
- After-tax cash flow
- $2,778/yr
For passive investors: Depreciation is non-cash, so a rental often shows a tax loss while cash-flowing — sheltering income. Rental losses are passive: they offset passive income freely, and up to $25,000/yr can offset ordinary (W-2) income if you actively participate and your MAGI is under $100k (phasing out to $0 by $150k); unused losses carry forward. On sale, claimed depreciation is recaptured at up to 25%, and gains may owe capital-gains tax (a 1031 exchange can defer both). Figures are a year-1 estimate at your 24.0% rate — not tax advice; consult a CPA.
Schools (NCES district)
- District
- Lake Orion Community Schools
- NCES district ID
- 2620730
- Math proficiency
- 49% ▼ -10.00%
- Reading proficiency
- 64% ▼ -10.00%
- Median HH income
- $82,396
- Composite
- 51.21/100
- National rank
- #1755
- State rank
- #45 of 540 in MI
Livability — Orion
No livability data for this city. (Only ~50 U.S. cities are tracked.)
Census & demographics
- City population
- 10,401
- Population (ZIP)
- 14,746
Population outlook (Oakland County) Hauer SSP2
- Today (2025)
- 1,335,747 people
- By 2030
- 1,375,100 · +2.9%
- By 2040
- 1,435,385 · +7.5%
- By 2050
- 1,469,250 · +10.0%
- By 2075
- 1,531,946 · +14.7%
- By 2100
- 1,450,485 · +8.6%
Race, ethnicity, and origin ACS 2023
- Neighborhood character
- Predominantly White (88%)
- Race & ethnicity
- White 88% Two or more races 5% Hispanic / Latino 4% Black 2% Asian 2%
- Common ancestry
- Romanian 11% Lithuanian 5% Slovak 3%
- Foreign-born
- 6% · Canada, China, Dominican Republic
- Languages at home
- 95% English-only · Spanish 1% Chinese 1% German/W. Germanic 1%
Political lean MEDSL · Oakland
- 2024 margin
- D (+10.6) · D 54.4% · R 43.8% · Other 1.9%
- 2008→2024 swing
- -3.9pp toward R · 2008: 14.5pp · 2024: 10.6pp
- All cycles
- 2024: D+10.6 2020: D+14.1 2016: D+8.1 2012: D+8.1 2008: D+14.5
Not yet ingested
- Civics
- —
Market trends
- HPI YoY
- ▼ -307.96%
- Current HPI
- 182.3653
- Rent YoY
- —
- Metro
- —
- State GDP YoY
- ▲ 1.37%
- F500 in state
- 28
Industry mix (Fortune 500 HQ in MI)
| Industry | F500 HQs | Revenue |
|---|---|---|
| Automotive Parts | 3 | $48B |
|
||
| Automotive | 2 | $372B |
|
||
| Chemicals | 1 | $45B |
|
||
| Automotive Retail | 1 | $29B |
|
||
| Healthcare / Medical Devices | 1 | $23B |
|
||
| Automotive Technology | 1 | $20B |
|
||
Price history
+225.0% since first listed39 events — show timeline
- 2026-06-09 Coming Soon $199,900 MiRealSource-MiMLS
- 2023-10-20 Sold (Public Records) $185,000 Public Records
- 2023-10-17 Sold (MLS) $185,000 MiRealSource-MiMLS
- 2023-10-17 Sold (MLS) $185,000 REALCOMP
- 2023-09-14 Pending — MiRealSource-MiMLS
- 2023-09-14 Pending — REALCOMP
- 2023-09-08 Listed $185,000 MiRealSource-MiMLS
- 2023-09-08 Listed $185,000 REALCOMP
- 2023-09-07 Coming Soon $185,000 MiRealSource-MiMLS
- 2023-09-07 Coming Soon $185,000 REALCOMP
- 2021-07-22 Sold (Public Records) $147,000 Public Records
- 2021-07-19 Sold (MLS) $147,000 MiRealSource-MiMLS
- 2021-07-19 Sold (MLS) $147,000 REALCOMP
- 2021-07-13 Listing Removed — REALCOMP
- 2021-06-22 Pending — MiRealSource-MiMLS
- 2021-06-22 Pending — REALCOMP
- 2021-06-18 Listed $140,000 MiRealSource-MiMLS
- 2021-06-18 Listed $140,000 REALCOMP
- 2016-09-08 Sold (Public Records) $87,000 Public Records
- 2016-08-25 Sold (MLS) $87,000 MiRealSource-MiMLS
- 2016-08-25 Sold (MLS) $87,000 REALCOMP
- 2016-07-09 Pending — MiRealSource-MiMLS
- 2016-07-09 Pending — REALCOMP
- 2016-06-03 Price Changed $87,000 MiRealSource-MiMLS
- 2016-06-03 Price Changed $87,000 REALCOMP
- 2016-05-17 Price Changed $90,000 MiRealSource-MiMLS
- 2016-05-17 Price Changed $90,000 REALCOMP
- 2016-04-22 Listed $95,000 MiRealSource-MiMLS
- 2016-04-21 Listed $95,000 REALCOMP
- 2012-03-21 Sold (MLS) $43,000 MiRealSource-MiMLS
- 2012-03-21 Sold (MLS) $43,000 REALCOMP
- 2012-02-17 Listed $43,000 MiRealSource-MiMLS
- 2012-02-17 Listed $43,000 REALCOMP
- 2007-09-06 Sold (Public Records) $112,000 Public Records
- 2004-01-13 Sold (Public Records) $123,000 Public Records
- 1998-11-24 Sold (Public Records) $103,000 Public Records
- 1998-10-26 Sold (MLS) $103,000 REALCOMP
- 1998-07-31 Listed $105,900 REALCOMP
- 1991-09-13 Sold (Public Records) $61,500 Public Records
Property tax history
+5.5%/yrLatest (2025): $2,522 · +2.7% YoY. Source: county tax records.
Cash-flow waterfall
monthlySold comps — $/sqft
last 12 mo · ≤1 miLoading sold comps…