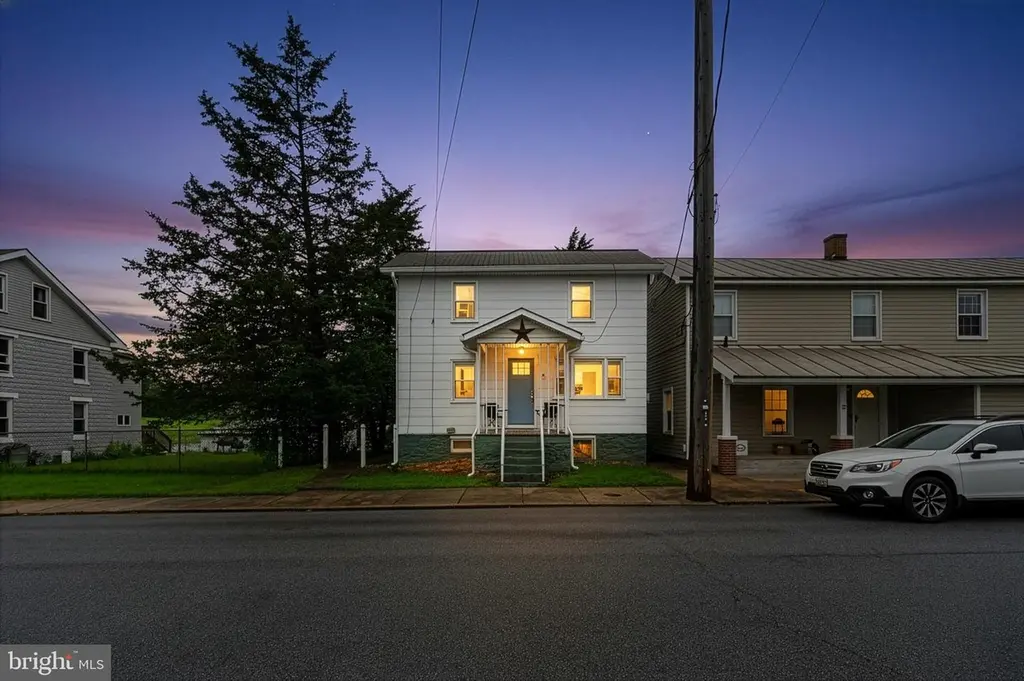
14 Whyte St · Union Bridge, MD
Flood risk 1/10 · Minimal
- FEMA flood zone
- X (unshaded)
- Chance of flooding over 30 yrs
- 0.0%
- Est. flood insurance / yr
- $473 – $860
Fire risk 1/10 · Minimal
- Est. fire insurance / yr
- $755 – $1,403
Heat risk 6/10 · Moderate
- Hot days now (above 103°F)
- 7 days/yr
- Hot days in 30 yrs
- 16 days/yr
Wind risk 4/10 · Minor
- Chance of severe wind over 30 yrs
- 9.0%
Air-quality risk 2/10 · Minimal
- Unhealthy air days now
- 1 days/yr
- Unhealthy air days in 30 yrs
- 2 days/yr
Risk factors via First Street. Map © Google.
Why this score? — see what drove the C- grade
The composite is a weighted blend of 9 inputs, each scored 0–100. Each bar is that input's sub-score; the figure is the points it added to the 100-point composite (weight × sub-score).
- Cash flow +15.6/30.0
- ARV discount +15.0/15.0
- DSCR +4.8/10.0
- 1% rule +4.3/10.0
- Schools +3.7/10.0
- Livability +2.9/5.0
- Rent growth +2.5/5.0
- Condition / age +2.5/5.0
- Appreciation +0.0/10.0
$155,000
🖨 Deal sheet (PDF) 📄 Offer letter ✓ Due diligence
Listing remarks MLS
This home was built in 1895 and offers more than 1,550 square feet of living space. The home features a large eat in kitchen, fierplace, built in shelves, wood flooring, a nice back yard, a full basement, and a covered porch.
Key facts
- 6,452 sq ft lot
- Built 1895
- Listed 6 days
Property features AI
Finance
- HOA & community: Ground rent paid annually
Exterior
- Parking: On-street parking
- Utilities: Electric hot water
- Home design: Detached structure
- Construction: Built (year sourced from assessor); Asbestos and block construction; Block foundation; Above-grade and below-grade structures
- Exterior features: Public water; Public sewer
Interior
- Bedrooms: Three bedrooms on the first upper level
- Bathrooms: Two full bathrooms (one on the main level, one on the first upper level)
- Heating & cooling: Baseboard electric heating; Wall unit cooling (electric)
- Interior features: Partially finished basement
Neighborhood map
What this means for you Summary
Snapshot
- This is a 3-bed/2.0-bath single-family listed at $155k.
Deal economics
- At list price, monthly cash flow is $66 ($793/yr) — positive.
- The deal already cash-flows at list — no discount required.
- To meet the 1% rule (rent ≥ 1% of price), the offer needs to be $144k (7.3% below list).
- Recommended offer: $144k (7.3% below list) — sets the bar for 1% rule.
Location & tenants
- Location reads 57/100 on livability (#400 in MD) — a working-class tenant base; expect higher turnover. Strengths: housing A+, cost of living A-; Watch: crime F, amenities F, commute F.
- Carroll County Public Schools (suburban): math 32% / reading 47% proficiency, ranked #2 of 24 in MD (top 8%) — families likely to look elsewhere, expect single-tenant / working-renter base with shorter leases; only 16% free/reduced lunch — higher-income household profile.
- Zoned schools: Elmer A. Wolfe Elementary (math 22% / reading 27%, grade F, #260 of 860 statewide, top 33%, 480 students, 45% FRL); Northwest Middle (math 12% / reading 38%, grade F, #104 of 225 statewide, top 47%, 637 students, 44% FRL); Francis Scott Key High (math 47% / reading 67%, grade C, #80 of 222 statewide, top 37%, 944 students, 41% FRL) — zoned schools average 43% FRL vs 16% district-wide (28 pts higher); higher-poverty schools than district average — tighter screening recommended.
- Market conditions: 19 active listings in the ZIP; 156 units permitted in Carroll County in 2024 (12 in 5+ unit buildings).
Forward outlook
- Local home prices are declining (-3.0%/yr); year-one equity from $1k of loan paydown is wiped out by about $5k of value loss. Plan a longer hold.
- Carroll County population projected to shrink 7% by 2050 — rents likely to lag national; underwrite the cash flow, not the appreciation.
Negotiation context
- Only 6 days on market — expect competitive offers; lowballing is unlikely to land.
- 10 sale attempts since 29y ago; this cycle's ask is 65% above the opening price — seller raised mid-cycle; expect resistance to lowballs.
- Current owner paid $99k; list at $155k implies a 57% gain — meaningful room to come down on a strong offer.
Risks & watch-outs
- Watch-outs: built in 1895 — expect roof / HVAC / electrical / plumbing capex.
- Climate carrying-cost: extreme-heat days projected 7→16/yr by 2055 (HVAC capex compounding) — expect insurance premiums to compound above CPI over the hold.
Questions for the listing agent
- Built in 1895 — when were the roof, HVAC, electrical panel, plumbing, and water heater last replaced?
- Is there a deadline driving the sale (1031 exchange, divorce, estate, relocation)? That informs how much negotiation room exists.
- Schools are D-rated, which usually means shorter tenancies and higher turnover. Who's the typical renter profile here, and what's been the actual vacancy rate?
- Crime grade is F in this area — have there been break-ins, vandalism, or insurance claims at this property in the last 3 years? What carrier currently insures it and at what premium?
- What's the average days-on-market for RENTAL listings here right now (not sales)? A rising rental-DOM trend means longer vacancies and softer asking-rent achievability than the comps imply.
- What's the recent tenant-quality profile in this submarket — average credit score on applications, eviction rate, late-payment / NSF rate, and stable-employment percentage? A property-management company in the area should have these aggregated.
- How much new for-sale + rental construction is in the pipeline within 1–3 miles? Heavy new supply typically softens prices + rents 12–24 months out; constrained supply supports both.
Investment metrics
- 1% rule
- 0.93% ✗
- Cap rate
- 6.80%
- Cash-on-cash
- 1.83%
- DSCR
- 1.08
- GRM
- 9.0
CMA / ARV
- ARV (on-the-fly)
- $291,456
- Comps found
- 9
Show comp detail 9 sales within ~0.75 mi
| Address | Dist | Beds/Ba | Sqft | Sold | Price | $/sf | Match |
|---|---|---|---|---|---|---|---|
| 10 Whyte St | 0.02mi | 3/2.0 | 1,650 (+4%) | 8mo | $276,000 | $167 | 86 |
| 32 S Main St | 0.13mi | 3/1.5 | 1,624 (+2%) | 21mo | $325,000 | $200 | 70 |
| 20 Whyte St | 0.02mi | 2/1.0 (-1) | 1,408 (-11%) | 10mo | $145,000 | $103 | 63 |
| 8 E Elger St | 0.25mi | 3/1.5 | 1,472 (-7%) | 16mo | $212,000 | $144 | 62 |
| 317 Thomas St | 0.47mi | 3/2.0 | 1,512 (-4%) | 11mo | $300,000 | $198 | 61 |
| 314 E Broadway St | 0.47mi | 3/2.5 | 1,448 (-9%) | 1mo | $267,000 | $184 | 61 |
| 1 Farquhar St | 0.29mi | 4/1.0 (+1) | 1,692 (+7%) | 15mo | $300,000 | $177 | 54 |
| 147 Union Bridge Rd | 0.74mi | 2/2.0 (-1) | 1,464 (-8%) | 4mo | $285,900 | $195 | 44 |
| 108 George St | 0.19mi | 4/2.0 (+1) | 1,800 (+14%) | 23mo | $370,000 | $206 | 44 |
Match score weights: distance 35% · size 25% · config 20% · recency 20%. Top-matched comps best support the ARV.
Projected returns pro-forma
-3.0% appreciation · 3.0% rent growth · sell at horizon
- IRR
- -13.4%
- Equity multiple
- 0.52×
- Total profit
- $-20,886
- Equity at exit
- $23,111
- IRR
- -4.4%
- Equity multiple
- 0.71×
- Total profit
- $-12,682
- Equity at exit
- $13,402
Cash invested: $43,400 (down + closing). Projections, not guarantees.
Landlord ↔ Tenant lean methodology
- Overall (STATE)
- 27 Tenant-Leaning
- State Maryland
- 27 Tenant-Leaning · D+14
- County
- — inherits STATE
- City
- — inherits STATE
ZIP-level market 21791
- Home prices YoY
- -30.6%
- Active inventory
- 19
- Price-to-rent
- 9.0×
Monthly cashflow live
- Estimated rent
- $1,437 medium interval (Pro) →
- Mortgage (P&I)
- −$813
- Tax from tax record
- −$191 /mo · $2,296/yr
- Insurance
- −$65
- HOA
- −$0
- Vacancy / Maint / Mgmt
- −$302
- Net cashflow
- $66
Break-even live
Sensitivity live
| Price | -10% $154 | -5% $110 | +0% $66 | +5% $22 | +10% $-22 |
|---|---|---|---|---|---|
| Rent | -10% $-47 | -5% $9 | +0% $66 | +5% $123 | +10% $180 |
| Rate | -1.0pp $144 | -0.5pp $106 | base $66 | +0.5pp $26 | +1.0pp $-15 |
UW: 25.0% down · 7.5% · 30yr · 1.5% tax · 5.0% vac · 8.0% maint · 8.0% mgmt
Financing live
Cash to close
- Down payment
- $38,750
- Closing costs
- $4,650
- Reserves months
- —
- Total cash needed
- —
Loan-product check · same deal, 3 products live
Conventional
25% down · 7.5% · 30yr
- Down + closing
- —
- Monthly P&I
- —
- Monthly cashflow
- —
- DSCR
- —
- Eligible?
- —
Personal DTI + credit; lowest rate.
DSCR
20% down · 8.5% · 30yr
- Down + closing
- —
- Monthly P&I
- —
- Monthly cashflow
- —
- DSCR
- —
- Eligible?
- —
No personal income docs; deal must DSCR.
Hard money
10% down · 12.0% · 12mo
- Down + closing
- —
- Monthly P&I
- —
- Monthly cashflow
- —
- DSCR
- —
- Eligible?
- —
Short-term bridge; refi at stabilization.
Listing history 40 events
-
2026-06-07status $155,000 Pending 6 DOM
-
2026-06-02statusdays on market $155,000 Active Under Contract 6 DOM
-
2026-06-01days on market $155,000 Active 5 DOM
-
2026-05-31days on market $155,000 Active 4 DOM
-
2026-05-26historical $155,000
-
2017-07-28soldstatus $98,529 225-char remark
Show marketing remark (227 chars)
This home was built in 1895 and offers more than 1,550 square feet of living space. ~ The home features a large eat in kitchen, fierplace, built in shelves, wood flooring, a nice back yard, a full basement, and a covered porch.
-
2017-07-28soldstatus $98,529 Sold 227-char remark
Show marketing remark (227 chars)
This home was built in 1895 and offers more than 1,550 square feet of living space. ~ The home features a large eat in kitchen, fierplace, built in shelves, wood flooring, a nice back yard, a full basement, and a covered porch.
-
2017-05-03status Contract 227-char remark
Show marketing remark (227 chars)
This home was built in 1895 and offers more than 1,550 square feet of living space. ~ The home features a large eat in kitchen, fierplace, built in shelves, wood flooring, a nice back yard, a full basement, and a covered porch.
-
2017-04-14price $83,900 227-char remark
Show marketing remark (227 chars)
This home was built in 1895 and offers more than 1,550 square feet of living space. ~ The home features a large eat in kitchen, fierplace, built in shelves, wood flooring, a nice back yard, a full basement, and a covered porch.
-
2017-04-10$93,900 Active 227-char remark
Show marketing remark (227 chars)
This home was built in 1895 and offers more than 1,550 square feet of living space. ~ The home features a large eat in kitchen, fierplace, built in shelves, wood flooring, a nice back yard, a full basement, and a covered porch.
-
2017-04-10historical
Show marketing remark (227 chars)
This home was built in 1895 and offers more than 1,550 square feet of living space. ~ The home features a large eat in kitchen, fierplace, built in shelves, wood flooring, a nice back yard, a full basement, and a covered porch.
-
2017-04-10
Show marketing remark (227 chars)
This home was built in 1895 and offers more than 1,550 square feet of living space. ~ The home features a large eat in kitchen, fierplace, built in shelves, wood flooring, a nice back yard, a full basement, and a covered porch.
-
2017-04-10historical Withdrawn
Show marketing remark (227 chars)
This home was built in 1895 and offers more than 1,550 square feet of living space. ~ The home features a large eat in kitchen, fierplace, built in shelves, wood flooring, a nice back yard, a full basement, and a covered porch.
-
2017-04-10historical
Show marketing remark (227 chars)
This home was built in 1895 and offers more than 1,550 square feet of living space. ~ The home features a large eat in kitchen, fierplace, built in shelves, wood flooring, a nice back yard, a full basement, and a covered porch.
-
2017-04-10$93,900
Show marketing remark (227 chars)
This home was built in 1895 and offers more than 1,550 square feet of living space. ~ The home features a large eat in kitchen, fierplace, built in shelves, wood flooring, a nice back yard, a full basement, and a covered porch.
-
2017-04-10historical
Show marketing remark (227 chars)
This home was built in 1895 and offers more than 1,550 square feet of living space. ~ The home features a large eat in kitchen, fierplace, built in shelves, wood flooring, a nice back yard, a full basement, and a covered porch.
-
2017-04-03status Active
-
2017-03-30historical Withdrawn
-
2017-03-15price
-
2017-02-21price
-
2017-01-30price
-
2017-01-13price
-
2016-12-29price
-
2016-12-14price
-
2016-12-07price
-
2016-11-03Active
-
2016-11-03$93,900
-
2009-07-27historical
-
2009-07-27historical
-
2009-03-15price
-
2009-01-26
-
2009-01-26$175,000
-
2001-08-06soldstatus $99,000
-
2001-07-27soldstatus $99,000
-
2001-06-17historical
-
2001-05-24$102,000
-
1998-02-13soldstatus $93,000
-
1997-08-29soldstatus $93,000
-
1997-06-23historical
-
1997-03-06$92,900
ⓘ Source: listings_history table (triggers on properties + properties_extension) + one-shot
backfill from property_details.listing_events for pre-trigger history.
Tax reassessment forecast MD · Partial reset (capped growth)
- Current annual tax
- $2,296 · $191/mo
- Projected year-2 tax
- $2,296 · $191/mo
- Expected delta
- $0/yr ($0/mo · 0.0%)
ⓘ Screening estimate from a state-policy table — verify with the county assessor before closing.
Climate risk First Street
- Flood 1/10 Low FEMA zone X (unshaded) · 0% chance over 30 yrs
- Wildfire 1/10 Low
- Heat 6/10 Major 7 d/yr ≥103°F today · 16 d/yr by 30 yrs out
- Wind 4/10 Moderate 9% chance of damaging wind over 30 yrs
- Air quality 2/10 Low 1 unhealthy d/yr today · 2 by 30 yrs out
Nearby sold comps map
Loading sold comps map…
Walkable amenities ~0.75 mi
Loading nearby amenities…
Taxation est. · year 1
- Rental income
- $17,239
- − Mortgage interest
- −$8,682
- − Property taxes
- −$2,296
- − Insurance
- −$775
- − Repairs & maintenance
- −$1,379
- − Management
- −$1,379
- − Depreciation
- −$4,509
- Taxable loss
- −$1,782
- Est. tax savings @ 24.0%
- +$428
- After-tax cash flow
- $1,221/yr
For passive investors: Depreciation is non-cash, so a rental often shows a tax loss while cash-flowing — sheltering income. Rental losses are passive: they offset passive income freely, and up to $25,000/yr can offset ordinary (W-2) income if you actively participate and your MAGI is under $100k (phasing out to $0 by $150k); unused losses carry forward. On sale, claimed depreciation is recaptured at up to 25%, and gains may owe capital-gains tax (a 1031 exchange can defer both). Figures are a year-1 estimate at your 24.0% rate — not tax advice; consult a CPA.
Schools (NCES district)
- District
- Carroll County Public Schools
- NCES district ID
- 2400210
- Math proficiency
- 32% ▼ -25.00%
- Reading proficiency
- 47% ▼ -16.00%
- Median HH income
- $84,594
- Composite
- 37.33/100
- National rank
- #4441
- State rank
- #2 of 24 in MD
Livability — Union Bridge
- Score
- 57/100
- State rank
- #400
- US rank
- #22031
Category grades
Schools grade is shown separately in the Schools card above.
Census & demographics
- Census place
- Union Bridge, MD
- Population (ZIP)
- 4,734
Population outlook (Carroll County) Hauer SSP2
- Today (2025)
- 169,677 people
- By 2030
- 169,605 · +-0.0%
- By 2040
- 166,205 · -2.0%
- By 2050
- 158,312 · -6.7%
- By 2075
- 143,013 · -15.7%
- By 2100
- 122,431 · -27.8%
Race, ethnicity, and origin ACS 2023
- Neighborhood character
- Predominantly White (94%)
- Race & ethnicity
- White 94% Asian 2% Black 2% Two or more races 1% Hispanic / Latino 1%
- Common ancestry
- Lithuanian 3% Slovak 3% Italian 2%
- Foreign-born
- 2% · South Korea, Canada
- Languages at home
- 98% English-only · Other Asian/Pacific 1%
Political lean MEDSL · Carroll
- 2024 margin
- Strong R (+24.9) · D 36.2% · R 61.2% · Other 2.6%
- 2008→2024 swing
- +6.2pp toward D · 2008: -31.2pp · 2024: -24.9pp
- All cycles
- 2024: R+24.9 2020: R+23.7 2016: R+36.9 2012: R+34.0 2008: R+31.2
Not yet ingested
- Civics
- —
Market trends
- HPI YoY
- ▼ -122.95%
- Current HPI
- 279.495
- Rent YoY
- —
- Metro
- —
- State GDP YoY
- ▲ 2.97%
- F500 in state
- 12
Industry mix (Fortune 500 HQ in MD)
| Industry | F500 HQs | Revenue |
|---|---|---|
| Aerospace / Defense | 1 | $71B |
|
||
| Utilities | 1 | $25B |
|
||
| Hotels | 1 | $24B |
|
||
| Consumer Goods | 1 | $7B |
|
||
| Real Estate | 1 | $6B |
|
||
| Chemicals | 1 | $2B |
|
||
Price history
+66.8% since first listed36 events — show timeline
- 2026-05-26 Coming Soon $155,000 BRIGHT MLS
- 2017-07-28 Sold (MLS) $98,529 MRIS
- 2017-07-28 Sold (MLS) $98,529 BRIGHT MLS
- 2017-05-03 Pending — MRIS
- 2017-04-14 Price Changed $83,900 MRIS
- 2017-04-10 Listed $93,900 MRIS
- 2017-04-10 Listing Removed — BRIGHT MLS
- 2017-04-10 Listed $93,900 BRIGHT MLS
- 2017-04-10 Listing Removed — BRIGHT MLS
- 2017-04-10 Delisted — MRIS
- 2017-04-10 Listed — MRIS
- 2017-04-10 Delisted — MRIS
- 2017-04-03 Relisted — MRIS
- 2017-03-30 Delisted — MRIS
- 2017-03-15 Price Changed — MRIS
- 2017-02-21 Price Changed — MRIS
- 2017-01-30 Price Changed — MRIS
- 2017-01-13 Price Changed — MRIS
- 2016-12-29 Price Changed — MRIS
- 2016-12-14 Price Changed — MRIS
- 2016-12-07 Price Changed — MRIS
- 2016-11-03 Listed — MRIS
- 2016-11-03 Listed $93,900 BRIGHT MLS
- 2009-07-27 Delisted — MRIS
- 2009-07-27 Listing Removed — BRIGHT MLS
- 2009-03-15 Price Changed — MRIS
- 2009-01-26 Listed — MRIS
- 2009-01-26 Listed $175,000 BRIGHT MLS
- 2001-08-06 Sold (Public Records) $99,000 Public Records
- 2001-07-27 Sold (MLS) $99,000 MRIS
- 2001-06-17 Delisted — MRIS
- 2001-05-24 Listed $102,000 MRIS
- 1998-02-13 Sold (Public Records) $93,000 Public Records
- 1997-08-29 Sold (MLS) $93,000 MRIS
- 1997-06-23 Delisted — MRIS
- 1997-03-06 Listed $92,900 MRIS
Property tax history
+1.9%/yrLatest (2025): $2,296 · +8.1% YoY. Source: county tax records.
Cash-flow waterfall
monthlySold comps — $/sqft
last 12 mo · ≤1 miLoading sold comps…