5321 Waterbury Dr #502 · Crestwood, IL
Flood risk 1/10 · Minimal
- FEMA flood zone
- X (unshaded)
- Chance of flooding over 30 yrs
- 0.0%
- Est. flood insurance / yr
- $507 – $1,088
Fire risk 1/10 · Minimal
- Est. fire insurance / yr
- $804 – $1,492
Heat risk 3/10 · Minor
- Hot days now (above 102°F)
- 7 days/yr
- Hot days in 30 yrs
- 15 days/yr
Wind risk 2/10 · Minimal
- Chance of severe wind over 30 yrs
- —
Air-quality risk 4/10 · Minor
- Unhealthy air days now
- 4 days/yr
- Unhealthy air days in 30 yrs
- 5 days/yr
Risk factors via First Street. Map © Google.
Why this score? — see what drove the C- grade
The composite is a weighted blend of 9 inputs, each scored 0–100. Each bar is that input's sub-score; the figure is the points it added to the 100-point composite (weight × sub-score).
- Cash flow +21.3/30.0
- 1% rule +8.6/10.0
- ARV discount +7.5/15.0
- DSCR +6.8/10.0
- Livability +4.1/5.0
- Rent growth +2.5/5.0
- Condition / age +2.5/5.0
- Schools +1.5/10.0
- Appreciation +0.0/10.0
$131,000
🖨 Deal sheet 📄 Offer letter ✓ Due diligence
Listing remarks MLS
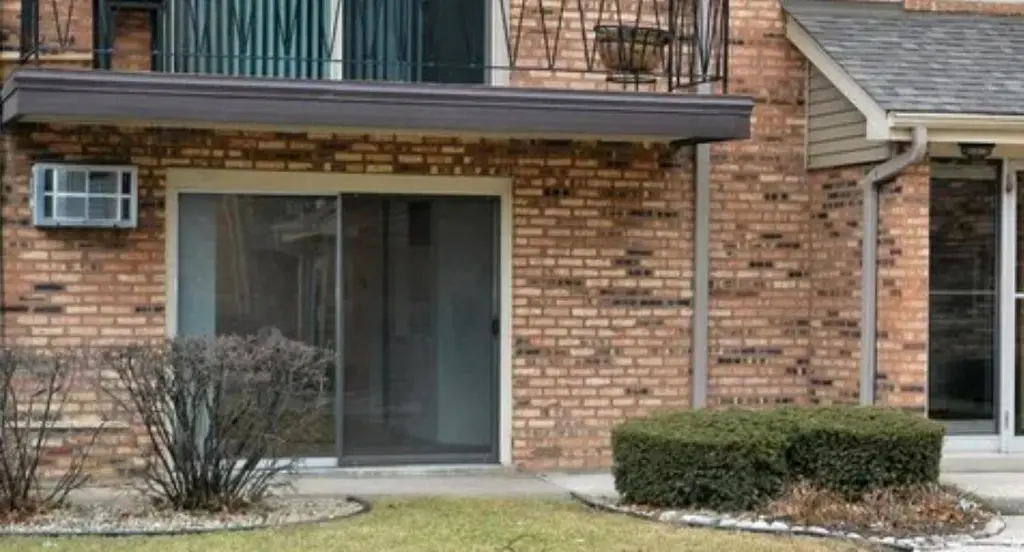
Why throw money away renting when you can own this spacious 1 Bedroom Condo!! Master Bedroom is huge, kitchen is eat-in, 2 Ceiling fans with lights in unit. Building is Flexicore constructed to eliminate sound for peaceful living. Laundry is on the main level right out the back door. Nice outdoor patio surrounded by lush landscaping. Enjoy your Summer days by the beautiful in-ground pool and enjoy the tennis courts.
Key facts
- Ample storage space
- Private patio
- Near local amenities
Tags
Property features AI
Finance
- Other: School bus service, commuter bus and interstate access available
- HOA & community: Monthly association fee of $308; Association covers heat, water, gas, parking, pool, lawn care, trash (scavenger) and snow removal; Pets not allowed
Exterior
- Parking: 1 parking space (total)
- Utilities: Water: Lake Michigan and public; Sewer: Public sewer
- Home design: Attached single condo; Entry level 1
- Construction: Brick construction; Asphalt roof; Concrete perimeter foundation; Building age: 41-50 years; Part of a 6-unit building
- Exterior features: Patio
Interior
- Kitchen: Kitchen on main level (approx. 12 x 11)
- Bedrooms: Master bedroom on main level (approx. 14 x 11); Additional bedrooms (2 listed)
- Bathrooms: 1 full bathroom
- Heating & cooling: Steam heat; Window AC unit(s)
- Interior features: 5 total rooms; Living room on main level (approx. 12 x 22); Family room on main level; Dining room on main level
- Laundry & utility: Laundry room on main level
Neighborhood map
What this means for you Summary
Snapshot
- This is a 1-bed/1.0-bath condo listed at $131k.
Deal economics
- At list price, monthly cash flow is $192 ($2k/yr) — positive.
- The deal already cash-flows at list — no discount required.
- Meets the 1% rule at list price ($2k rent vs $131k).
- Recommended offer: $123k (6.0% below list) — sets the bar for market timing.
- Cap rate 8.1% vs local median 4.9% in Crestwood — top-decile yield for the area; either an underpriced asset or a hidden risk that comps aren't pricing in. Stress-test before assuming the spread holds.
Location & tenants
- Location reads 82/100 on livability (#75 in IL, #1,220 nationally) — a professional / high-income tenant draw. Strengths: commute A+, cost of living A+, housing A+; Watch: schools D-.
- Bremen Chsd 228 (suburban): math 15% / reading 17% proficiency, ranked #468 of 620 in IL (top 76%) — low school quality limits family demand, transient renter base, plan for 1-2y turnover.
- Market conditions: 30 active listings in the ZIP; 6 comparable units currently listed for rent nearby; rentals leasing fast (median 8d on market — plan ~1-2 weeks tenant-placement turnaround); 6,272 units permitted in Cook County in 2024 (4,658 in 5+ unit buildings).
Forward outlook
- Local home prices are declining (-3.0%/yr); year-one equity from $906 of loan paydown is wiped out by about $4k of value loss. Plan a longer hold.
Negotiation context
- It's been on market 69 days — a 6% lower offer ($123k) is reasonable based on typical stale-listing flexibility.
- 2 sale attempts since 9y ago with the ask held roughly flat each time — persistent listings suggest the price (not the market) is what's stuck; bring a comps-based counter.
- Current owner paid $40k; list at $131k implies a 232% gain — meaningful room to come down on a strong offer.
Questions for the listing agent
- It's been on market 69 days. Have you received any prior offers? Is the seller open to a 6% concession, seller financing, or rate buy-down credit?
- Built in 1979 — when were the roof, HVAC, electrical panel, plumbing, and water heater last replaced?
- What does the HOA fee cover, when was the last increase, and are there any pending special assessments or reserve-fund shortfalls?
- Any open or pending special assessments — roof, HVAC, plumbing, elevator, façade? What's the per-unit balance and payoff schedule, and is the seller paying it off at close or rolling it to the buyer?
- Why hasn't it sold? Are there any deal-killer items the seller is aware of (foundation, flood, title, zoning, code violations)?
- Is there a deadline driving the sale (1031 exchange, divorce, estate, relocation)? That informs how much negotiation room exists.
- Schools are D-rated, which usually means shorter tenancies and higher turnover. Who's the typical renter profile here, and what's been the actual vacancy rate?
- What's the average days-on-market for RENTAL listings here right now (not sales)? A rising rental-DOM trend means longer vacancies and softer asking-rent achievability than the comps imply.
- What's the recent tenant-quality profile in this submarket — average credit score on applications, eviction rate, late-payment / NSF rate, and stable-employment percentage? A property-management company in the area should have these aggregated.
- How much new apartment / multifamily construction is in the pipeline within 1–3 miles? Heavy new supply (>2% of stock underway) typically softens rents 12–24 months out; light construction supports rent growth.
Investment metrics
- 1% rule
- 1.36% ✓
- Cap rate
- 8.05%
- Cash-on-cash
- 6.29%
- DSCR
- 1.28
- GRM
- 6.1
CMA / ARV
No comps found within radius.
Projected returns pro-forma
-3.0% appreciation · 3.0% rent growth · sell at horizon
- IRR
- -6.4%
- Equity multiple
- 0.76×
- Total profit
- $-8,766
- Equity at exit
- $19,533
- IRR
- 3.4%
- Equity multiple
- 1.25×
- Total profit
- $9,019
- Equity at exit
- $11,326
Cash invested: $36,680 (down + closing). Projections, not guarantees.
Landlord ↔ Tenant lean methodology
- Overall (STATE)
- 43 Moderately Tenant-Leaning
- State Illinois
- 43 Moderately Tenant-Leaning · D+7
- County
- — inherits STATE
- City
- — inherits STATE
ZIP-level market 60418
- Active inventory
- 30
- Price-to-rent
- 6.1×
Monthly cashflow live
- Estimated rent
- $1,783 high interval (Pro) →
- Mortgage (P&I)
- −$687
- Tax from tax record
- −$167 /mo · $2,002/yr
- Insurance
- −$55
- HOA
- −$308
- Vacancy / Maint / Mgmt
- −$374
- Net cashflow
- $192
Break-even live
UW: 25.0% down · 7.5% · 30yr · 1.5% tax · 5.0% vac · 8.0% maint · 8.0% mgmt
Financing live
Cash to close
- Down payment
- $32,750
- Closing costs
- $3,930
- Reserves months
- —
- Total cash needed
- —
Loan-product check · same deal, 3 products live
Conventional
25% down · 7.5% · 30yr
- Down + closing
- —
- Monthly P&I
- —
- Monthly cashflow
- —
- DSCR
- —
- Eligible?
- —
Personal DTI + credit; lowest rate.
DSCR
20% down · 8.5% · 30yr
- Down + closing
- —
- Monthly P&I
- —
- Monthly cashflow
- —
- DSCR
- —
- Eligible?
- —
No personal income docs; deal must DSCR.
Hard money
10% down · 12.0% · 12mo
- Down + closing
- —
- Monthly P&I
- —
- Monthly cashflow
- —
- DSCR
- —
- Eligible?
- —
Short-term bridge; refi at stabilization.
Rent comps 6 comps
| Address | Beds | Baths | Sqft | Rent | $/sqft | DOM | Units | Dist |
|---|---|---|---|---|---|---|---|---|
| 14033 Laramie Ave #408 Crestwood, IL | 2.0 | 2.0 | 1100 | $2,100 | $1.91 | 7d | 1 | 0.23mi |
| 13615 Royal Ct #309 Crestwood, IL | 2.0 | 2.0 | 1000 | $1,850 | $1.85 | 3d | 1 | 0.70mi |
| 14700 Central Ave Oak Forest, IL | 1.0–2.0 | 1.0 | 775 | $1,125 | $1.45 | 24d | 6 | 1.05mi |
| 14643 Lamon Ave Unit 2B Midlothian, IL | 2.0 | 1.5 | 990 | $1,525 | $1.54 | 24d | 1 | 1.08mi |
| 5723 129th St Crestwood, IL | 2.0 | 1.0 | 950 | $1,600 | $1.68 | 1d | 1 | 1.36mi |
| 15800 S Ridgeland Ave Unit 301 Oak Forest, IL | 2.0 | 1.0 | 1000 | $1,500 | $1.50 | 5d | 1 | 1.48mi |
HOA detail condo
- Monthly dues
- $308 · $3,696/yr
- Likely covers
- landscapingpool
- Assessments
- None detected in remarks — confirm with the listing agent.
Listing history 16 events
-
2026-06-13statusdays on market $131,000 Pending 69 DOM
-
2026-06-09days on market $131,000 Active 66 DOM
-
2026-06-08days on market $131,000 Active 65 DOM
-
2026-06-07days on market $131,000 Active 64 DOM
-
2026-06-04days on market $131,000 Active 61 DOM
-
2026-06-03days on market $131,000 Active 60 DOM
-
2026-06-02status $131,000 Active 59 DOM
-
2026-05-15status Pending
-
2026-05-06price $131,000
-
2026-03-17$132,500 Active
-
2017-02-22soldstatus $39,500
-
2017-02-10soldstatus $39,000 Closed Sale 419-char remark
Show marketing remark (419 chars)
Why throw money away renting when you can own this spacious 1 Bedroom Condo!! Master Bedroom is huge, kitchen is eat-in, 2 Ceiling fans with lights in unit. Building is Flexicore constructed to eliminate sound for peaceful living. Laundry is on the main level right out the back door. Nice outdoor patio surrounded by lush landscaping. Enjoy your Summer days by the beautiful in-ground pool and enjoy the tennis courts.
-
2017-01-26status Contingent (Do Not Show) 419-char remark
Show marketing remark (419 chars)
Why throw money away renting when you can own this spacious 1 Bedroom Condo!! Master Bedroom is huge, kitchen is eat-in, 2 Ceiling fans with lights in unit. Building is Flexicore constructed to eliminate sound for peaceful living. Laundry is on the main level right out the back door. Nice outdoor patio surrounded by lush landscaping. Enjoy your Summer days by the beautiful in-ground pool and enjoy the tennis courts.
-
2017-01-25$39,000 New 419-char remark
Show marketing remark (419 chars)
Why throw money away renting when you can own this spacious 1 Bedroom Condo!! Master Bedroom is huge, kitchen is eat-in, 2 Ceiling fans with lights in unit. Building is Flexicore constructed to eliminate sound for peaceful living. Laundry is on the main level right out the back door. Nice outdoor patio surrounded by lush landscaping. Enjoy your Summer days by the beautiful in-ground pool and enjoy the tennis courts.
-
1994-12-15soldstatus $50,500
-
1994-10-31soldstatus $47,000
ⓘ Source: listings_history table (triggers on properties + properties_extension) + one-shot
backfill from property_details.listing_events for pre-trigger history.
Tax reassessment forecast IL · Partial reset (capped growth)
- Current annual tax
- $2,002 · $167/mo
- Projected year-2 tax
- $2,488 · $207/mo
- Expected delta
- +$486/yr (+$41/mo · 24.3%)
ⓘ Screening estimate from a state-policy table — verify with the county assessor before closing.
Climate risk First Street
- Flood 1/10 Low FEMA zone X (unshaded) · 0% chance over 30 yrs
- Wildfire 1/10 Low
- Heat 3/10 Moderate 7 d/yr ≥102°F today · 15 d/yr by 30 yrs out
- Wind 2/10 Low
- Air quality 4/10 Moderate 4 unhealthy d/yr today · 5 by 30 yrs out
Nearby sold comps map
Loading sold comps map…
Walkable amenities ~0.75 mi
Loading nearby amenities…
Taxation est. · year 1
- Rental income
- $21,396
- − Mortgage interest
- −$7,338
- − Property taxes
- −$2,002
- − Insurance
- −$655
- − Repairs & maintenance
- −$1,712
- − Management
- −$1,712
- − HOA
- −$3,696
- − Depreciation
- −$3,811
- Taxable income
- $472
- Est. tax owed @ 24.0%
- −$113
- After-tax cash flow
- $2,194/yr
For passive investors: Depreciation is non-cash, so a rental often shows a tax loss while cash-flowing — sheltering income. Rental losses are passive: they offset passive income freely, and up to $25,000/yr can offset ordinary (W-2) income if you actively participate and your MAGI is under $100k (phasing out to $0 by $150k); unused losses carry forward. On sale, claimed depreciation is recaptured at up to 25%, and gains may owe capital-gains tax (a 1031 exchange can defer both). Figures are a year-1 estimate at your 24.0% rate — not tax advice; consult a CPA.
Schools (NCES district)
- District
- Bremen Chsd 228
- NCES district ID
- 1707050
- Math proficiency
- 15% ▼ -4.00%
- Reading proficiency
- 17% ▼ -5.00%
- Median HH income
- $57,625
- Composite
- 15.32/100
- National rank
- #9327
- State rank
- #468 of 620 in IL
Livability — Crestwood
- Score
- 82/100
- State rank
- #75
- US rank
- #1220
Category grades
Schools grade is shown separately in the Schools card above.
Census & demographics
- Census place
- Crestwood, IL
- City population
- 10,631
- Population (ZIP)
- 10,631
Population outlook (Cook County) Hauer SSP2
- Today (2025)
- 5,347,519 people
- By 2030
- 5,357,703 · +0.2%
- By 2040
- 5,324,924 · -0.4%
- By 2050
- 5,230,762 · -2.2%
- By 2075
- 4,785,735 · -10.5%
- By 2100
- 4,188,836 · -21.7%
Race, ethnicity, and origin ACS 2023
- Neighborhood character
- Predominantly White (69%)
- Race & ethnicity
- White 69% Hispanic / Latino 15% Black 12% Two or more races 7% Asian 2%
- Hispanic origin (detail)
- Mexican 13% Puerto Rican 1%
- Common ancestry
- Romanian 13% Iranian 1% Armenian 1%
- Foreign-born
- 12% · Canada
- Languages at home
- 82% English-only · Spanish 11% Arabic 2% Russian/Polish/Slavic 2%
Political lean MEDSL · Cook
- 2024 margin
- Solid D (+42.0) · D 70.4% · R 28.4% · Other 1.2%
- 2008→2024 swing
- -11.4pp toward R · 2008: 53.4pp · 2024: 42.0pp
- All cycles
- 2024: D+42.0 2020: D+50.3 2016: D+53.0 2012: D+49.4 2008: D+53.4
Not yet ingested
- Civics
- —
Market trends
- HPI YoY
- ▼ -205.44%
- Current HPI
- 105.796
- Rent YoY
- —
- Metro
- —
- State GDP YoY
- ▲ 1.59%
- F500 in state
- 60
Industry mix (Fortune 500 HQ in IL)
| Industry | F500 HQs | Revenue |
|---|---|---|
| Insurance | 4 | $201B |
|
||
| Consumer Goods | 4 | $87B |
|
||
| Industrial Machinery | 3 | $64B |
|
||
| Healthcare | 2 | $55B |
|
||
| Retail / Pharmacy | 1 | $148B |
|
||
| Agriculture / Food | 1 | $86B |
|
||
Price history
+178.7% since first listed9 events — show timeline
- 2026-05-15 Pending — MRED as Distributed by MLS Grid
- 2026-05-06 Price Changed $131,000 MRED as Distributed by MLS Grid
- 2026-03-17 Listed $132,500 MRED as Distributed by MLS Grid
- 2017-02-22 Sold (Public Records) $39,500 Public Records
- 2017-02-10 Sold (MLS) $39,000 MRED as Distributed by MLS Grid
- 2017-01-26 Pending — MRED as Distributed by MLS Grid
- 2017-01-25 Listed $39,000 MRED as Distributed by MLS Grid
- 1994-12-15 Sold (Public Records) $50,500 Public Records
- 1994-10-31 Sold (Public Records) $47,000 Public Records
Property tax history
+1.5%/yrLatest (2023): $2,002 · +19.5% YoY. Source: county tax records.
Cash-flow waterfall
monthlySold comps — $/sqft
last 12 mo · ≤1 miLoading sold comps…