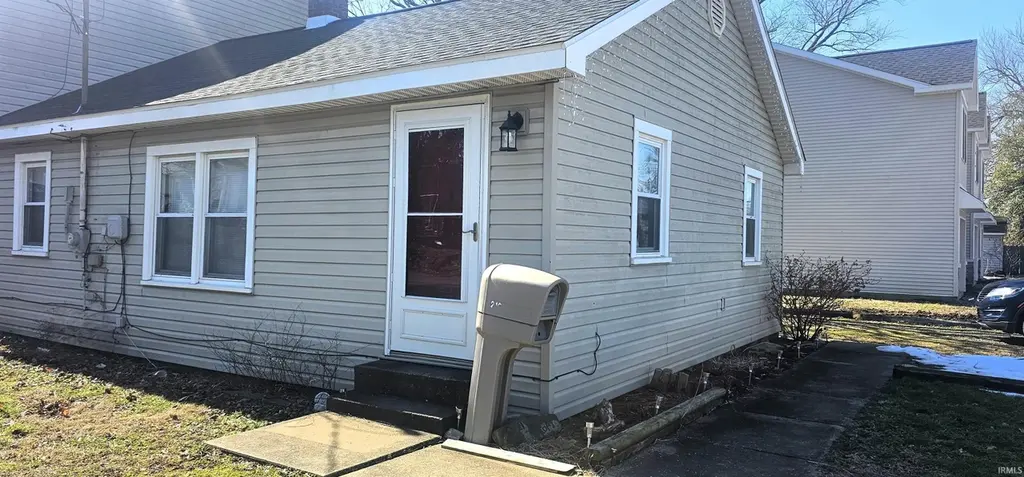
219 E Taylor St · Boonville, IN
Flood risk 7/10 · Major
- FEMA flood zone
- X (unshaded)
- Chance of flooding over 30 yrs
- 0.99%
- Est. flood insurance / yr
- $507 – $1,088
Fire risk 1/10 · Minimal
- Est. fire insurance / yr
- $717 – $1,331
Heat risk 5/10 · Moderate
- Hot days now (above 106°F)
- 7 days/yr
- Hot days in 30 yrs
- 19 days/yr
Wind risk 2/10 · Minimal
- Chance of severe wind over 30 yrs
- 3.0%
Air-quality risk 3/10 · Minor
- Unhealthy air days now
- 2 days/yr
- Unhealthy air days in 30 yrs
- 3 days/yr
Risk factors via First Street. Map © Google.
Why this score? — see what drove the D+ grade
The composite is a weighted blend of 9 inputs, each scored 0–100. Each bar is that input's sub-score; the figure is the points it added to the 100-point composite (weight × sub-score).
- Cash flow +14.7/30.0
- ARV discount +12.9/15.0
- Schools +4.9/10.0
- DSCR +4.5/10.0
- Livability +3.3/5.0
- 1% rule +3.1/10.0
- Rent growth +2.5/5.0
- Condition / age +2.5/5.0
- Appreciation +0.0/10.0
$135,000
🖨 Deal sheet (PDF) 📄 Offer letter ✓ Due diligence
Listing remarks MLS
Discover the charm of this delightful 3-bedroom, 1-bath home on a spacious corner lot. With a large backyard perfect for outdoor activities and gatherings, this property offers endless possibilities for your personal touch. Enjoy peace of mind with a new roof, fresh flooring, and modern appliances, all updated within the last year. This home is ready for you to move in and make it your own!
Key facts
- Fresh flooring
- Large backyard
- Modern appliances
Tags
Neighborhood map
What this means for you Summary
Snapshot
- This is a 2-bed/1.0-bath single-family listed at $135k.
Deal economics
- At list price, monthly cash flow is $-33 ($-391/yr) — negative.
- To cash-flow at today's rent, offer at most $129k (4.3% below list).
- To meet the 1% rule (rent ≥ 1% of price), the offer needs to be $110k (18.5% below list).
- Recommended offer: $110k (18.5% below list) — sets the bar for 1% rule.
- Cap rate 6.6% vs local median 3.5% in Boonville — top-decile yield for the area; either an underpriced asset or a hidden risk that comps aren't pricing in. Stress-test before assuming the spread holds.
Location & tenants
- Location reads 66/100 on livability (#278 in IN) — a middle-class / working-renter tenant base. Strengths: cost of living A+, housing A+; Watch: crime D+, amenities F, commute F.
- Warrick County School Corporation (suburban): math 54% / reading 59% proficiency, ranked #24 of 301 in IN (top 8%) — acceptable for families but not a draw, mixed tenant base, ~2y average lease.
- Market conditions: 160 active listings in the ZIP; 1 comparable units currently listed for rent nearby; 249 units permitted in Warrick County in 2024 (0 in 5+ unit buildings).
Forward outlook
- Local home prices are declining (-3.0%/yr); year-one equity from $933 of loan paydown is wiped out by about $4k of value loss. Plan a longer hold.
- Warrick County population projected at +9% by 2050 — modest demand growth; plan on rents tracking national, not racing it.
Negotiation context
- It's been on market 140 days — a 12% lower offer ($119k) is reasonable based on typical stale-listing flexibility.
Risks & watch-outs
- Watch-outs: flood insurance adds $66/mo; built in 1946 — expect roof / HVAC / electrical / plumbing capex.
- Climate carrying-cost: major flood risk; extreme-heat days projected 7→19/yr by 2055 (HVAC capex compounding) — expect insurance premiums to compound above CPI over the hold.
Questions for the listing agent
- What do current leases actually rent for vs. the listed asking? Can we see a recent rent roll and the last 12 months of T-12 income?
- It's been on market 140 days. Have you received any prior offers? Is the seller open to a 19% concession, seller financing, or rate buy-down credit?
- Built in 1946 — when were the roof, HVAC, electrical panel, plumbing, and water heater last replaced?
- What's the actual annual flood-insurance premium (NFIP or private), and is the property in a SFHA with mandatory coverage?
- Why hasn't it sold? Are there any deal-killer items the seller is aware of (foundation, flood, title, zoning, code violations)?
- Is there a deadline driving the sale (1031 exchange, divorce, estate, relocation)? That informs how much negotiation room exists.
- Crime grade is D in this area — have there been break-ins, vandalism, or insurance claims at this property in the last 3 years? What carrier currently insures it and at what premium?
- The area grade is low — what's the realistic commute time and amenity access for the typical tenant pool here? Any planned neighborhood developments (good or bad) we should know about?
- What's the average days-on-market for RENTAL listings here right now (not sales)? A rising rental-DOM trend means longer vacancies and softer asking-rent achievability than the comps imply.
- What's the recent tenant-quality profile in this submarket — average credit score on applications, eviction rate, late-payment / NSF rate, and stable-employment percentage? A property-management company in the area should have these aggregated.
- How much new for-sale + rental construction is in the pipeline within 1–3 miles? Heavy new supply typically softens prices + rents 12–24 months out; constrained supply supports both.
Investment metrics
- 1% rule
- 0.81% ✗
- Cap rate
- 6.59%
- Cash-on-cash
- 1.08%
- DSCR
- 1.05
- GRM
- 10.2
CMA / ARV
- ARV (median comp)
- $153,322
- List price
- $135,000
- Delta
- -11.95%
- Verdict
- UNDERPRICED
- Comps
- 20 within 1.0 mi
Show comp detail 12 sales within ~0.75 mi
| Address | Dist | Beds/Ba | Sqft | Sold | Price | $/sf | Match |
|---|---|---|---|---|---|---|---|
| 611 Liberty St | 0.25mi | 3/1.0 (+1) | 1,205 (-2%) | 6mo | $160,600 | $133 | 75 |
| 613 N First St | 0.59mi | 2/2.0 | 1,228 (-0%) | 1mo | $175,000 | $143 | 67 |
| 417 N 7th St | 0.16mi | 2/1.0 | 1,061 (-14%) | 3mo | $147,000 | $139 | 67 |
| 215 E Chestnut St | 0.35mi | 3/1.0 (+1) | 1,107 (-10%) | 4mo | $165,000 | $149 | 59 |
| 321 E Poplar St | 0.31mi | 3/2.0 (+1) | 1,367 (+11%) | 2mo | $207,000 | $151 | 57 |
| 419 S Third St | 0.61mi | 2/1.0 | 1,128 (-8%) | 3mo | $120,000 | $106 | 55 |
| 317 E Locust St | 0.35mi | 3/2.0 (+1) | 1,405 (+14%) | 2mo | $113,800 | $81 | 50 |
| 715 N 2nd St | 0.55mi | 2/1.0 | 1,092 (-11%) | 7mo | $127,500 | $117 | 49 |
| 621 N Third St | 0.46mi | 2/2.0 | 1,080 (-12%) | 6mo | $192,500 | $178 | 48 |
| 710 S 5th St | 0.66mi | 3/1.5 (+1) | 1,080 (-12%) | 3mo | $159,000 | $147 | 39 |
| 1206 N Third St | 0.69mi | 3/2.0 (+1) | 1,370 (+11%) | 7mo | $210,000 | $153 | 35 |
| 420 E Moore St | 0.71mi | 3/2.0 (+1) | 1,416 (+15%) | 8mo | $199,600 | $141 | 27 |
Match score weights: distance 35% · size 25% · config 20% · recency 20%. Top-matched comps best support the ARV.
Projected returns pro-forma
-3.0% appreciation · 3.0% rent growth · sell at horizon
- IRR
- -18.0%
- Equity multiple
- 0.37×
- Total profit
- $-23,953
- Equity at exit
- $20,129
- IRR
- -10.2%
- Equity multiple
- 0.38×
- Total profit
- $-23,539
- Equity at exit
- $11,672
Cash invested: $37,800 (down + closing). Projections, not guarantees.
Landlord ↔ Tenant lean methodology
- Overall (STATE)
- 90 Strongly Landlord-Friendly
- State Indiana
- 90 Strongly Landlord-Friendly · R+11
- County
- — inherits STATE
- City
- — inherits STATE
ZIP-level market 47601
- Active inventory
- 160
- Price-to-rent
- 10.2×
Monthly cashflow live
- Estimated rent
- $1,100 medium interval (Pro) →
- Mortgage (P&I)
- −$708
- Tax from tax record
- −$71 /mo · $851/yr
- Insurance
- −$56
- Flood insurance flood zone
- −$66 /mo · $798/yr
- HOA
- −$0
- Vacancy / Maint / Mgmt
- −$231
- Net cashflow
- $-33
Break-even live
Sensitivity live
| Price | -10% $44 | -5% $6 | +0% $-33 | +5% $-71 | +10% $-109 |
|---|---|---|---|---|---|
| Rent | -10% $-119 | -5% $-76 | +0% $-33 | +5% $11 | +10% $54 |
| Rate | -1.0pp $35 | -0.5pp $2 | base $-33 | +0.5pp $-68 | +1.0pp $-103 |
UW: 25.0% down · 7.5% · 30yr · 1.5% tax · 5.0% vac · 8.0% maint · 8.0% mgmt
Financing live
Cash to close
- Down payment
- $33,750
- Closing costs
- $4,050
- Reserves months
- —
- Total cash needed
- —
Loan-product check · same deal, 3 products live
Conventional
25% down · 7.5% · 30yr
- Down + closing
- —
- Monthly P&I
- —
- Monthly cashflow
- —
- DSCR
- —
- Eligible?
- —
Personal DTI + credit; lowest rate.
DSCR
20% down · 8.5% · 30yr
- Down + closing
- —
- Monthly P&I
- —
- Monthly cashflow
- —
- DSCR
- —
- Eligible?
- —
No personal income docs; deal must DSCR.
Hard money
10% down · 12.0% · 12mo
- Down + closing
- —
- Monthly P&I
- —
- Monthly cashflow
- —
- DSCR
- —
- Eligible?
- —
Short-term bridge; refi at stabilization.
Rent comps 1 comps
| Address | Beds | Baths | Sqft | Rent | $/sqft | DOM | Units | Dist |
|---|---|---|---|---|---|---|---|---|
| 1112 Perkins Dr Unit A Boonville, IN | 2.0 | 1.0 | 815 | $1,100 | $1.35 | 23d | 1 | 0.97mi |
Listing history 6 events
-
2026-05-06status Pending 393-char remark
Show marketing remark (393 chars)
Discover the charm of this delightful 3-bedroom, 1-bath home on a spacious corner lot. With a large backyard perfect for outdoor activities and gatherings, this property offers endless possibilities for your personal touch. Enjoy peace of mind with a new roof, fresh flooring, and modern appliances, all updated within the last year. This home is ready for you to move in and make it your own!
-
2026-04-29price $135,000 393-char remark
Show marketing remark (393 chars)
Discover the charm of this delightful 3-bedroom, 1-bath home on a spacious corner lot. With a large backyard perfect for outdoor activities and gatherings, this property offers endless possibilities for your personal touch. Enjoy peace of mind with a new roof, fresh flooring, and modern appliances, all updated within the last year. This home is ready for you to move in and make it your own!
-
2026-03-30price $137,000 393-char remark
Show marketing remark (393 chars)
Discover the charm of this delightful 3-bedroom, 1-bath home on a spacious corner lot. With a large backyard perfect for outdoor activities and gatherings, this property offers endless possibilities for your personal touch. Enjoy peace of mind with a new roof, fresh flooring, and modern appliances, all updated within the last year. This home is ready for you to move in and make it your own!
-
2026-02-28price $139,000 393-char remark
Show marketing remark (393 chars)
Discover the charm of this delightful 3-bedroom, 1-bath home on a spacious corner lot. With a large backyard perfect for outdoor activities and gatherings, this property offers endless possibilities for your personal touch. Enjoy peace of mind with a new roof, fresh flooring, and modern appliances, all updated within the last year. This home is ready for you to move in and make it your own!
-
2026-02-12price $142,000 393-char remark
Show marketing remark (393 chars)
Discover the charm of this delightful 3-bedroom, 1-bath home on a spacious corner lot. With a large backyard perfect for outdoor activities and gatherings, this property offers endless possibilities for your personal touch. Enjoy peace of mind with a new roof, fresh flooring, and modern appliances, all updated within the last year. This home is ready for you to move in and make it your own!
-
2025-12-16$145,000 Active 393-char remark
Show marketing remark (393 chars)
Discover the charm of this delightful 3-bedroom, 1-bath home on a spacious corner lot. With a large backyard perfect for outdoor activities and gatherings, this property offers endless possibilities for your personal touch. Enjoy peace of mind with a new roof, fresh flooring, and modern appliances, all updated within the last year. This home is ready for you to move in and make it your own!
ⓘ Source: listings_history table (triggers on properties + properties_extension) + one-shot
backfill from property_details.listing_events for pre-trigger history.
Tax reassessment forecast IN · Partial reset (capped growth)
- Current annual tax
- $851 · $71/mo
- Projected year-2 tax
- $999 · $83/mo
- Expected delta
- +$148/yr (+$12/mo · 17.4%)
ⓘ Screening estimate from a state-policy table — verify with the county assessor before closing.
Climate risk First Street
- Flood 7/10 Severe FEMA zone X (unshaded) · 99% chance over 30 yrs
- Wildfire 1/10 Low
- Heat 5/10 Major 7 d/yr ≥106°F today · 19 d/yr by 30 yrs out
- Wind 2/10 Low 3% chance of damaging wind over 30 yrs
- Air quality 3/10 Moderate 2 unhealthy d/yr today · 3 by 30 yrs out
Nearby sold comps map
Loading sold comps map…
Walkable amenities ~0.75 mi
Loading nearby amenities…
Taxation est. · year 1
- Rental income
- $13,200
- − Mortgage interest
- −$7,562
- − Property taxes
- −$851
- − Insurance
- −$1,472
- − Repairs & maintenance
- −$1,056
- − Management
- −$1,056
- − Depreciation
- −$3,927
- Taxable loss
- −$2,725
- Est. tax savings @ 24.0%
- +$654
- After-tax cash flow
- $263/yr
For passive investors: Depreciation is non-cash, so a rental often shows a tax loss while cash-flowing — sheltering income. Rental losses are passive: they offset passive income freely, and up to $25,000/yr can offset ordinary (W-2) income if you actively participate and your MAGI is under $100k (phasing out to $0 by $150k); unused losses carry forward. On sale, claimed depreciation is recaptured at up to 25%, and gains may owe capital-gains tax (a 1031 exchange can defer both). Figures are a year-1 estimate at your 24.0% rate — not tax advice; consult a CPA.
Schools (NCES district)
- District
- Warrick County School Corporation
- NCES district ID
- 1812390
- Math proficiency
- 54% ▼ -8.00%
- Reading proficiency
- 59% ▼ -6.00%
- Median HH income
- $62,801
- Composite
- 49.38/100
- National rank
- #2014
- State rank
- #24 of 301 in IN
Livability — Boonville
- Score
- 66/100
- State rank
- #278
- US rank
- #11520
Category grades
Schools grade is shown separately in the Schools card above.
Census & demographics
- Census place
- Boonville, IN
- Population (ZIP)
- 13,119
Population outlook (Warrick County) Hauer SSP2
- Today (2025)
- 66,569 people
- By 2030
- 68,404 · +2.8%
- By 2040
- 71,131 · +6.9%
- By 2050
- 72,743 · +9.3%
- By 2075
- 76,088 · +14.3%
- By 2100
- 72,261 · +8.6%
Race, ethnicity, and origin ACS 2023
- Neighborhood character
- Predominantly White (95%)
- Race & ethnicity
- White 95% Two or more races 3% Hispanic / Latino 2%
- Common ancestry
- Slovak 2% Italian 1% Lithuanian 1%
- Foreign-born
- 0% · Canada
- Languages at home
- 99% English-only · Spanish 1%
Political lean MEDSL · Warrick
- 2024 margin
- Solid R (+30.2) · D 34.1% · R 64.3% · Other 1.5%
- 2008→2024 swing
- -17.4pp toward R · 2008: -12.8pp · 2024: -30.2pp
- All cycles
- 2024: R+30.2 2020: R+27.8 2016: R+33.9 2012: R+26.6 2008: R+12.8
Not yet ingested
- Civics
- —
Market trends
- HPI YoY
- ▼ -119.46%
- Current HPI
- 207.7817
- Rent YoY
- —
- Metro
- —
- State GDP YoY
- ▲ 2.90%
- F500 in state
- 18
Industry mix (Fortune 500 HQ in IN)
| Industry | F500 HQs | Revenue |
|---|---|---|
| Industrial Machinery | 2 | $37B |
|
||
| Healthcare | 1 | $177B |
|
||
| Pharmaceuticals | 1 | $45B |
|
||
| Metals / Steel | 1 | $18B |
|
||
| Agriculture | 1 | $17B |
|
||
| Packaging | 1 | $12B |
|
||
Price history
-6.9% since first listed6 events — show timeline
- 2026-05-06 Pending — IRMLS
- 2026-04-29 Price Changed $135,000 IRMLS
- 2026-03-30 Price Changed $137,000 IRMLS
- 2026-02-28 Price Changed $139,000 IRMLS
- 2026-02-12 Price Changed $142,000 IRMLS
- 2025-12-16 Listed $145,000 IRMLS
Property tax history
+8.3%/yrLatest (2024): $851 · +9.2% YoY. Source: county tax records.
Cash-flow waterfall
monthlySold comps — $/sqft
last 12 mo · ≤1 miLoading sold comps…