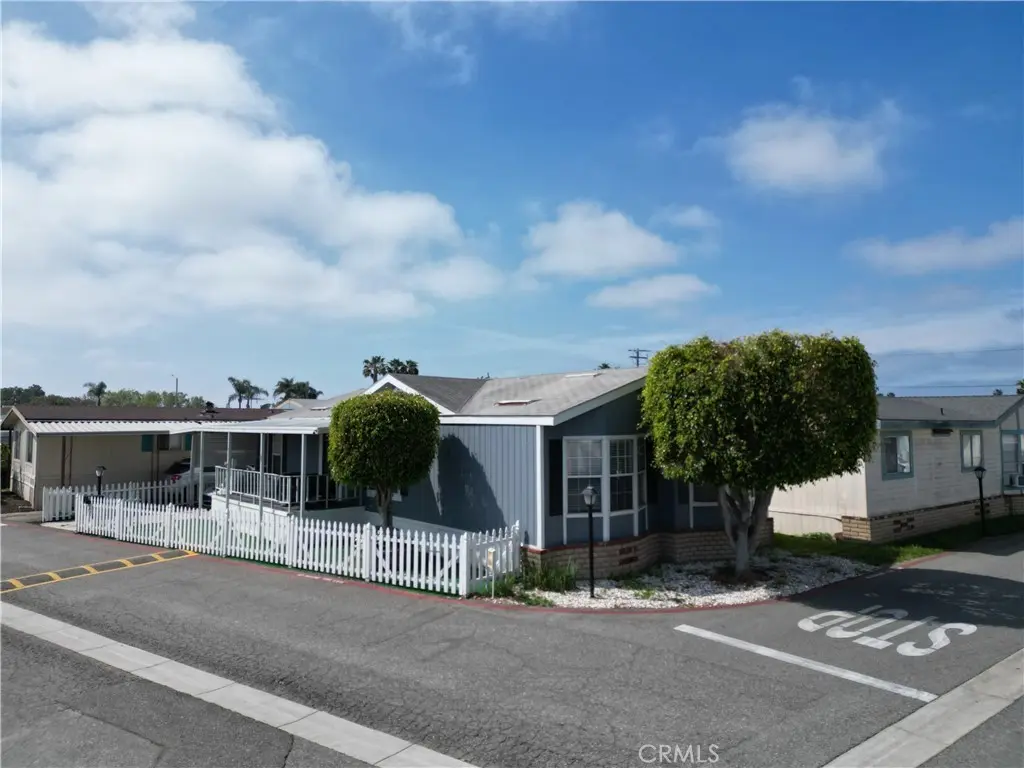
6301 Warner Ave #88 · Huntington Beach, CA
Flood risk 6/10 · Moderate
- FEMA flood zone
- X
- Chance of flooding over 30 yrs
- 0.9%
- Est. flood insurance / yr
- $507 – $1,088
Fire risk 1/10 · Minimal
- Est. fire insurance / yr
- $659 – $1,223
Heat risk 5/10 · Moderate
- Hot days now (above 85°F)
- 7 days/yr
- Hot days in 30 yrs
- 22 days/yr
Wind risk 1/10 · Minimal
- Chance of severe wind over 30 yrs
- —
Air-quality risk 4/10 · Minor
- Unhealthy air days now
- 5 days/yr
- Unhealthy air days in 30 yrs
- 7 days/yr
Risk factors via First Street. Map © Google.
Why this score? — see what drove the B grade
The composite is a weighted blend of 9 inputs, each scored 0–100. Each bar is that input's sub-score; the figure is the points it added to the 100-point composite (weight × sub-score).
- Cash flow +30.0/30.0
- 1% rule +10.0/10.0
- DSCR +10.0/10.0
- ARV discount +7.9/15.0
- Schools +5.5/10.0
- Livability +3.4/5.0
- Rent growth +2.8/5.0
- Condition / age +2.5/5.0
- Appreciation +0.0/10.0
$219,000
🖨 Deal sheet 📄 Offer letter ✓ Due diligence
Listing remarks MLS
Charming manufactured home located in the heart of Huntington Beach. A short distance to the beach, to the freeway and the golf course too. The front yard is decorated with flowers and surrouded by a white picket fence. The skylights and the vaulted ceiling makes this house nice and bright. The park has a car wash enclosure, 2 pools and spa and a club house that is available to the residents. Stop renting and buy me now.
Key facts
- 2 spas
- 2 pools
- Renovated clubhouses
Tags
Property features AI
Finance
- Other: Double body type (multi-unit classification); Directions: Enter the community and go straight, home will be on left hand side.
- HOA & community: Monthly land lease (park) of $1,999; Community features include a dog park and street lighting; Park name: Sea Aira; Manager approval required for residency; Pets allowed with breed restrictions
Exterior
- Parking: Attached carport with 2 parking spaces
- Utilities: Public sewer; District/public water
- Home design: Mobile/manufactured double-wide; Single story; Mobile home remains on site
- Construction: Built by builder (year built source: Builder); Mobile dimensions approximately 24 ft by 48 ft
- Exterior features: Association-maintained in-ground pool; Corner lot; Close to clubhouse; One storage shed
Interior
- Kitchen: Garbage disposal; Refrigerator; Gas range; Dishwasher; Gas water heater
- Bedrooms: Entry level bedroom(s)
- Bathrooms: 2 full bathrooms
- Heating & cooling: Central furnace heating
- Interior features: One-level entry; One story; Skylights; Association-maintained, in-ground heated spa
- Laundry & utility: Laundry inside in an individual room
Neighborhood map
What this means for you Summary
Snapshot
- This is a 3-bed/2.0-bath manufactured listed at $219k.
Deal economics
- At list price, monthly cash flow is $1k ($15k/yr) — positive.
- The deal already cash-flows at list — no discount required.
- Meets the 1% rule at list price ($4k rent vs $219k).
- Recommended offer: $206k (6.0% below list) — sets the bar for market timing.
- Cap rate 13.3% vs local median 1.6% in Huntington Beach — top-decile yield for the area; either an underpriced asset or a hidden risk that comps aren't pricing in. Stress-test before assuming the spread holds.
Location & tenants
- Location reads 67/100 on livability (#306 in CA) — a middle-class / working-renter tenant base. Strengths: employment A+, commute A-, schools B+; Watch: amenities C-, cost of living F, health & safety F.
- Ocean View (suburban): math 57% / reading 63% proficiency, ranked #207 of 1,400 in CA (top 15%) — acceptable for families but not a draw, mixed tenant base, ~2y average lease.
- Market conditions: Rents rising (+1.2%/yr); 75 active listings in the ZIP; 40 comparable units currently listed for rent nearby; rentals leasing fast (median 1d on market — plan ~1-2 weeks tenant-placement turnaround); solid renter incomes; 6,974 units permitted in Orange County in 2024 (3,839 in 5+ unit buildings).
- This rent runs 40% of the median local income ($105k/yr) — at the standard rent-burdened threshold; future hikes will face affordability resistance.
Forward outlook
- Local home prices are declining (-3.0%/yr); year-one equity from $2k of loan paydown is wiped out by about $7k of value loss. Plan a longer hold.
- Orange County population projected at +14% by 2050 — modest demand growth; plan on rents tracking national, not racing it.
- At projected returns (-3.0% appreciation + 1.2% rent growth), your $61k cash investment doubles in ~6 years — after that, you're playing with house money.
Negotiation context
- It's been on market 83 days — a 6% lower offer ($206k) is reasonable based on typical stale-listing flexibility.
- 3 sale attempts since 26y ago with the ask held roughly flat each time — persistent listings suggest the price (not the market) is what's stuck; bring a comps-based counter.
- Current owner paid $100k; list at $219k implies a 119% gain — meaningful room to come down on a strong offer.
Risks & watch-outs
- Climate carrying-cost: major flood risk; extreme-heat days projected 7→22/yr by 2055 (HVAC capex compounding) — expect insurance premiums to compound above CPI over the hold.
Questions for the listing agent
- It's been on market 83 days. Have you received any prior offers? Is the seller open to a 6% concession, seller financing, or rate buy-down credit?
- Why hasn't it sold? Are there any deal-killer items the seller is aware of (foundation, flood, title, zoning, code violations)?
- Is there a deadline driving the sale (1031 exchange, divorce, estate, relocation)? That informs how much negotiation room exists.
- Schools are B-rated — typically a magnet for longer-tenancy family renters. What's the average tenant stay here, and is there a school-zone premium baked into asking?
- What's the average days-on-market for RENTAL listings here right now (not sales)? A rising rental-DOM trend means longer vacancies and softer asking-rent achievability than the comps imply.
- What's the recent tenant-quality profile in this submarket — average credit score on applications, eviction rate, late-payment / NSF rate, and stable-employment percentage? A property-management company in the area should have these aggregated.
- How much new for-sale + rental construction is in the pipeline within 1–3 miles? Heavy new supply typically softens prices + rents 12–24 months out; constrained supply supports both.
Investment metrics
- 1% rule
- 1.61% ✓
- Cap rate
- 13.27%
- Cash-on-cash
- 24.93%
- DSCR
- 2.11
- GRM
- 5.2
CMA / ARV
- ARV (on-the-fly)
- $221,184
- Comps found
- 2
Show comp detail 2 sales within ~0.75 mi
| Address | Dist | Beds/Ba | Sqft | Sold | Price | $/sf | Match |
|---|---|---|---|---|---|---|---|
| 6301 Warner Ave #40 | 0.00mi | 2/2.0 (-1) | 1,200 (+4%) | 1mo | $230,000 | $192 | 88 |
| 6301 Warner Ave #5 | 0.00mi | 3/2.0 | 1,248 (+8%) | 24mo | $235,000 | $188 | 66 |
Match score weights: distance 35% · size 25% · config 20% · recency 20%. Top-matched comps best support the ARV.
Projected returns pro-forma
-3.0% appreciation · 1.2% rent growth · sell at horizon
- IRR
- 16.3%
- Equity multiple
- 1.64×
- Total profit
- $39,430
- Equity at exit
- $32,654
- IRR
- 23.6%
- Equity multiple
- 2.86×
- Total profit
- $114,190
- Equity at exit
- $18,935
Cash invested: $61,320 (down + closing). Projections, not guarantees.
Landlord ↔ Tenant lean methodology
- Overall (STATE)
- 18 Strongly Tenant-Friendly
- State California
- 18 Strongly Tenant-Friendly · D+13
- County
- — inherits STATE
- City
- — inherits STATE
ZIP-level market 92647
- Rents YoY
- 1.2%
- Active inventory
- 75
- Price-to-rent
- 5.2×
Monthly cashflow live
- Estimated rent
- $3,528 high interval (Pro) →
- Mortgage (P&I)
- −$1,148
- Tax est. 1.5%
- −$274 /mo · $3,285/yr
- Insurance
- −$91
- HOA
- −$0
- Vacancy / Maint / Mgmt
- −$741
- Net cashflow
- $1,274
Break-even live
UW: 25.0% down · 7.5% · 30yr · 1.5% tax · 5.0% vac · 8.0% maint · 8.0% mgmt
Financing live
Cash to close
- Down payment
- $54,750
- Closing costs
- $6,570
- Reserves months
- —
- Total cash needed
- —
Loan-product check · same deal, 3 products live
Conventional
25% down · 7.5% · 30yr
- Down + closing
- —
- Monthly P&I
- —
- Monthly cashflow
- —
- DSCR
- —
- Eligible?
- —
Personal DTI + credit; lowest rate.
DSCR
20% down · 8.5% · 30yr
- Down + closing
- —
- Monthly P&I
- —
- Monthly cashflow
- —
- DSCR
- —
- Eligible?
- —
No personal income docs; deal must DSCR.
Hard money
10% down · 12.0% · 12mo
- Down + closing
- —
- Monthly P&I
- —
- Monthly cashflow
- —
- DSCR
- —
- Eligible?
- —
Short-term bridge; refi at stabilization.
Rent comps 40 comps
| Address | Beds | Baths | Sqft | Rent | $/sqft | DOM | Units | Dist |
|---|---|---|---|---|---|---|---|---|
| 6401 Warner Ave Huntington Beach, CA | 2.0–3.0 | 1.0–2.5 | 1145 | $4,196 | $3.66 | 1d | 16 | 0.11mi |
| 6242 Warner Ave Huntington Beach, CA | 1.0–2.0 | 1.0–2.0 | 830 | $2,925 | $3.52 | 1d | 12 | 0.12mi |
| 17031 Pinehurst Ln Unit B Huntington Beach, CA | 2.0 | 2.0 | 800 | $3,000 | $3.75 | 1d | 1 | 0.25mi |
| 6700 Warner Ave Huntington Beach, CA | 2.0 | 1.0–2.0 | 875 | $3,260 | $3.73 | 1d | 1 | 0.37mi |
| 6762 Warner Ave Huntington Beach, CA | 2.0 | 1.5 | 920 | $2,750 | $2.99 | 1d | 6 | 0.46mi |
| 5832 Nordina Dr Huntington Beach, CA | 3.0 | 2.0 | 1171 | $4,399 | $3.76 | 1d | 1 | 0.71mi |
| 16722 Goldenwest St #1 Huntington Beach, CA | 3.0 | 2.0 | 1250 | $3,650 | $2.92 | 1d | 1 | 0.72mi |
| 5952 Par Cir Huntington Beach, CA | 3.0 | 2.0 | 1437 | $5,400 | $3.76 | 13d | 1 | 0.73mi |
| 16682 Goldenwest St Unit 2 Huntington Beach, CA | 2.0 | 2.0 | 900 | $2,800 | $3.11 | 1d | 1 | 0.73mi |
| 16652 Goldenwest St Apt 3 Huntington Beach, CA | 2.0 | 1.5 | 1200 | $2,600 | $2.17 | 1d | 1 | 0.74mi |
| 16652 Goldenwest St Huntington Beach, CA | 2.0 | 1.5 | 1200 | $2,600 | $2.17 | 10d | 1 | 0.74mi |
| 5641 Tilburg Dr Huntington Beach, CA | 3.0 | 2.0 | 1188 | $4,495 | $3.78 | 1d | 1 | 0.76mi |
| 16612 Bartlett Ln Unit 4 Huntington Beach, CA | 2.0 | 1.0 | 1000 | $2,600 | $2.60 | 19d | 1 | 0.81mi |
| 7082 Heil Ave #1 Huntington Beach, CA | 3.0 | 2.0 | 1438 | $3,500 | $2.43 | 1d | 1 | 0.86mi |
| 16862 Coach Ln Huntington Beach, CA | 2.0 | 1.0 | 1000 | $3,500 | $3.50 | 1d | 1 | 0.86mi |
| 16531 Kellog Cir Unit 1 Huntington Beach, CA | 3.0 | 2.0 | 1422 | $3,650 | $2.57 | 1d | 1 | 0.87mi |
| 6100 Edinger Ave Unit 509 Huntington Beach, CA | 2.0 | 2.0 | 950 | $3,500 | $3.68 | 3d | 1 | 0.90mi |
| 6200 Edinger Ave Huntington Beach, CA | 1.0–3.0 | 1.0–2.0 | 851 | $3,462 | $4.07 | 1d | 4 | 0.91mi |
| 6100 Edinger Ave Apt 602 Huntington Beach, CA | 2.0 | 2.0 | 950 | $2,800 | $2.95 | 1d | 1 | 0.92mi |
| 7261 La Mancha Cir Unit C Huntington Beach, CA | 2.0 | 2.0 | 921 | $2,500 | $2.71 | 22d | 1 | 0.96mi |
| 7302 Elk Cir Huntington Beach, CA | 2.0 | 1.0 | 850 | $2,650 | $3.12 | 11d | 1 | 0.97mi |
| 7302 Elk Cir Apt 4 Huntington Beach, CA | 2.0 | 1.0 | 850 | $2,650 | $3.12 | 1d | 1 | 0.97mi |
| 16781 Bardon Ln Unit A Huntington Beach, CA | 3.0 | 2.0 | 1300 | $3,195 | $2.46 | 7d | 1 | 1.00mi |
| 5681 Mangrum Dr Huntington Beach, CA | 3.0 | 2.0 | 1132 | $4,995 | $4.41 | 1d | 1 | 1.09mi |
| 6002 Welde Cir Huntington Beach, CA | 3.0 | 2.0 | 1284 | $3,650 | $2.84 | 10d | 1 | 1.16mi |
| 7581 Warner Ave Unit B Huntington Beach, CA | 3.0 | 2.0 | 1305 | $3,400 | $2.61 | 1d | 1 | 1.26mi |
| 7290 Edinger Ave Huntington Beach, CA | 1.0–2.0 | 1.0–2.0 | 941 | $3,824 | $4.06 | 1d | 19 | 1.30mi |
| 6042 Stone Cir Huntington Beach, CA | 4.0 | 2.0 | 1434 | $4,995 | $3.48 | 1d | 1 | 1.35mi |
| 17092 Emerald Ln Unit 4 Huntington Beach, CA | 3.0 | 2.0 | 1200 | $3,595 | $3.00 | 24d | 1 | 1.37mi |
| 17092 Emerald Ln Unit 4 Huntington Beach, CA | 3.0 | 2.0 | 1200 | $3,595 | $3.00 | 1d | 1 | 1.37mi |
| 17092 Emerald Ln Huntington Beach, CA | 3.0 | 2.0 | 1200 | $3,595 | $3.00 | 10d | 1 | 1.37mi |
| 17102 Emerald Ln Unit D Huntington Beach, CA | 3.0 | 2.0 | 1200 | $3,495 | $2.91 | 24d | 1 | 1.37mi |
| 17102 Emerald Ln Huntington Beach, CA | 3.0 | 2.0 | 1200 | $3,495 | $2.91 | 10d | 1 | 1.37mi |
| 17102 Emerald Ln Unit 4 Huntington Beach, CA | 3.0 | 2.0 | 1200 | $3,495 | $2.91 | 1d | 1 | 1.37mi |
| 16082 Schryer Ln Huntington Beach, CA | 3.0 | 2.0 | 1214 | $8,000 | $6.59 | 2d | 1 | 1.38mi |
| 7267 Aura Cir Huntington Beach, CA | 3.0 | 2.5 | 1389 | $4,500 | $3.24 | 1d | 1 | 1.39mi |
| 16592 Jib Cir Unit B Huntington Beach, CA | 3.0 | 2.5 | 1500 | $4,300 | $2.87 | 1d | 1 | 1.41mi |
| 5141 Cheryl Dr Huntington Beach, CA | 3.0 | 1.5 | 1120 | $4,200 | $3.75 | 16d | 1 | 1.45mi |
| 7771 Sycamore Dr Unit SYCAMORE7771-C Huntington Beach, CA | 2.0 | 1.5 | 800 | $2,550 | $3.19 | 14d | 1 | 1.45mi |
| 15596 Dawson Ln Huntington Beach, CA | 3.0 | 2.0 | 1000 | $3,600 | $3.60 | 1d | 1 | 1.47mi |
Listing history 20 events
-
2026-06-18days on market $219,000 Active 83 DOM
-
2026-06-17days on market $219,000 Active 82 DOM
-
2026-06-16days on market $219,000 Active 81 DOM
-
2026-06-15days on market $219,000 Active 80 DOM
-
2026-06-13days on market $219,000 Active 78 DOM
-
2026-06-13days on market $219,000 Active 77 DOM
-
2026-06-10days on market $219,000 Active 75 DOM
-
2026-06-09days on market $219,000 Active 74 DOM
-
2026-06-08days on market $219,000 Active 73 DOM
-
2026-06-07days on market $219,000 Active 72 DOM
-
2026-06-04days on market $219,000 Active 69 DOM
-
2026-06-03days on market $219,000 Active 68 DOM
-
2026-06-02days on market $219,000 Active 67 DOM
-
2026-06-01days on market $219,000 Active 66 DOM
-
2026-05-31days on market $219,000 Active 65 DOM
-
2026-03-27$219,000 Active
-
2007-02-15soldstatus $100,000 424-char remark
Show marketing remark (424 chars)
Charming manufactured home located in the heart of Huntington Beach. A short distance to the beach, to the freeway and the golf course too. The front yard is decorated with flowers and surrouded by a white picket fence. The skylights and the vaulted ceiling makes this house nice and bright. The park has a car wash enclosure, 2 pools and spa and a club house that is available to the residents. Stop renting and buy me now.
-
2006-11-06$110,000 424-char remark
Show marketing remark (424 chars)
Charming manufactured home located in the heart of Huntington Beach. A short distance to the beach, to the freeway and the golf course too. The front yard is decorated with flowers and surrouded by a white picket fence. The skylights and the vaulted ceiling makes this house nice and bright. The park has a car wash enclosure, 2 pools and spa and a club house that is available to the residents. Stop renting and buy me now.
-
2000-05-06soldstatus $75,000
-
2000-03-20$75,500
ⓘ Source: listings_history table (triggers on properties + properties_extension) + one-shot
backfill from property_details.listing_events for pre-trigger history.
Climate risk First Street
- Flood 6/10 Major FEMA zone X · 90% chance over 30 yrs
- Wildfire 1/10 Low
- Heat 5/10 Major 7 d/yr ≥85°F today · 22 d/yr by 30 yrs out
- Wind 1/10 Low
- Air quality 4/10 Moderate 5 unhealthy d/yr today · 7 by 30 yrs out
Nearby sold comps map
Loading sold comps map…
Walkable amenities ~0.75 mi
Loading nearby amenities…
Taxation est. · year 1
- Rental income
- $42,341
- − Mortgage interest
- −$12,267
- − Property taxes
- −$3,285
- − Insurance
- −$1,095
- − Repairs & maintenance
- −$3,387
- − Management
- −$3,387
- − Depreciation
- −$6,371
- Taxable income
- $12,548
- Est. tax owed @ 24.0%
- −$3,012
- After-tax cash flow
- $12,277/yr
For passive investors: Depreciation is non-cash, so a rental often shows a tax loss while cash-flowing — sheltering income. Rental losses are passive: they offset passive income freely, and up to $25,000/yr can offset ordinary (W-2) income if you actively participate and your MAGI is under $100k (phasing out to $0 by $150k); unused losses carry forward. On sale, claimed depreciation is recaptured at up to 25%, and gains may owe capital-gains tax (a 1031 exchange can defer both). Figures are a year-1 estimate at your 24.0% rate — not tax advice; consult a CPA.
Schools (NCES district)
- District
- Ocean View
- NCES district ID
- 0628140
- Math proficiency
- 57% ▬ 0.00%
- Reading proficiency
- 63% ▼ -1.00%
- Median HH income
- $77,469
- Composite
- 55.3/100
- National rank
- #2725
- State rank
- #207 of 1400 in CA
Livability — Huntington Beach
- Score
- 67/100
- State rank
- #306
- US rank
- #10298
Category grades
Schools grade is shown separately in the Schools card above.
Census & demographics
- Census place
- Huntington Beach, CA
- County
- Orange County · 3,096,323 people
- City population
- 194,835
- Metro
- Los Angeles-Long Beach-Anaheim, CA
- Population (ZIP)
- 59,047
- Household income
- $105,110
- Rent vs Own
- Severe rent burden
- 3065.0
Population outlook (Orange County) Hauer SSP2
- Today (2025)
- 3,477,456 people
- By 2030
- 3,613,117 · +3.9%
- By 2040
- 3,835,945 · +10.3%
- By 2050
- 3,968,736 · +14.1%
- By 2075
- 4,097,053 · +17.8%
- By 2100
- 3,903,633 · +12.3%
Race, ethnicity, and origin ACS 2023
- Neighborhood character
- Diverse neighborhood (Simpson 0.66)
- Race & ethnicity
- White 50% Hispanic / Latino 27% Two or more races 15% Asian 14% Black 2%
- Hispanic origin (detail)
- Mexican 22%
- Common ancestry
- Lithuanian 3% Italian 2% Romanian 2%
- Foreign-born
- 21% · Canada, Vietnam, China
- Languages at home
- 68% English-only · Spanish 15% Vietnamese 6% Other Indo-European 3%
Political lean MEDSL · Orange
- 2024 margin
- Toss-up / Even · D 49.7% · R 47.1% · Other 3.2%
- 2008→2024 swing
- +5.2pp toward D · 2008: -2.6pp · 2024: 2.6pp
- All cycles
- 2024: D+2.6 2020: D+9.0 2016: D+7.7 2012: R+8.3 2008: R+2.6
Not yet ingested
- Civics
- —
Market trends
- HPI YoY
- ▼ -1044.38%
- Current HPI
- 401.8266
- Rent YoY
- ▲ 1.20%
- Metro
- Los Angeles-Long Beach-Anaheim, CA
- State GDP YoY
- ▲ 3.21%
- F500 in state
- 116
Industry mix (Fortune 500 HQ in CA)
| Industry | F500 HQs | Revenue |
|---|---|---|
| Technology | 27 | $1,492B |
|
||
| Financial Services | 3 | $174B |
|
||
| Retail | 3 | $44B |
|
||
| Insurance | 3 | $26B |
|
||
| Media / Entertainment | 2 | $115B |
|
||
| Pharmaceuticals / Biotech | 2 | $62B |
|
||
Price history
+190.1% since first listed5 events — show timeline
- 2026-03-27 Listed $219,000 CRMLS
- 2007-02-15 Sold (MLS) $100,000 CRMLS
- 2006-11-06 Listed $110,000 CRMLS
- 2000-05-06 Sold (MLS) $75,000 CRMLS
- 2000-03-20 Listed $75,500 CRMLS
Property tax history
-5.4%/yrLatest (2025): $155 · -6.7% YoY. Source: county tax records.
Cash-flow waterfall
monthlySold comps — $/sqft
last 12 mo · ≤1 miLoading sold comps…