 Duplex
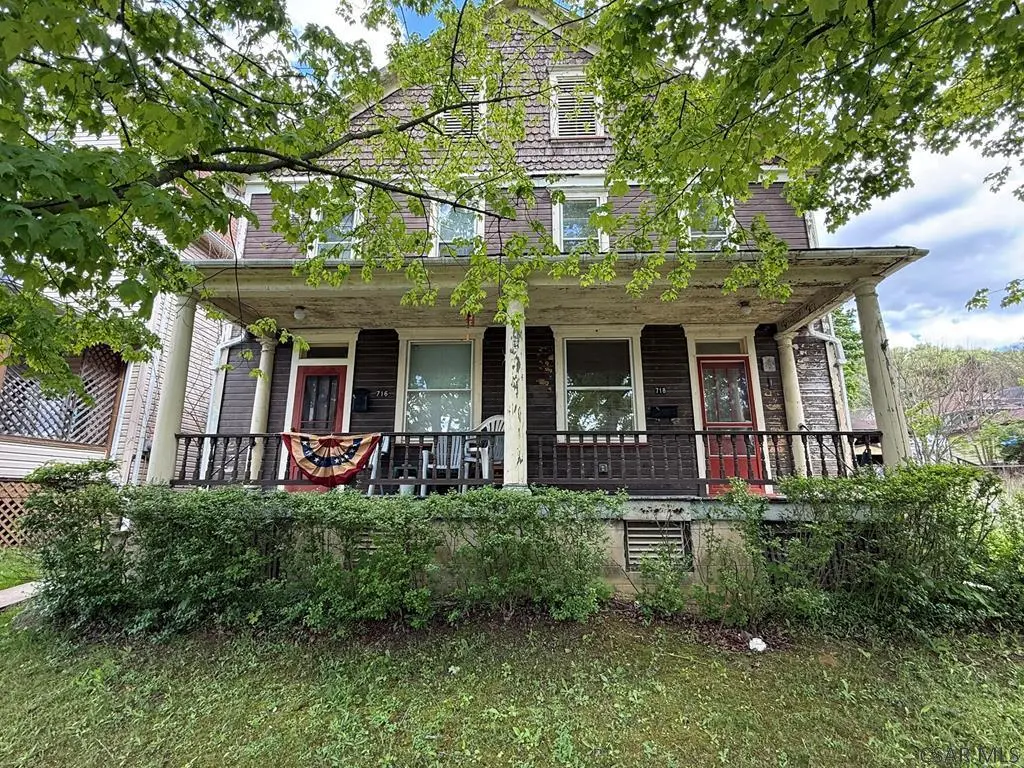
716-718 Highland Ave · Johnstown, PA
Flood risk 1/10 · Minimal
- FEMA flood zone
- X (unshaded)
- Chance of flooding over 30 yrs
- 0.0%
- Est. flood insurance / yr
- $507 – $1,088
Fire risk 1/10 · Minimal
- Est. fire insurance / yr
- $511 – $949
Heat risk 4/10 · Minor
- Hot days now (above 93°F)
- 7 days/yr
- Hot days in 30 yrs
- 19 days/yr
Wind risk 2/10 · Minimal
- Chance of severe wind over 30 yrs
- —
Air-quality risk 2/10 · Minimal
- Unhealthy air days now
- 1 days/yr
- Unhealthy air days in 30 yrs
- 2 days/yr
Risk factors via First Street. Map © Google.
Why this score? — see what drove the B grade
The composite is a weighted blend of 9 inputs, each scored 0–100. Each bar is that input's sub-score; the figure is the points it added to the 100-point composite (weight × sub-score).
- Cash flow +30.0/30.0
- ARV discount +11.4/15.0
- 1% rule +10.0/10.0
- DSCR +10.0/10.0
- Livability +3.9/5.0
- Rent growth +2.5/5.0
- Condition / age +2.5/5.0
- Schools +1.3/10.0
- Appreciation +0.0/10.0
$49,900
🖨 Deal sheet 📄 Offer letter ✓ Due diligence
Multi-family units
County records classify this as Multi-Family (2-4 Unit). Listing-text estimate: 2 units. confirmed
Listing remarks
GREAT INVESTMENT OPPORTUNITY IN THE CITY OF JOHNSTOWN'S 17TH WARD. .. this 2-unit property includes living room, dining room, kitchen, 2 bedrooms, full bath, attic, and basement for each unit. Unit 716 is tenant occupied. Tenant rent is $668/month plus electric and gas. Owner is responsible for water, sewer, and garbage. Unit 718 is currently vacant. Gas hot water heat and 100 amp electrical. Covered porches and detached garage. Property is conveniently located to transportation, shopping, hospital/medical facilities, restaurants, and recreational/entertainment venues. Expand your real estate portfolio today. Call for more details, to receive your tour packet, and to schedule your personal
Key facts
- Covered porches
- Tenant occupied
- Gas hot water heat
Tags
Property features AI
Finance
- Financial info: Actual rent listed for one unit: $668
Exterior
- Parking: On-street parking
- Utilities: Public sewer
- Home design: Multi-family residential income property; 2-story
- Construction: Frame construction
- Exterior features: Covered porch; Shingle roof
Interior
- Kitchen: Range; Oven; Refrigerator; Dishwasher not listed
- Bedrooms: Two 2-bedroom units
- Flooring: Hardwood; Wood
- Bathrooms: Each unit has 1 bathroom
- Heating & cooling: Natural gas heating; Hot water heating; Ceiling fan(s) for cooling
- Interior features: Full basement; Hardwood / wood flooring
- Laundry & utility: Washer; Dryer
Neighborhood map
What this means for you Summary
Snapshot
- This is a 2 × 2-bed/1.0-bath units multifamily listed at $50k.
Deal economics
- At list price, monthly cash flow is $974 ($12k/yr) — positive. Per door: $487/mo.
- The deal already cash-flows at list — no discount required.
- Meets the 1% rule at list price ($2k rent vs $50k).
- Cap rate 29.7% vs local median 15.0% in Johnstown — top-decile yield for the area; either an underpriced asset or a hidden risk that comps aren't pricing in. Stress-test before assuming the spread holds.
Location & tenants
- Location reads 77/100 on livability (#363 in PA, #3,168 nationally) — a middle-class / working-renter tenant base. Strengths: amenities A+, commute A+, cost of living A+; Watch: schools D+, crime F, employment F.
- Greater Johnstown SD (urban): math 9% / reading 25% proficiency, ranked #509 of 539 in PA (top 94%) — low school quality limits family demand, transient renter base, plan for 1-2y turnover; 80% free/reduced lunch — lower-income household profile, screen leases tightly.
- Market conditions: 64 active listings in the ZIP; 1 comparable units currently listed for rent nearby; lower-income renter base — watch delinquency; 64 units permitted in Cambria County in 2024 (0 in 5+ unit buildings).
- At $1,765/mo this rent would consume 48% of the median local household income ($44k/yr) (locally 266% of renters already pay >50% of income on rent) — very limited rent-growth headroom before tenants either downsize or default.
Forward outlook
- Local home prices are declining (-3.0%/yr); year-one equity from $345 of loan paydown is wiped out by about $1k of value loss. Plan a longer hold.
- Cambria County population projected at -28% by 2050 — secular population decline; favor cash flow + early exit over multi-decade hold.
- At projected returns (-3.0% appreciation + 3.0% rent growth), your $14k cash investment doubles in ~2 years — after that, you're playing with house money.
Negotiation context
- Only 6 days on market — expect competitive offers; lowballing is unlikely to land.
- Current owner paid $32k; list at $50k implies a 58% gain — meaningful room to come down on a strong offer.
Risks & watch-outs
- Watch-outs: property tax is 3.3% of price; built in 1914 — expect roof / HVAC / electrical / plumbing capex.
Questions for the listing agent
- Can we see the unit-by-unit rent roll, current vacancy, and any below-market leases? What's the average tenancy length?
- What capital expenditures (roof, boiler, parking lot, exteriors) have been made in the last 5 years, and what's planned in the next 2?
- Built in 1914 — when were the roof, HVAC, electrical panel, plumbing, and water heater last replaced?
- Property tax is high relative to price — has the assessment been appealed recently, and will the sale trigger a re-assessment?
- Is there a deadline driving the sale (1031 exchange, divorce, estate, relocation)? That informs how much negotiation room exists.
- Schools are D-rated, which usually means shorter tenancies and higher turnover. Who's the typical renter profile here, and what's been the actual vacancy rate?
- Crime grade is F in this area — have there been break-ins, vandalism, or insurance claims at this property in the last 3 years? What carrier currently insures it and at what premium?
- What's the average days-on-market for RENTAL listings here right now (not sales)? A rising rental-DOM trend means longer vacancies and softer asking-rent achievability than the comps imply.
- What's the recent tenant-quality profile in this submarket — average credit score on applications, eviction rate, late-payment / NSF rate, and stable-employment percentage? A property-management company in the area should have these aggregated.
- How much new apartment / multifamily construction is in the pipeline within 1–3 miles? Heavy new supply (>2% of stock underway) typically softens rents 12–24 months out; light construction supports rent growth.
Investment metrics
- 1% rule
- 3.54% ✓
- Cap rate
- 29.71%
- Cash-on-cash
- 83.65%
- DSCR
- 4.72
- GRM
- 2.4
CMA / ARV
- ARV (median comp)
- $54,670
- List price
- $49,900
- Delta
- -8.72%
- Verdict
- FAIR
- Comps
- 20 within 1.0 mi
Show comp detail 7 sales within ~0.75 mi
| Address | Dist | Beds/Ba | Sqft | Sold | Price | $/sf | Match |
|---|---|---|---|---|---|---|---|
| 660-662 Park Ave | 0.19mi | 4/2.0 | 2,346 (-1%) | 21mo | $76,000 | $32 | 72 |
| 660-R660 Russell Ave | 0.14mi | 5/3.0 (+1) | 2,376 (+1%) | 14mo | $65,000 | $27 | 72 |
| 620 - 622 Highland Ave | 0.14mi | 4/2.0 | 2,048 (-13%) | 8mo | $60,000 | $29 | 65 |
| 601 Linden Ave | 0.18mi | 5/2.0 (+1) | 2,060 (-13%) | 14mo | $36,500 | $18 | 54 |
| 162-164 Dupont St | 0.56mi | 4/2.0 | 2,172 (-8%) | 17mo | $42,000 | $19 | 47 |
| 321 Clay St | 0.51mi | 4/3.0 | 2,080 (-12%) | 11mo | $74,500 | $36 | 43 |
| 129-131 Plainfield Ave | 0.70mi | 4/3.0 | 2,611 (+11%) | 7mo | $67,500 | $26 | 39 |
Match score weights: distance 35% · size 25% · config 20% · recency 20%. Top-matched comps best support the ARV.
Projected returns pro-forma
-3.0% appreciation · 3.0% rent growth · sell at horizon
- IRR
- 84.0%
- Equity multiple
- 4.87×
- Total profit
- $54,016
- Equity at exit
- $7,440
- IRR
- 87.3%
- Equity multiple
- 10.10×
- Total profit
- $127,206
- Equity at exit
- $4,314
Cash invested: $13,972 (down + closing). Projections, not guarantees.
Landlord ↔ Tenant lean methodology
- Overall (STATE)
- 62 Landlord-Friendly
- State Pennsylvania
- 62 Landlord-Friendly · EVEN
- County
- — inherits STATE
- City
- — inherits STATE
ZIP-level market 15902
- Home prices YoY
- -28.8%
- Active inventory
- 64
- Price-to-rent
- 4.7×
Monthly cashflow live
- Estimated rent
- $1,765 high interval (Pro) →
- Mortgage (P&I)
- −$262
- Tax from tax record
- −$138 /mo · $1,656/yr
- Insurance
- −$21
- HOA
- −$0
- Vacancy / Maint / Mgmt
- −$371
- Net cashflow
- $974
Break-even live
2-unit breakdown (identical units grouped — click to expand)
| Units | Beds | Baths | Est. rent |
|---|---|---|---|
| 2× units | 2 | 1 | $1,766 |
| #1 | 2 | 1 | $883 |
| #2 | 2 | 1 | $883 |
| Total (2 units) | $1,765 | ||
UW: 25.0% down · 7.5% · 30yr · 1.5% tax · 5.0% vac · 8.0% maint · 8.0% mgmt
Financing live
Cash to close
- Down payment
- $12,475
- Closing costs
- $1,497
- Reserves months
- —
- Total cash needed
- —
Loan-product check · same deal, 3 products live
Conventional
25% down · 7.5% · 30yr
- Down + closing
- —
- Monthly P&I
- —
- Monthly cashflow
- —
- DSCR
- —
- Eligible?
- —
Personal DTI + credit; lowest rate.
DSCR
20% down · 8.5% · 30yr
- Down + closing
- —
- Monthly P&I
- —
- Monthly cashflow
- —
- DSCR
- —
- Eligible?
- —
No personal income docs; deal must DSCR.
Hard money
10% down · 12.0% · 12mo
- Down + closing
- —
- Monthly P&I
- —
- Monthly cashflow
- —
- DSCR
- —
- Eligible?
- —
Short-term bridge; refi at stabilization.
Rent comps 1 comps
| Address | Beds | Baths | Sqft | Rent | $/sqft | DOM | Units | Dist |
|---|---|---|---|---|---|---|---|---|
| 704 Cypress Ave Unit 706 Johnstown, PA | 3.0 | 1.0 | 2496 | $950 | $0.38 | 43d | 1 | 0.08mi |
Listing history 3 events
-
2026-05-18status Pending 704-char remark
-
2026-05-12$49,900 Active 704-char remark
-
1995-10-01soldstatus $31,500
ⓘ Source: listings_history table (triggers on properties + properties_extension) + one-shot
backfill from property_details.listing_events for pre-trigger history.
Tax reassessment forecast PA · Partial reset (capped growth)
- Current annual tax
- $1,656 · $138/mo
- Projected year-2 tax
- $1,656 · $138/mo
- Expected delta
- $0/yr ($0/mo · 0.0%)
ⓘ Screening estimate from a state-policy table — verify with the county assessor before closing.
Climate risk First Street
- Flood 1/10 Low FEMA zone X (unshaded) · 0% chance over 30 yrs
- Wildfire 1/10 Low
- Heat 4/10 Moderate 7 d/yr ≥93°F today · 19 d/yr by 30 yrs out
- Wind 2/10 Low
- Air quality 2/10 Low 1 unhealthy d/yr today · 2 by 30 yrs out
Nearby sold comps map
Loading sold comps map…
Walkable amenities ~0.75 mi
Loading nearby amenities…
Taxation est. · year 1
- Rental income
- $21,180
- − Mortgage interest
- −$2,795
- − Property taxes
- −$1,656
- − Insurance
- −$250
- − Repairs & maintenance
- −$1,694
- − Management
- −$1,694
- − Depreciation
- −$1,452
- Taxable income
- $11,639
- Est. tax owed @ 24.0%
- −$2,793
- After-tax cash flow
- $8,894/yr
For passive investors: Depreciation is non-cash, so a rental often shows a tax loss while cash-flowing — sheltering income. Rental losses are passive: they offset passive income freely, and up to $25,000/yr can offset ordinary (W-2) income if you actively participate and your MAGI is under $100k (phasing out to $0 by $150k); unused losses carry forward. On sale, claimed depreciation is recaptured at up to 25%, and gains may owe capital-gains tax (a 1031 exchange can defer both). Figures are a year-1 estimate at your 24.0% rate — not tax advice; consult a CPA.
Schools (NCES district)
- District
- Greater Johnstown SD
- NCES district ID
- 4210950
- Math proficiency
- 9% ▼ -6.00%
- Reading proficiency
- 25% ▼ -6.00%
- Median HH income
- $27,890
- Composite
- 13.25/100
- National rank
- #9550
- State rank
- #509 of 539 in PA
Livability — Johnstown
- Score
- 77/100
- State rank
- #363
- US rank
- #3168
Category grades
Schools grade is shown separately in the Schools card above.
Census & demographics
- Census place
- Johnstown, PA
- County
- Cambria County · 30,791 people
- City population
- 30,791
- Metro
- Johnstown, PA
- Population (ZIP)
- 11,462
- Household income
- $44,215
- Rent vs Own
- Severe rent burden
- 266.0
Population outlook (Cambria County) Hauer SSP2
- Today (2025)
- 122,754 people
- By 2030
- 115,827 · -5.6%
- By 2040
- 101,309 · -17.5%
- By 2050
- 88,379 · -28.0%
- By 2075
- 65,237 · -46.9%
- By 2100
- 46,909 · -61.8%
Race, ethnicity, and origin ACS 2023
- Neighborhood character
- Predominantly White (75%)
- Race & ethnicity
- White 75% Two or more races 14% Black 8% Hispanic / Latino 3%
- Common ancestry
- Romanian 7% Slovak 2% Hungarian 2%
- Foreign-born
- 2% · Canada
- Languages at home
- 97% English-only · Spanish 2%
Political lean MEDSL · Cambria
- 2024 margin
- Solid R (+39.7) · D 29.8% · R 69.5%
- 2008→2024 swing
- -40.4pp toward R · 2008: 0.7pp · 2024: -39.7pp
- All cycles
- 2024: R+39.7 2020: R+37.3 2016: R+37.8 2012: R+17.8 2008: D+0.7
Not yet ingested
- Civics
- —
Market trends
- HPI YoY
- ▼ -43.86%
- Current HPI
- 108.2198
- Rent YoY
- —
- Metro
- Johnstown, PA
- State GDP YoY
- ▲ 1.68%
- F500 in state
- 34
Industry mix (Fortune 500 HQ in PA)
| Industry | F500 HQs | Revenue |
|---|---|---|
| Healthcare | 2 | $309B |
|
||
| Insurance | 2 | $27B |
|
||
| Telecommunications / Media | 1 | $124B |
|
||
| Industrial Distribution | 1 | $22B |
|
||
| Financial Services | 1 | $20B |
|
||
| Chemicals / Materials | 1 | $18B |
|
||
Price history
+58.4% since first listed3 events — show timeline
- 2026-05-18 Pending — CSMLS
- 2026-05-12 Listed $49,900 CSMLS
- 1995-10-01 Sold (Public Records) $31,500 Public Records
Property tax history
+0.2%/yrLatest (2026): $1,656 · +0.0% YoY. Source: county tax records.
Cash-flow waterfall
monthlySold comps — $/sqft
last 12 mo · ≤1 miLoading sold comps…