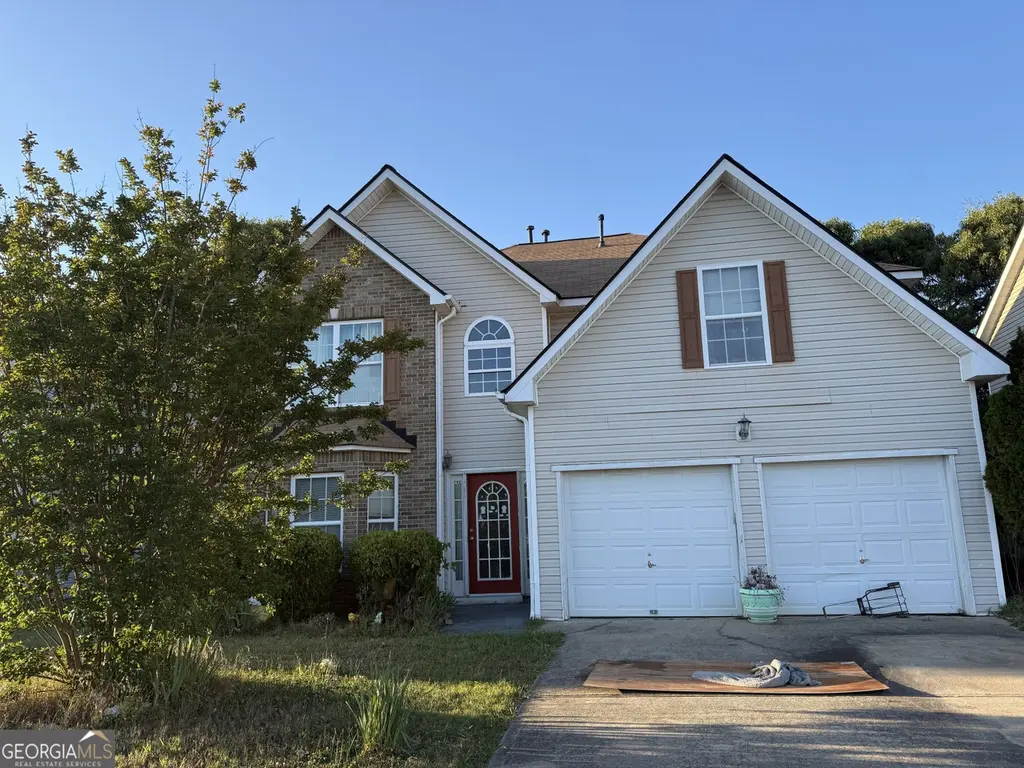
11631 Kades Trl · Lovejoy, GA
Flood risk 1/10 · Minimal
- FEMA flood zone
- X (unshaded)
- Chance of flooding over 30 yrs
- 0.0%
- Est. flood insurance / yr
- $507 – $1,088
Fire risk 3/10 · Minor
- Est. fire insurance / yr
- $963 – $1,789
Heat risk 6/10 · Moderate
- Hot days now (above 105°F)
- 7 days/yr
- Hot days in 30 yrs
- 20 days/yr
Wind risk 6/10 · Moderate
- Chance of severe wind over 30 yrs
- 27.0%
Air-quality risk 4/10 · Minor
- Unhealthy air days now
- 4 days/yr
- Unhealthy air days in 30 yrs
- 5 days/yr
Risk factors via First Street. Map © Google.
Why this score? — see what drove the D+ grade
The composite is a weighted blend of 9 inputs, each scored 0–100. Each bar is that input's sub-score; the figure is the points it added to the 100-point composite (weight × sub-score).
- Cash flow +15.3/30.0
- ARV discount +15.0/15.0
- DSCR +4.7/10.0
- 1% rule +3.7/10.0
- Rent growth +3.1/5.0
- Livability +3.1/5.0
- Condition / age +2.5/5.0
- Schools +1.3/10.0
- Appreciation +0.0/10.0
$269,000
🖨 Deal sheet (PDF) 📄 Offer letter ✓ Due diligence
Listing remarks
Great opportunity for investors, renovators, or buyers looking to build equity with improvements. Spacious Kades Cove home with flexible living space and value-add potential. Property may function as a 5-bedroom / 3 bath layout, with the main floor optional office or as the 5th bedroom. Separate Dining Room and Fireplace on the main level. High ceilings throughout, tray ceilings in dining room, primary bedroom and additional upstairs bedroom. Sold as-is, where-is, with no seller repairs. Probate sale subject to court approval. Buyer is responsible for verifying all information including but not limited to condition, systems, bedroom count, HOA/community association information, and all pro
Key facts
- Value-add potential
- Separate dining room
- Fireplace
Tags
Property features AI
Finance
- Other: Association present; Property sold as-is; estate owned with no disclosure; agent/seller relationship noted
- HOA & community: Homeowners association with a monthly fee of $275 (fee covers other items)
Exterior
- Parking: Off-street parking
- Utilities: Public water; Public sewer; Electricity available; Natural gas available
- Home design: Single-family house; Two levels; Residential property; Built in 2007; Property marked as fixer
- Construction: Brick and vinyl siding construction; Composition roof; Slab foundation; Built in 2007
- Exterior features: Brick and vinyl siding exterior; Composition roof; Slab foundation; Lot features: Other
Interior
- Kitchen: Breakfast area
- Bedrooms: 5 bedrooms total; 1 bedroom on the main level
- Flooring: Other flooring
- Bathrooms: 3 full bathrooms; 1 bathroom on the main level
- Heating & cooling: Central heating (natural gas); Central air conditioning
- Interior features: Tray ceilings; Fireplace (1)
- Laundry & utility: Laundry room on the upper level
Neighborhood map
What this means for you Summary
Snapshot
- This is a 4-bed/3.0-bath single-family listed at $269k.
Deal economics
- At list price, monthly cash flow is $101 ($1k/yr) — positive.
- The deal already cash-flows at list — no discount required.
- To meet the 1% rule (rent ≥ 1% of price), the offer needs to be $234k (13.2% below list).
- Recommended offer: $234k (13.2% below list) — sets the bar for 1% rule.
- Cap rate 6.7% vs local median 4.4% in Lovejoy — top-decile yield for the area; either an underpriced asset or a hidden risk that comps aren't pricing in. Stress-test before assuming the spread holds.
Location & tenants
- Location reads 62/100 on livability (#317 in GA) — a middle-class / working-renter tenant base. Strengths: cost of living A+, housing A+; Watch: employment C-, amenities F, commute F.
- Clayton County (suburban): math 11% / reading 20% proficiency, ranked #155 of 174 in GA (top 89%) — low school quality limits family demand, transient renter base, plan for 1-2y turnover; 78% free/reduced lunch — lower-income household profile, screen leases tightly.
- Zoned schools: Eddie White Middle School (math 8% / reading 22%, grade F, #399 of 470 statewide, top 86%, 1,438 students, 90% FRL); Lovejoy High School (math 7% / reading 8%, grade F, #378 of 424 statewide, top 91%, 2,136 students, 90% FRL).
- Market conditions: Rents rising (+2.2%/yr); 561 active listings in the ZIP; 28 comparable units currently listed for rent nearby; rentals at typical pace (median 21d on market — plan ~3-4 weeks tenant-placement turnaround); solid renter incomes; 865 units permitted in Clayton County in 2024 (448 in 5+ unit buildings).
- This rent runs 34% of the median local income ($83k/yr) — at the standard rent-burdened threshold; future hikes will face affordability resistance.
Forward outlook
- Local home prices are declining (-3.0%/yr); year-one equity from $2k of loan paydown is wiped out by about $8k of value loss. Plan a longer hold.
- Clayton County population projected at +29% by 2050 — long-run rental-demand tailwind backs the buy-and-hold thesis.
Negotiation context
- It's been on market 27 days — a 2% lower offer ($265k) is reasonable based on typical stale-listing flexibility.
- 3 sale attempts with the ask held roughly flat each time — persistent listings suggest the price (not the market) is what's stuck; bring a comps-based counter.
Risks & watch-outs
- Climate carrying-cost: major wind risk, 27% chance of damaging wind over 30y; extreme-heat days projected 7→20/yr by 2055 (HVAC capex compounding) — expect insurance premiums to compound above CPI over the hold.
Questions for the listing agent
- What does the HOA fee cover, when was the last increase, and are there any pending special assessments or reserve-fund shortfalls?
- Is there a deadline driving the sale (1031 exchange, divorce, estate, relocation)? That informs how much negotiation room exists.
- Schools are F-rated, which usually means shorter tenancies and higher turnover. Who's the typical renter profile here, and what's been the actual vacancy rate?
- The area grade is low — what's the realistic commute time and amenity access for the typical tenant pool here? Any planned neighborhood developments (good or bad) we should know about?
- What's the average days-on-market for RENTAL listings here right now (not sales)? A rising rental-DOM trend means longer vacancies and softer asking-rent achievability than the comps imply.
- What's the recent tenant-quality profile in this submarket — average credit score on applications, eviction rate, late-payment / NSF rate, and stable-employment percentage? A property-management company in the area should have these aggregated.
- How much new for-sale + rental construction is in the pipeline within 1–3 miles? Heavy new supply typically softens prices + rents 12–24 months out; constrained supply supports both.
Investment metrics
- 1% rule
- 0.87% ✗
- Cap rate
- 6.74%
- Cash-on-cash
- 1.60%
- DSCR
- 1.07
- GRM
- 9.6
CMA / ARV
- ARV (on-the-fly)
- $361,944
- Comps found
- 12
Show comp detail 12 sales within ~0.75 mi
| Address | Dist | Beds/Ba | Sqft | Sold | Price | $/sf | Match |
|---|---|---|---|---|---|---|---|
| 2036 Registry Dr | 0.30mi | 4/2.5 | 2,714 (-1%) | 3mo | $305,000 | $112 | 80 |
| 1928 Simmons Ln | 0.15mi | 5/3.0 (+1) | 2,526 (-8%) | 1mo | $279,000 | $110 | 74 |
| 11867 Registry Blvd | 0.29mi | 4/3.0 | 2,357 (-14%) | 4mo | $315,000 | $134 | 60 |
| 1538 Woodvale St | 0.72mi | 4/2.5 | 2,644 (-4%) | 1mo | $306,200 | $116 | 57 |
| 2234 Sawgrass Dr | 0.47mi | 5/3.0 (+1) | 3,044 (+11%) | 2mo | $337,000 | $111 | 53 |
| 1801 Quaker | 0.74mi | 4/3.0 | 2,565 (-6%) | 2mo | $447,000 | $174 | 53 |
| 11684 Stovall Pl | 0.64mi | 4/3.5 | 2,560 (-7%) | 7mo | $339,900 | $133 | 51 |
| 1526 Woodvale St | 0.75mi | 5/3.0 (+1) | 2,644 (-4%) | 4mo | $327,500 | $124 | 51 |
| 1478 Farrell Ln | 0.69mi | 5/3.0 (+1) | 2,511 (-8%) | 2mo | $332,000 | $132 | 47 |
| 2106 Bridgewater Pass | 0.73mi | 4/2.5 | 2,430 (-11%) | 4mo | $311,000 | $128 | 41 |
| 11917 Brightside Pkwy | 0.67mi | 4/3.5 | 2,386 (-13%) | 6mo | $314,000 | $132 | 40 |
| 2385 Aukerman Trce #80 | 0.73mi | 4/2.5 | 2,373 (-14%) | 6mo | $338,690 | $143 | 36 |
Match score weights: distance 35% · size 25% · config 20% · recency 20%. Top-matched comps best support the ARV.
Projected returns pro-forma
-3.0% appreciation · 2.2% rent growth · sell at horizon
- IRR
- -14.6%
- Equity multiple
- 0.48×
- Total profit
- $-39,084
- Equity at exit
- $40,109
- IRR
- -7.2%
- Equity multiple
- 0.56×
- Total profit
- $-33,460
- Equity at exit
- $23,258
Cash invested: $75,320 (down + closing). Projections, not guarantees.
Landlord ↔ Tenant lean methodology
- Overall (STATE)
- 90 Strongly Landlord-Friendly
- State Georgia
- 90 Strongly Landlord-Friendly · R+3
- County
- — inherits STATE
- City
- — inherits STATE
ZIP-level market 30228
- Home prices YoY
- -24.3%
- Rents YoY
- 2.2%
- Active inventory
- 561
- Price-to-rent
- 9.6×
Monthly cashflow live
- Estimated rent
- $2,336 high interval (Pro) →
- Mortgage (P&I)
- −$1,411
- Tax from tax record
- −$199 /mo · $2,389/yr
- Insurance
- −$112
- HOA
- −$23
- Vacancy / Maint / Mgmt
- −$491
- Net cashflow
- $101
Break-even live
Sensitivity live
| Price | -10% $253 | -5% $177 | +0% $101 | +5% $24 | +10% $-52 |
|---|---|---|---|---|---|
| Rent | -10% $-84 | -5% $8 | +0% $101 | +5% $193 | +10% $285 |
| Rate | -1.0pp $236 | -0.5pp $169 | base $101 | +0.5pp $31 | +1.0pp $-40 |
UW: 25.0% down · 7.5% · 30yr · 1.5% tax · 5.0% vac · 8.0% maint · 8.0% mgmt
Financing live
Cash to close
- Down payment
- $67,250
- Closing costs
- $8,070
- Reserves months
- —
- Total cash needed
- —
Loan-product check · same deal, 3 products live
Conventional
25% down · 7.5% · 30yr
- Down + closing
- —
- Monthly P&I
- —
- Monthly cashflow
- —
- DSCR
- —
- Eligible?
- —
Personal DTI + credit; lowest rate.
DSCR
20% down · 8.5% · 30yr
- Down + closing
- —
- Monthly P&I
- —
- Monthly cashflow
- —
- DSCR
- —
- Eligible?
- —
No personal income docs; deal must DSCR.
Hard money
10% down · 12.0% · 12mo
- Down + closing
- —
- Monthly P&I
- —
- Monthly cashflow
- —
- DSCR
- —
- Eligible?
- —
Short-term bridge; refi at stabilization.
Rent comps 28 comps
| Address | Beds | Baths | Sqft | Rent | $/sqft | DOM | Units | Dist |
|---|---|---|---|---|---|---|---|---|
| 11657 Kades Trl Lovejoy, GA | 5.0 | 3.0 | 3328 | $2,501 | $0.75 | 0d | 1 | 0.06mi |
| 1906 Dalton Way Lovejoy, GA | 3.0 | 3.0 | 2228 | $2,100 | $0.94 | 45d | 1 | 0.06mi |
| 1851 Simmons Ln Lovejoy, GA | 4.0 | 2.5 | 1940 | $2,211 | $1.14 | 0d | 1 | 0.12mi |
| 11664 Flemming Ct Lovejoy, GA | 3.0 | 2.5 | 2025 | $2,040 | $1.01 | 0d | 1 | 0.19mi |
| 11517 Haleigh St Lovejoy, GA | 3.0 | 3.0 | 2228 | $2,000 | $0.90 | 45d | 1 | 0.20mi |
| 11540 Alicias Ct Lovejoy, GA | 3.0 | 2.5 | 1876 | $1,711 | $0.91 | 7d | 1 | 0.22mi |
| 11768 Registry Blvd Lovejoy, GA | 5.0 | 3.5 | 3118 | $2,581 | $0.83 | 4d | 1 | 0.25mi |
| 2051 Registry Ct Lovejoy, GA | 4.0 | 3.0 | 2188 | $1,940 | $0.89 | 45d | 1 | 0.31mi |
| 11688 Brightside Pkwy Lovejoy, GA | 4.0 | 2.5 | 2089 | $2,200 | $1.05 | 0d | 1 | 0.61mi |
| 2355 Brianna Dr Lovejoy, GA | 3.0 | 2.5 | 1876 | $1,476 | $0.79 | 14d | 1 | 0.64mi |
| 11248 James Madison Dr Hampton, GA | 3.0 | 2.5 | 1986 | $1,980 | $1.00 | 13d | 1 | 0.69mi |
| 1494 Townsend Ct Lovejoy, GA | 4.0 | 2.5 | 3044 | $3,200 | $1.05 | 21d | 1 | 0.70mi |
| 2195 Bridgewater Pass Lovejoy, GA | 4.0 | 2.0 | 2430 | $2,800 | $1.15 | 45d | 1 | 0.72mi |
| 2275 Nicole Dr Lovejoy, GA | 4.0 | 2.0 | 1800 | $1,835 | $1.02 | 7d | 1 | 0.78mi |
| 1562 Onalee Dr Hampton, GA | 3.0 | 2.0 | 2125 | $1,800 | $0.85 | 45d | 1 | 0.87mi |
| 1562 Onalee Dr Hampton, GA | 3.0 | 2.5 | 2125 | $1,775 | $0.84 | 20d | 1 | 0.87mi |
| 11899 Conrad Cir Lovejoy, GA | 4.0 | 2.5 | 1966 | $2,300 | $1.17 | 6d | 1 | 0.89mi |
| 11084 Knotty Pine Pl Hampton, GA | 3.0 | 2.0 | 2566 | $1,740 | $0.68 | 5d | 1 | 1.02mi |
| 11647 Matthews Trl Hampton, GA | 3.0 | 2.0 | 3398 | $1,835 | $0.54 | 22d | 1 | 1.17mi |
| 1511 Mine Run Hampton, GA | 4.0 | 2.5 | 2590 | $2,345 | $0.91 | 7d | 1 | 1.22mi |
| 11116 Shadow Creek Ter Hampton, GA | 3.0 | 2.5 | 2195 | $2,035 | $0.93 | 14d | 1 | 1.26mi |
| 11086 Shadow Ct #60 Hampton, GA | 4.0 | 2.5 | 2253 | $2,300 | $1.02 | 26d | 1 | 1.26mi |
| 10988 Mansura Pl Hampton, GA | 4.0 | 2.5 | 2590 | $2,000 | $0.77 | 26d | 1 | 1.33mi |
| 10950 Southwood Dr Hampton, GA | 4.0 | 2.5 | 2116 | $2,095 | $0.99 | 45d | 1 | 1.33mi |
| 1371 Pebble Ridge Ln Hampton, GA | 3.0 | 3.0 | 2109 | $2,120 | $1.01 | 26d | 1 | 1.34mi |
| 1241 England Ter Hampton, GA | 4.0 | 2.5 | 2672 | $2,700 | $1.01 | 20d | 1 | 1.40mi |
| 10887 Tara Blvd Hampton, GA | 3.0 | 2.5 | 1756 | $2,032 | $1.16 | 6d | 10 | 1.44mi |
| 1306 Pebble Beach Ln Hampton, GA | 4.0 | 2.5 | 2610 | $2,375 | $0.91 | 45d | 1 | 1.49mi |
HOA detail
- Monthly dues
- $23 · $276/yr
Listing history 22 events
-
2026-06-21remarks 699-char remark
-
2026-06-21days on market $269,000 Active 27 DOM
-
2026-06-18days on market $269,000 Active 24 DOM
-
2026-06-17days on market $269,000 Active 23 DOM
-
2026-06-16days on market $269,000 Active 22 DOM
-
2026-06-15days on market $269,000 Active 21 DOM
-
2026-06-13days on market $269,000 Active 19 DOM
-
2026-06-09days on market $269,000 Active 15 DOM
-
2026-06-08statusdays on market $269,000 Active 14 DOM
-
2026-06-07days on market $269,000 New 13 DOM
-
2026-06-04days on market $269,000 New 10 DOM
-
2026-06-03days on market $269,000 New 9 DOM
-
2026-06-02days on market $269,000 New 8 DOM
-
2026-06-01days on market $269,000 New 7 DOM
-
2026-05-31days on market $269,000 New 6 DOM
-
2026-05-25$269,000 New
-
2025-10-10historical
-
2025-10-10historical
-
2025-07-29price $300,000
-
2025-07-29price $300,000
-
2025-05-09$320,000 Active
-
2025-05-09$320,000 New
ⓘ Source: listings_history table (triggers on properties + properties_extension) + one-shot
backfill from property_details.listing_events for pre-trigger history.
Tax reassessment forecast GA · Resets to sale price
- Current annual tax
- $2,389 · $199/mo
- Projected year-2 tax
- $2,475 · $206/mo
- Expected delta
- +$86/yr (+$7/mo · 3.6%)
ⓘ Screening estimate from a state-policy table — verify with the county assessor before closing.
Climate risk First Street
- Flood 1/10 Low FEMA zone X (unshaded) · 0% chance over 30 yrs
- Wildfire 3/10 Moderate
- Heat 6/10 Major 7 d/yr ≥105°F today · 20 d/yr by 30 yrs out
- Wind 6/10 Major 27% chance of damaging wind over 30 yrs
- Air quality 4/10 Moderate 4 unhealthy d/yr today · 5 by 30 yrs out
Nearby sold comps map
Loading sold comps map…
Walkable amenities ~0.75 mi
Loading nearby amenities…
Taxation est. · year 1
- Rental income
- $28,031
- − Mortgage interest
- −$15,068
- − Property taxes
- −$2,389
- − Insurance
- −$1,345
- − Repairs & maintenance
- −$2,243
- − Management
- −$2,243
- − HOA
- −$276
- − Depreciation
- −$7,825
- Taxable loss
- −$3,357
- Est. tax savings @ 24.0%
- +$806
- After-tax cash flow
- $2,013/yr
For passive investors: Depreciation is non-cash, so a rental often shows a tax loss while cash-flowing — sheltering income. Rental losses are passive: they offset passive income freely, and up to $25,000/yr can offset ordinary (W-2) income if you actively participate and your MAGI is under $100k (phasing out to $0 by $150k); unused losses carry forward. On sale, claimed depreciation is recaptured at up to 25%, and gains may owe capital-gains tax (a 1031 exchange can defer both). Figures are a year-1 estimate at your 24.0% rate — not tax advice; consult a CPA.
Schools (NCES district)
- District
- Clayton County
- NCES district ID
- 1301230
- Math proficiency
- 11% ▼ -13.00%
- Reading proficiency
- 20% ▼ -9.00%
- Median HH income
- $42,266
- Composite
- 13.41/100
- National rank
- #9527
- State rank
- #155 of 174 in GA
Livability — Lovejoy
- Score
- 62/100
- State rank
- #317
- US rank
- #17071
Category grades
Schools grade is shown separately in the Schools card above.
Census & demographics
- Census place
- Lovejoy, GA
- County
- Henry County · 316,359 people
- City population
- 606
- Metro
- Atlanta-Sandy Springs-Alpharetta, GA
- Population (ZIP)
- 52,402
- Household income
- $82,619
- Rent vs Own
- Severe rent burden
- 1285.0
Population outlook (Clayton County) Hauer SSP2
- Today (2025)
- 310,777 people
- By 2030
- 329,762 · +6.1%
- By 2040
- 368,052 · +18.4%
- By 2050
- 401,196 · +29.1%
- By 2075
- 472,488 · +52.0%
- By 2100
- 500,446 · +61.0%
Race, ethnicity, and origin ACS 2023
- Neighborhood character
- Majority Black (63%)
- Race & ethnicity
- Black 63% White 23% Hispanic / Latino 8% Two or more races 6% Asian 2%
- Hispanic origin (detail)
- Mexican 5% Puerto Rican 1%
- Common ancestry
- Hispanic 4% Lithuanian 1% Italian 1%
- Foreign-born
- 9% · Canada, Vietnam, Jamaica
- Languages at home
- 89% English-only · Spanish 6% French/Haitian/Cajun 2% Vietnamese 1%
Political lean MEDSL · Clayton
- 2024 margin
- Solid D (+69.2) · D 84.3% · R 15.1%
- 2008→2024 swing
- +2.8pp toward D · 2008: 66.4pp · 2024: 69.2pp
- All cycles
- 2024: D+69.2 2020: D+70.9 2016: D+71.9 2012: D+70.1 2008: D+66.4
Not yet ingested
- Civics
- —
Market trends
- HPI YoY
- ▼ -71.11%
- Current HPI
- 222.0357
- Rent YoY
- ▲ 2.20%
- Metro
- Atlanta-Sandy Springs-Alpharetta, GA
- State GDP YoY
- ▲ 2.66%
- F500 in state
- 28
Industry mix (Fortune 500 HQ in GA)
| Industry | F500 HQs | Revenue |
|---|---|---|
| Paper / Packaging | 2 | $29B |
|
||
| Retail | 1 | $160B |
|
||
| Transportation / Logistics | 1 | $91B |
|
||
| Airlines | 1 | $62B |
|
||
| Consumer Goods | 1 | $47B |
|
||
| Utilities | 1 | $25B |
|
||
Price history
-15.9% since first listed7 events — show timeline
- 2026-05-25 Listed $269,000 GAMLS
- 2025-10-10 Listing Removed — GAMLS
- 2025-10-10 Listing Removed — FMLS
- 2025-07-29 Price Changed $300,000 GAMLS
- 2025-07-29 Price Changed $300,000 FMLS
- 2025-05-09 Listed $320,000 GAMLS
- 2025-05-09 Listed $320,000 FMLS
Property tax history
+0.0%/yrLatest (2025): $2,389 · -4.7% YoY. Source: county tax records.
Cash-flow waterfall
monthlySold comps — $/sqft
last 12 mo · ≤1 miLoading sold comps…