 Fourplex
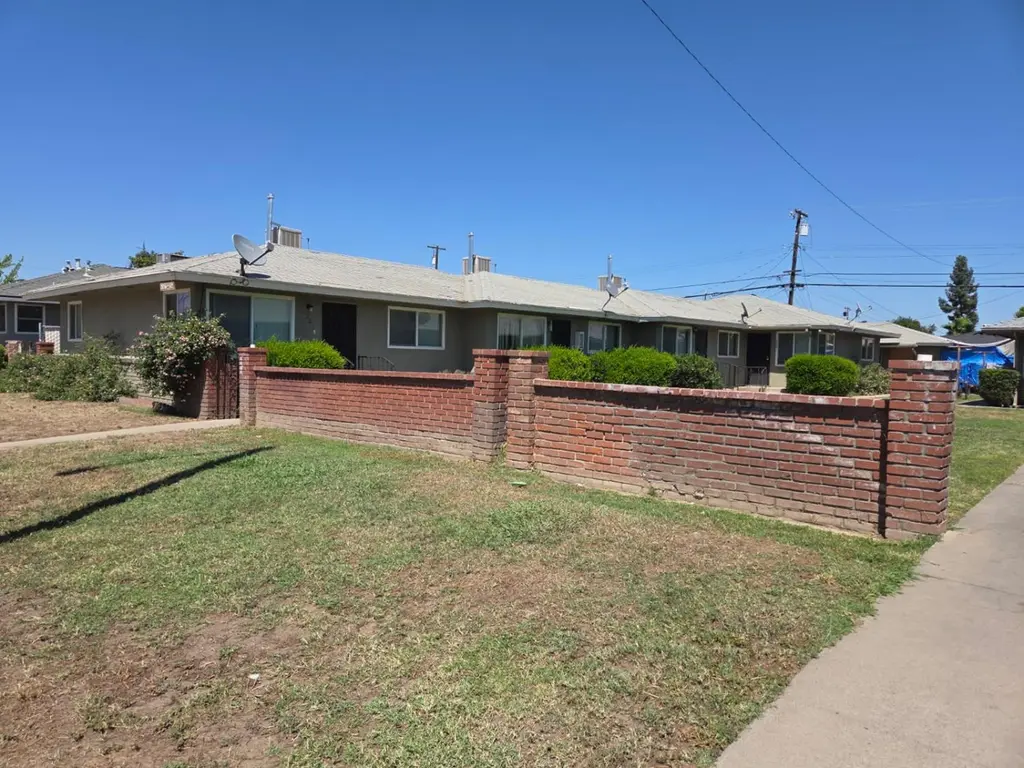
2036 N First · Fresno, CA
Flood risk 5/10 · Moderate
- FEMA flood zone
- X (unshaded)
- Chance of flooding over 30 yrs
- 0.43%
- Est. flood insurance / yr
- $507 – $1,088
Fire risk 1/10 · Minimal
- Est. fire insurance / yr
- $659 – $1,223
Heat risk 8/10 · Major
- Hot days now (above 105°F)
- 7 days/yr
- Hot days in 30 yrs
- 17 days/yr
Wind risk 1/10 · Minimal
- Chance of severe wind over 30 yrs
- —
Air-quality risk 10/10 · Severe
- Unhealthy air days now
- 48 days/yr
- Unhealthy air days in 30 yrs
- 50 days/yr
Risk factors via First Street. Map © Google.
Why this score? — see what drove the C+ grade
The composite is a weighted blend of 9 inputs, each scored 0–100. Each bar is that input's sub-score; the figure is the points it added to the 100-point composite (weight × sub-score).
- Cash flow +30.0/30.0
- DSCR +10.0/10.0
- 1% rule +8.0/10.0
- Rent growth +4.5/5.0
- Livability +3.1/5.0
- Schools +2.7/10.0
- Condition / age +2.5/5.0
- ARV discount +0.0/15.0
- Appreciation +0.0/10.0
$575,000
🖨 Deal sheet 📄 Offer letter ✓ Due diligence
Multi-family units
County records classify this as Multi-Family (2-4 Unit). Listing-text estimate: 4 units. confirmed
Listing remarks
Long term tenants fill this Mayfair area 4 plex. Each unit has laundry hook ups. Gated carports for added safety. Buyers to cooperate in Seller's IRC 1031 exchange at no cost to buyer.
Key facts
- Gated carports
- 8,398 sq ft lot
- Built 1957
Tags
Property features AI
Exterior
- Parking: Carport with one space per unit
- Utilities: Electric service: On; Public utilities
- Home design: Quadruplex
- Construction: Stucco construction; Composition roof; Concrete perimeter foundation
- Exterior features: One-story property; Urban lot setting with mature landscaping; Composition roof; Stucco exterior; Concrete perimeter foundation
Interior
- Kitchen: Kitchens include refrigerator and stove in each unit
- Bedrooms: 4 bathrooms (bedroom count not provided)
- Bathrooms: 4 bathrooms
- Heating & cooling: Floor or wall heating; Central heating and cooling; Evaporative cooling
- Interior features: Refrigerator included in all units; Stove included in all units; No fireplaces
- Laundry & utility: In-unit laundry
Neighborhood map
What this means for you Summary
Snapshot
- This is a 4 × 5-bed/4.0-bath units multifamily listed at $575k.
Deal economics
- At list price, monthly cash flow is $2k ($26k/yr) — positive. Per door: $539/mo.
- The deal already cash-flows at list — no discount required.
- Meets the 1% rule at list price ($7k rent vs $575k).
- Recommended offer: $558k (3.0% below list) — sets the bar for market timing.
- Cap rate 10.8% vs local median 3.7% in Fresno — top-decile yield for the area; either an underpriced asset or a hidden risk that comps aren't pricing in. Stress-test before assuming the spread holds.
Location & tenants
- Location reads 62/100 on livability (#469 in CA) — a middle-class / working-renter tenant base. Strengths: commute A+, housing A+; Watch: amenities D+, employment D+, schools D.
- Fresno Unified (urban): math 18% / reading 47% proficiency, ranked #327 of 517 in CA (top 63%) — families likely to look elsewhere, expect single-tenant / working-renter base with shorter leases; 77% free/reduced lunch — lower-income household profile, screen leases tightly.
- Market conditions: Rents rising fast (+7.8%/yr); 69 active listings in the ZIP; 2,426 units permitted in Fresno County in 2024 (296 in 5+ unit buildings).
- At $7,454/mo this rent would consume 184% of the median local household income ($49k/yr) (locally 2076% of renters already pay >50% of income on rent) — very limited rent-growth headroom before tenants either downsize or default.
Forward outlook
- Local home prices are declining (-3.0%/yr); year-one equity from $4k of loan paydown is wiped out by about $17k of value loss. Plan a longer hold.
- Fresno County population projected at +11% by 2050 — modest demand growth; plan on rents tracking national, not racing it.
- At projected returns (-3.0% appreciation + 7.8% rent growth), your $161k cash investment doubles in ~6 years — after that, you're playing with house money.
Negotiation context
- It's been on market 34 days — a 3% lower offer ($558k) is reasonable based on typical stale-listing flexibility.
- 2 sale attempts since 8y ago with the ask held roughly flat each time — persistent listings suggest the price (not the market) is what's stuck; bring a comps-based counter.
- Current owner paid $325k; list at $575k implies a 77% gain — meaningful room to come down on a strong offer.
Risks & watch-outs
- Watch-outs: built in 1957 — expect roof / HVAC / electrical / plumbing capex.
- Climate carrying-cost: moderate flood risk; extreme-heat days projected 7→17/yr by 2055 (HVAC capex compounding) — expect insurance premiums to compound above CPI over the hold.
Questions for the listing agent
- It's been on market 34 days. Have you received any prior offers? Is the seller open to a 3% concession, seller financing, or rate buy-down credit?
- Can we see the unit-by-unit rent roll, current vacancy, and any below-market leases? What's the average tenancy length?
- What capital expenditures (roof, boiler, parking lot, exteriors) have been made in the last 5 years, and what's planned in the next 2?
- Built in 1957 — when were the roof, HVAC, electrical panel, plumbing, and water heater last replaced?
- Is there a deadline driving the sale (1031 exchange, divorce, estate, relocation)? That informs how much negotiation room exists.
- Schools are D-rated, which usually means shorter tenancies and higher turnover. Who's the typical renter profile here, and what's been the actual vacancy rate?
- Crime grade is F in this area — have there been break-ins, vandalism, or insurance claims at this property in the last 3 years? What carrier currently insures it and at what premium?
- What's the average days-on-market for RENTAL listings here right now (not sales)? A rising rental-DOM trend means longer vacancies and softer asking-rent achievability than the comps imply.
- What's the recent tenant-quality profile in this submarket — average credit score on applications, eviction rate, late-payment / NSF rate, and stable-employment percentage? A property-management company in the area should have these aggregated.
- How much new apartment / multifamily construction is in the pipeline within 1–3 miles? Heavy new supply (>2% of stock underway) typically softens rents 12–24 months out; light construction supports rent growth.
Investment metrics
- 1% rule
- 1.30% ✓
- Cap rate
- 10.79%
- Cash-on-cash
- 16.07%
- DSCR
- 1.71
- GRM
- 6.4
CMA / ARV
- ARV (median comp)
- $460,912
- List price
- $575,000
- Delta
- 24.75%
- Verdict
- OVERPRICED
- Comps
- 20 within 1.0 mi
Show comp detail 12 sales within ~0.75 mi
| Address | Dist | Beds/Ba | Sqft | Sold | Price | $/sf | Match |
|---|---|---|---|---|---|---|---|
| 3226 E Clinton Ave | 0.21mi | 5/4.0 | 2,700 (+2%) | 16mo | $515,000 | $191 | 74 |
| 3331 - 3337 E Clinton Ave | 0.27mi | 4/4.0 (-1) | 2,496 (-6%) | 1mo | $485,000 | $194 | 72 |
| 2136 N 1st St | 0.06mi | 6/4.0 (+1) | 2,966 (+12%) | 4mo | $550,000 | $185 | 69 |
| 2126 N First St | 0.04mi | 6/4.0 (+1) | 2,966 (+12%) | 8mo | $550,000 | $185 | 66 |
| 2128 N First St | 0.05mi | 6/4.0 (+1) | 2,966 (+12%) | 8mo | $550,000 | $185 | 66 |
| 3323 E Normal | 0.23mi | 5/4.0 | 2,469 (-7%) | 17mo | $460,000 | $186 | 64 |
| 3122 E Normal Ave | 0.13mi | 6/4.0 (+1) | 3,010 (+14%) | 14mo | $520,000 | $173 | 54 |
| 3435 E Mckinley | 0.39mi | 6/4.0 (+1) | 2,966 (+12%) | 4mo | $549,000 | $185 | 53 |
| 2840 N 1st St | 0.51mi | 6/4.0 (+1) | 3,026 (+14%) | 1mo | $555,000 | $183 | 46 |
| 2904 N First St | 0.52mi | 6/4.0 (+1) | 3,026 (+14%) | 7mo | $584,000 | $193 | 41 |
| 2842 N First St | 0.50mi | 6/4.0 (+1) | 3,026 (+14%) | 10mo | $549,000 | $181 | 40 |
| 3004 N 1st St | 0.59mi | 6/4.0 (+1) | 3,026 (+14%) | 8mo | $540,000 | $178 | 37 |
Match score weights: distance 35% · size 25% · config 20% · recency 20%. Top-matched comps best support the ARV.
Projected returns pro-forma
-3.0% appreciation · 7.8% rent growth · sell at horizon
- IRR
- 12.1%
- Equity multiple
- 1.51×
- Total profit
- $81,824
- Equity at exit
- $85,734
- IRR
- 24.5%
- Equity multiple
- 3.60×
- Total profit
- $418,949
- Equity at exit
- $49,715
Cash invested: $161,000 (down + closing). Projections, not guarantees.
Landlord ↔ Tenant lean methodology
- Overall (STATE)
- 18 Strongly Tenant-Friendly
- State California
- 18 Strongly Tenant-Friendly · D+13
- County
- — inherits STATE
- City
- — inherits STATE
ZIP-level market 93703
- Rents YoY
- 7.8%
- Active inventory
- 69
- Price-to-rent
- 25.7×
Monthly cashflow live
- Estimated rent
- $7,454 medium interval (Pro) →
- Mortgage (P&I)
- −$3,015
- Tax from tax record
- −$478 /mo · $5,737/yr
- Insurance
- −$240
- HOA
- −$0
- Vacancy / Maint / Mgmt
- −$1,565
- Net cashflow
- $2,156
Break-even live
4-unit breakdown (identical units grouped — click to expand)
| Units | Beds | Baths | Est. rent |
|---|---|---|---|
| 4× units | 5 | 4 | $7,456 |
| #1 | 5 | 4 | $1,864 |
| #2 | 5 | 4 | $1,864 |
| #3 | 5 | 4 | $1,864 |
| #4 | 5 | 4 | $1,864 |
| Total (4 units) | $7,454 | ||
UW: 25.0% down · 7.5% · 30yr · 1.5% tax · 5.0% vac · 8.0% maint · 8.0% mgmt
Financing live
Cash to close
- Down payment
- $143,750
- Closing costs
- $17,250
- Reserves months
- —
- Total cash needed
- —
Loan-product check · same deal, 3 products live
Conventional
25% down · 7.5% · 30yr
- Down + closing
- —
- Monthly P&I
- —
- Monthly cashflow
- —
- DSCR
- —
- Eligible?
- —
Personal DTI + credit; lowest rate.
DSCR
20% down · 8.5% · 30yr
- Down + closing
- —
- Monthly P&I
- —
- Monthly cashflow
- —
- DSCR
- —
- Eligible?
- —
No personal income docs; deal must DSCR.
Hard money
10% down · 12.0% · 12mo
- Down + closing
- —
- Monthly P&I
- —
- Monthly cashflow
- —
- DSCR
- —
- Eligible?
- —
Short-term bridge; refi at stabilization.
Listing history 19 events
-
2026-06-18days on market $575,000 Active 34 DOM
-
2026-06-17days on market $575,000 Active 33 DOM
-
2026-06-16days on market $575,000 Active 32 DOM
-
2026-06-15days on market $575,000 Active 31 DOM
-
2026-06-13days on market $575,000 Active 29 DOM
-
2026-06-10days on market $575,000 Active 26 DOM
-
2026-06-09days on market $575,000 Active 25 DOM
-
2026-06-08days on market $575,000 Active 24 DOM
-
2026-06-07days on market $575,000 Active 23 DOM
-
2026-06-05days on market $575,000 Active 20 DOM
-
2026-06-03days on market $575,000 Active 19 DOM
-
2026-06-02days on market $575,000 Active 18 DOM
-
2026-06-01days on market $575,000 Active 17 DOM
-
2026-05-31days on market $575,000 Active 16 DOM
-
2026-05-15$575,000 Active 184-char remark
-
2018-12-28status Pending
-
2018-12-28historical Cancelled
-
2018-08-10$319,000 Active
-
2004-07-16soldstatus $325,000
ⓘ Source: listings_history table (triggers on properties + properties_extension) + one-shot
backfill from property_details.listing_events for pre-trigger history.
Tax reassessment forecast CA · Resets to sale price
- Current annual tax
- $5,737 · $478/mo
- Projected year-2 tax
- $5,737 · $478/mo
- Expected delta
- $0/yr ($0/mo · 0.0%)
ⓘ Screening estimate from a state-policy table — verify with the county assessor before closing.
Climate risk First Street
- Flood 5/10 Major FEMA zone X (unshaded) · 43% chance over 30 yrs
- Wildfire 1/10 Low
- Heat 8/10 Severe 7 d/yr ≥105°F today · 17 d/yr by 30 yrs out
- Wind 1/10 Low
- Air quality 10/10 Extreme 48 unhealthy d/yr today · 50 by 30 yrs out
Nearby sold comps map
Loading sold comps map…
Walkable amenities ~0.75 mi
Loading nearby amenities…
Taxation est. · year 1
- Rental income
- $89,448
- − Mortgage interest
- −$32,209
- − Property taxes
- −$5,737
- − Insurance
- −$2,875
- − Repairs & maintenance
- −$7,156
- − Management
- −$7,156
- − Depreciation
- −$16,727
- Taxable income
- $17,588
- Est. tax owed @ 24.0%
- −$4,221
- After-tax cash flow
- $21,646/yr
For passive investors: Depreciation is non-cash, so a rental often shows a tax loss while cash-flowing — sheltering income. Rental losses are passive: they offset passive income freely, and up to $25,000/yr can offset ordinary (W-2) income if you actively participate and your MAGI is under $100k (phasing out to $0 by $150k); unused losses carry forward. On sale, claimed depreciation is recaptured at up to 25%, and gains may owe capital-gains tax (a 1031 exchange can defer both). Figures are a year-1 estimate at your 24.0% rate — not tax advice; consult a CPA.
Schools (NCES district)
- District
- Fresno Unified
- NCES district ID
- 0614550
- Math proficiency
- 18% ▼ -12.00%
- Reading proficiency
- 47% ▲ 9.00%
- Median HH income
- $36,095
- Composite
- 26.83/100
- National rank
- #7111
- State rank
- #327 of 517 in CA
Livability — Fresno
- Score
- 62/100
- State rank
- #469
- US rank
- #15907
Category grades
Schools grade is shown separately in the Schools card above.
Census & demographics
- Census place
- Fresno, CA
- County
- Fresno County · 834,801 people
- City population
- 593,114
- Metro
- Fresno, CA
- Population (ZIP)
- 33,420
- Household income
- $48,737
- Rent vs Own
- Severe rent burden
- 2076.0
Population outlook (Fresno County) Hauer SSP2
- Today (2025)
- 1,042,971 people
- By 2030
- 1,072,198 · +2.8%
- By 2040
- 1,122,408 · +7.6%
- By 2050
- 1,157,251 · +11.0%
- By 2075
- 1,182,575 · +13.4%
- By 2100
- 1,105,899 · +6.0%
Race, ethnicity, and origin ACS 2023
- Neighborhood character
- Diverse neighborhood (Simpson 0.56)
- Race & ethnicity
- Hispanic / Latino 63% Two or more races 26% Asian 14% White 12% Black 8% Native American 1%
- Hispanic origin (detail)
- Mexican 60%
- Foreign-born
- 21% · Canada, Vietnam
- Languages at home
- 47% English-only · Spanish 41% Other Asian/Pacific 9% Other Indo-European 1%
Political lean MEDSL · Fresno
- 2024 margin
- Toss-up / Even · D 46.5% · R 50.9% · Other 2.6%
- 2008→2024 swing
- -6.5pp toward R · 2008: 2.1pp · 2024: -4.4pp
- All cycles
- 2024: R+4.4 2020: D+7.8 2016: D+3.9 2012: R+2.9 2008: D+2.1
Not yet ingested
- Civics
- —
Market trends
- HPI YoY
- ▼ -274.09%
- Current HPI
- 413.4753
- Rent YoY
- ▲ 7.80%
- Metro
- Fresno, CA
- State GDP YoY
- ▲ 3.21%
- F500 in state
- 116
Industry mix (Fortune 500 HQ in CA)
| Industry | F500 HQs | Revenue |
|---|---|---|
| Technology | 27 | $1,492B |
|
||
| Financial Services | 3 | $174B |
|
||
| Retail | 3 | $44B |
|
||
| Insurance | 3 | $26B |
|
||
| Media / Entertainment | 2 | $115B |
|
||
| Pharmaceuticals / Biotech | 2 | $62B |
|
||
Price history
+76.9% since first listed5 events — show timeline
- 2026-05-15 Listed $575,000 FRESNOMLS
- 2018-12-28 Pending — FRESNOMLS
- 2018-12-28 Delisted — FRESNOMLS
- 2018-08-10 Listed $319,000 FRESNOMLS
- 2004-07-16 Sold (Public Records) $325,000 Public Records
Property tax history
+8.8%/yrLatest (2025): $5,737 · +9.3% YoY. Source: county tax records.
Cash-flow waterfall
monthlySold comps — $/sqft
last 12 mo · ≤1 miLoading sold comps…