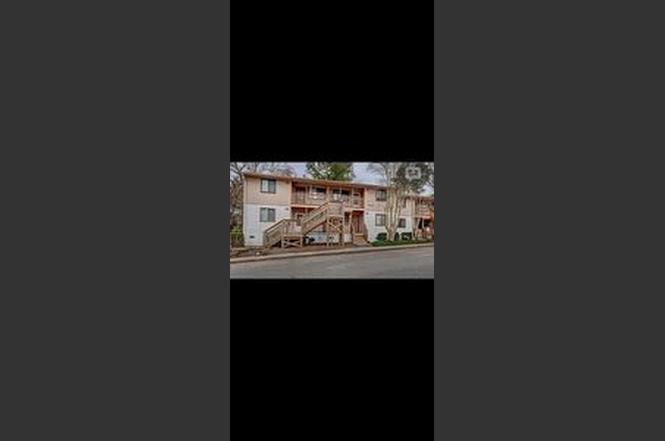
1717 Shipyard Blvd · Wilmington, NC
Flood risk 1/10 · Minimal
- FEMA flood zone
- X (unshaded)
- Chance of flooding over 30 yrs
- 0.0%
- Est. flood insurance / yr
- $507 – $1,088
Fire risk 3/10 · Minor
- Est. fire insurance / yr
- $906 – $1,684
Heat risk 9/10 · Severe
- Hot days now (above 105°F)
- 7 days/yr
- Hot days in 30 yrs
- 17 days/yr
Wind risk 8/10 · Major
- Chance of severe wind over 30 yrs
- 99.0%
Air-quality risk 2/10 · Minimal
- Unhealthy air days now
- 1 days/yr
- Unhealthy air days in 30 yrs
- 1 days/yr
Risk factors via First Street. Map © Google.
Why this score? — see what drove the D+ grade
The composite is a weighted blend of 9 inputs, each scored 0–100. Each bar is that input's sub-score; the figure is the points it added to the 100-point composite (weight × sub-score).
- Cash flow +18.1/30.0
- ARV discount +7.5/15.0
- DSCR +5.7/10.0
- 1% rule +4.9/10.0
- Schools +4.3/10.0
- Livability +3.5/5.0
- Rent growth +2.6/5.0
- Condition / age +2.5/5.0
- Appreciation +0.0/10.0
$152,000
🖨 Deal sheet 📄 Offer letter ✓ Due diligence
Listing remarks MLS
Credit Union owned property. 2 Bedroom 2 Bath 2nd floor end unit. Building exterior just painted. Real property and all improvements are sold in current condition and Seller will make no repairs. Personal property, if any, is not warranted. Property conveys with Special Warranty Deed. Time is of the essence as to all contract dates.
Key facts
- Deck built
- Newer dishwasher
- New hot water heater
Tags
Neighborhood map
What this means for you Summary
Snapshot
- This is a 2-bed/2.0-bath condo listed at $152k.
Deal economics
- At list price, monthly cash flow is $133 ($2k/yr) — positive.
- The deal already cash-flows at list — no discount required.
- To meet the 1% rule (rent ≥ 1% of price), the offer needs to be $150k (1.4% below list).
- Recommended offer: $150k (1.4% below list) — sets the bar for 1% rule.
- Cap rate 7.3% vs local median 2.6% in Wilmington — top-decile yield for the area; either an underpriced asset or a hidden risk that comps aren't pricing in. Stress-test before assuming the spread holds.
Location & tenants
- Location reads 70/100 on livability (#142 in NC) — a middle-class / working-renter tenant base. Strengths: health & safety A+, cost of living B+, housing B+; Watch: amenities C-, employment C-, crime F.
- New Hanover County Schools (urban): math 48% / reading 53% proficiency, ranked #61 of 178 in NC (top 34%) — acceptable for families but not a draw, mixed tenant base, ~2y average lease.
- Market conditions: Rents flat; 187 active listings in the ZIP; 18 comparable units currently listed for rent nearby; rentals leasing fast (median 14d on market — plan ~1-2 weeks tenant-placement turnaround); 2,581 units permitted in New Hanover County in 2024 (1,185 in 5+ unit buildings).
- This rent runs 33% of the median local income ($55k/yr) — at the standard rent-burdened threshold; future hikes will face affordability resistance.
Forward outlook
- Local home prices are declining (-3.0%/yr); year-one equity from $1k of loan paydown is wiped out by about $5k of value loss. Plan a longer hold.
- New Hanover County population projected at +37% by 2050 — long-run rental-demand tailwind backs the buy-and-hold thesis.
Negotiation context
- Only 3 days on market — expect competitive offers; lowballing is unlikely to land.
- 20 sale attempts since 27y ago with the ask held roughly flat each time — persistent listings suggest the price (not the market) is what's stuck; bring a comps-based counter.
- Current owner paid $32k; list at $152k implies a 383% gain — meaningful room to come down on a strong offer.
Risks & watch-outs
- Climate carrying-cost: severe wind risk, 99% chance of damaging wind over 30y; extreme-heat days projected 7→17/yr by 2055 (HVAC capex compounding) — expect insurance premiums to compound above CPI over the hold.
Questions for the listing agent
- Any open or pending special assessments — roof, HVAC, plumbing, elevator, façade? What's the per-unit balance and payoff schedule, and is the seller paying it off at close or rolling it to the buyer?
- Is there a deadline driving the sale (1031 exchange, divorce, estate, relocation)? That informs how much negotiation room exists.
- Crime grade is F in this area — have there been break-ins, vandalism, or insurance claims at this property in the last 3 years? What carrier currently insures it and at what premium?
- The area grade is low — what's the realistic commute time and amenity access for the typical tenant pool here? Any planned neighborhood developments (good or bad) we should know about?
- What's the average days-on-market for RENTAL listings here right now (not sales)? A rising rental-DOM trend means longer vacancies and softer asking-rent achievability than the comps imply.
- What's the recent tenant-quality profile in this submarket — average credit score on applications, eviction rate, late-payment / NSF rate, and stable-employment percentage? A property-management company in the area should have these aggregated.
- How much new apartment / multifamily construction is in the pipeline within 1–3 miles? Heavy new supply (>2% of stock underway) typically softens rents 12–24 months out; light construction supports rent growth.
Investment metrics
- 1% rule
- 0.99% ✗
- Cap rate
- 7.34%
- Cash-on-cash
- 3.75%
- DSCR
- 1.17
- GRM
- 8.5
CMA / ARV
No comps found within radius.
Projected returns pro-forma
-3.0% appreciation · 0.48% rent growth · sell at horizon
- IRR
- -13.3%
- Equity multiple
- 0.53×
- Total profit
- $-19,834
- Equity at exit
- $22,664
- IRR
- -8.8%
- Equity multiple
- 0.51×
- Total profit
- $-20,718
- Equity at exit
- $13,142
Cash invested: $42,560 (down + closing). Projections, not guarantees.
Landlord ↔ Tenant lean methodology
- Overall (STATE)
- 85 Strongly Landlord-Friendly
- State North Carolina
- 85 Strongly Landlord-Friendly · R+3
- County
- — inherits STATE
- City
- — inherits STATE
ZIP-level market 28403
- Rents YoY
- 0.5%
- Active inventory
- 187
- Price-to-rent
- 8.5×
Monthly cashflow live
- Estimated rent
- $1,498 high interval (Pro) →
- Mortgage (P&I)
- −$797
- Tax est. 1.5%
- −$190 /mo · $2,280/yr
- Insurance
- −$63
- HOA
- −$0
- Vacancy / Maint / Mgmt
- −$315
- Net cashflow
- $133
Break-even live
UW: 25.0% down · 7.5% · 30yr · 1.5% tax · 5.0% vac · 8.0% maint · 8.0% mgmt
Financing live
Cash to close
- Down payment
- $38,000
- Closing costs
- $4,560
- Reserves months
- —
- Total cash needed
- —
Loan-product check · same deal, 3 products live
Conventional
25% down · 7.5% · 30yr
- Down + closing
- —
- Monthly P&I
- —
- Monthly cashflow
- —
- DSCR
- —
- Eligible?
- —
Personal DTI + credit; lowest rate.
DSCR
20% down · 8.5% · 30yr
- Down + closing
- —
- Monthly P&I
- —
- Monthly cashflow
- —
- DSCR
- —
- Eligible?
- —
No personal income docs; deal must DSCR.
Hard money
10% down · 12.0% · 12mo
- Down + closing
- —
- Monthly P&I
- —
- Monthly cashflow
- —
- DSCR
- —
- Eligible?
- —
Short-term bridge; refi at stabilization.
Rent comps 18 comps
| Address | Beds | Baths | Sqft | Rent | $/sqft | DOM | Units | Dist |
|---|---|---|---|---|---|---|---|---|
| 2716 S 17th St Unit A Wilmington, NC | 2.0 | 2.0 | 950 | $1,500 | $1.58 | 21d | 1 | 0.17mi |
| 1522 Cadfel Ct Wilmington, NC | 1.0–3.0 | 1.0–2.0 | 1036 | $1,605 | $1.55 | 13d | 13 | 0.28mi |
| 2504 Flint Dr Wilmington, NC | 2.0 | 2.0 | 901 | $1,200 | $1.33 | 13d | 1 | 0.36mi |
| 1436 Harbour Dr Wilmington, NC | 1.0–3.0 | 1.0–2.0 | 812 | $1,248 | $1.54 | 13d | 8 | 0.39mi |
| 2402 Flint Dr Wilmington, NC | 2.0–3.0 | 1.0–2.0 | 1037 | $1,300 | $1.25 | 21d | 6 | 0.42mi |
| 1002 Mayflower Dr Wilmington, NC | 1.0–2.0 | 1.0 | 700 | $1,300 | $1.86 | 21d | 1 | 0.49mi |
| 1299 Wellington Ave Wilmington, NC | 2.0 | 2.0 | 880 | $1,250 | $1.42 | 21d | 1 | 0.51mi |
| 1192 Harbour Dr Wilmington, NC | 2.0–3.0 | 1.5–2.0 | 1142 | $1,320 | $1.16 | 13d | 30 | 0.52mi |
| 2545 Croquet Dr Wilmington, NC | 2.0–3.0 | 2.0–3.0 | 1394 | $1,734 | $1.24 | 13d | 20 | 0.65mi |
| 2320 Canterwood Dr Wilmington, NC | 1.0–3.0 | 1.0–2.0 | 975 | $1,452 | $1.49 | 13d | 9 | 0.66mi |
| 1518 Village Dr Wilmington, NC | 1.0–3.0 | 1.0–2.0 | 1000 | $1,456 | $1.46 | 21d | 7 | 0.69mi |
| 2439 Carolina Cove Way Wilmington, NC | 2.0–3.0 | 2.0–2.5 | 1397 | $1,859 | $1.33 | 13d | 53 | 0.70mi |
| 719 Galley Ln Wilmington, NC | 1.0–3.0 | 1.0–2.0 | 1158 | $1,429 | $1.23 | 13d | 10 | 0.77mi |
| 2945 Midtown Way Wilmington, NC | 1.0–3.0 | 1.0–2.0 | 1041 | $1,725 | $1.66 | 13d | 20 | 0.92mi |
| 1605 Barclay Pointe Blvd Wilmington, NC | 1.0–3.0 | 1.0–2.5 | 1203 | $2,052 | $1.71 | 13d | 30 | 1.00mi |
| 509 Conley Dr Wilmington, NC | 1.0–3.0 | 1.0–2.0 | 938 | $1,244 | $1.33 | 13d | 79 | 1.23mi |
| 1841 Dusty Miller Ln Wilmington, NC | 1.0–3.0 | 1.0–2.0 | 1164 | $2,013 | $1.73 | 13d | 24 | 1.26mi |
| 3733 Merestone Dr Wilmington, NC | 2.0 | 2.0 | 925 | $1,750 | $1.89 | 21d | 1 | 1.43mi |
HOA detail condo
- Monthly dues
- $0 · $0/yr
- Assessments
- None detected in remarks — confirm with the listing agent.
Listing history 4 events
-
2026-06-18days on market $152,000 Active 3 DOM
-
2026-06-17days on market $152,000 Active 2 DOM
-
2026-06-15remarks 627-char remark
-
2026-06-15$152,000 Active 1 DOM
ⓘ Source: listings_history table (triggers on properties + properties_extension) + one-shot
backfill from property_details.listing_events for pre-trigger history.
Climate risk First Street
- Flood 1/10 Low FEMA zone X (unshaded) · 0% chance over 30 yrs
- Wildfire 3/10 Moderate
- Heat 9/10 Extreme 7 d/yr ≥105°F today · 17 d/yr by 30 yrs out
- Wind 8/10 Severe 99% chance of damaging wind over 30 yrs
- Air quality 2/10 Low 1 unhealthy d/yr today · 1 by 30 yrs out
Nearby sold comps map
Loading sold comps map…
Walkable amenities ~0.75 mi
Loading nearby amenities…
Taxation est. · year 1
- Rental income
- $17,978
- − Mortgage interest
- −$8,514
- − Property taxes
- −$2,280
- − Insurance
- −$760
- − Repairs & maintenance
- −$1,438
- − Management
- −$1,438
- − Depreciation
- −$4,422
- Taxable loss
- −$874
- Est. tax savings @ 24.0%
- +$210
- After-tax cash flow
- $1,807/yr
For passive investors: Depreciation is non-cash, so a rental often shows a tax loss while cash-flowing — sheltering income. Rental losses are passive: they offset passive income freely, and up to $25,000/yr can offset ordinary (W-2) income if you actively participate and your MAGI is under $100k (phasing out to $0 by $150k); unused losses carry forward. On sale, claimed depreciation is recaptured at up to 25%, and gains may owe capital-gains tax (a 1031 exchange can defer both). Figures are a year-1 estimate at your 24.0% rate — not tax advice; consult a CPA.
Schools (NCES district)
- District
- New Hanover County Schools
- NCES district ID
- 3703330
- Math proficiency
- 48% ▼ -3.00%
- Reading proficiency
- 53% ▬ 0.00%
- Median HH income
- $49,406
- Composite
- 43.13/100
- National rank
- #3081
- State rank
- #61 of 178 in NC
Livability — Wilmington
- Score
- 70/100
- State rank
- #142
- US rank
- #8131
Category grades
Schools grade is shown separately in the Schools card above.
Census & demographics
- Census place
- Wilmington, NC
- County
- New Hanover County · 232,153 people
- City population
- 215,355
- Metro
- Wilmington, NC
- Population (ZIP)
- 40,319
- Household income
- $54,547
- Rent vs Own
- Severe rent burden
- 3893.0
Population outlook (New Hanover County) Hauer SSP2
- Today (2025)
- 259,517 people
- By 2030
- 279,586 · +7.7%
- By 2040
- 318,223 · +22.6%
- By 2050
- 354,831 · +36.7%
- By 2075
- 437,158 · +68.5%
- By 2100
- 486,769 · +87.6%
Race, ethnicity, and origin ACS 2023
- Neighborhood character
- Predominantly White (74%)
- Race & ethnicity
- White 74% Black 12% Hispanic / Latino 8% Two or more races 5% Asian 2%
- Hispanic origin (detail)
- Mexican 3% Puerto Rican 1% Cuban 1%
- Common ancestry
- Slovak 3% Romanian 2% Italian 2%
- Foreign-born
- 5% · Canada, South Korea, China
- Languages at home
- 92% English-only · Spanish 5% Korean 1% Other Indo-European 1%
Political lean MEDSL · New Hanover
- 2024 margin
- Toss-up / Even · D 49.8% · R 49.1% · Other 1.1%
- 2008→2024 swing
- +2.0pp toward D · 2008: -1.4pp · 2024: 0.6pp
- All cycles
- 2024: D+0.6 2020: D+2.1 2016: R+4.1 2012: R+4.7 2008: R+1.4
Not yet ingested
- Civics
- —
Market trends
- HPI YoY
- ▼ -503.72%
- Current HPI
- 251.0154
- Rent YoY
- ▲ 0.48%
- Metro
- Wilmington, NC
- State GDP YoY
- ▲ 3.28%
- F500 in state
- 26
Industry mix (Fortune 500 HQ in NC)
| Industry | F500 HQs | Revenue |
|---|---|---|
| Financial Services | 2 | $213B |
|
||
| Retail | 2 | $95B |
|
||
| Industrial Conglomerate | 1 | $38B |
|
||
| Metals / Steel | 1 | $35B |
|
||
| Utilities | 1 | $30B |
|
||
| Industrial Machinery | 1 | $19B |
|
||
Price history
+121.9% since first listed39 events — show timeline
- 2026-06-16 Listed $152,000 FSBO.com
- 2026-03-15 Rental Removed $1,150 APPFOLIO
- 2026-02-13 Listed for Rent $1,150 APPFOLIO
- 2025-08-09 Rental Removed $1,300 RENTALBEAST
- 2025-08-04 Listed for Rent $1,300 RENTALBEAST
- 2025-05-23 Rental Removed $1,350 RENTALBEAST
- 2025-05-23 Listed for Rent $1,350 RENTALBEAST
- 2025-03-18 Rental Removed $1,350 RENTALBEAST
- 2025-03-10 Listed for Rent $1,350 RENTALBEAST
- 2025-03-10 Rental Removed $1,400 APPFOLIO
- 2025-01-15 Listed for Rent $1,400 APPFOLIO
- 2024-09-10 Rental Removed $1,500 RENTALBEAST
- 2024-09-05 Listed for Rent $1,500 RENTALBEAST
- 2012-04-19 Sold (MLS) $31,500 Hive MLS
- 2012-03-30 Listed $31,500 Hive MLS
- 2011-02-22 Sold (MLS) $32,600 Hive MLS
- 2010-12-29 Listed $31,900 Hive MLS
- 2009-09-01 Listing Removed — Hive MLS
- 2009-05-06 Listed $78,900 Hive MLS
- 2007-09-28 Sold (MLS) $96,000 Hive MLS
- 2007-08-21 Listed $96,500 Hive MLS
- 2005-12-29 Sold (MLS) $97,500 Hive MLS
- 2005-12-21 Sold (MLS) $94,500 Hive MLS
- 2005-10-28 Listed $98,500 Hive MLS
- 2005-10-06 Listed $94,500 Hive MLS
- 2005-08-08 Sold (MLS) $70,000 Hive MLS
- 2005-06-22 Listed $68,000 Hive MLS
- 2005-06-16 Sold (MLS) $65,900 Hive MLS
- 2005-06-09 Sold (MLS) $69,400 Hive MLS
- 2005-06-02 Sold (MLS) $65,300 Hive MLS
- 2005-05-17 Listed $65,900 Hive MLS
- 2005-04-29 Listed $69,400 Hive MLS
- 2004-09-07 Listing Removed — Hive MLS
- 2004-09-04 Listed $62,899 Hive MLS
- 2004-04-19 Listed $68,900 Hive MLS
- 2001-01-15 Sold (MLS) $56,500 Hive MLS
- 2000-06-08 Listed $59,900 Hive MLS
- 1999-06-24 Sold (MLS) $62,000 Hive MLS
- 1999-05-05 Listed $68,500 Hive MLS
Cash-flow waterfall
monthlySold comps — $/sqft
last 12 mo · ≤1 miLoading sold comps…