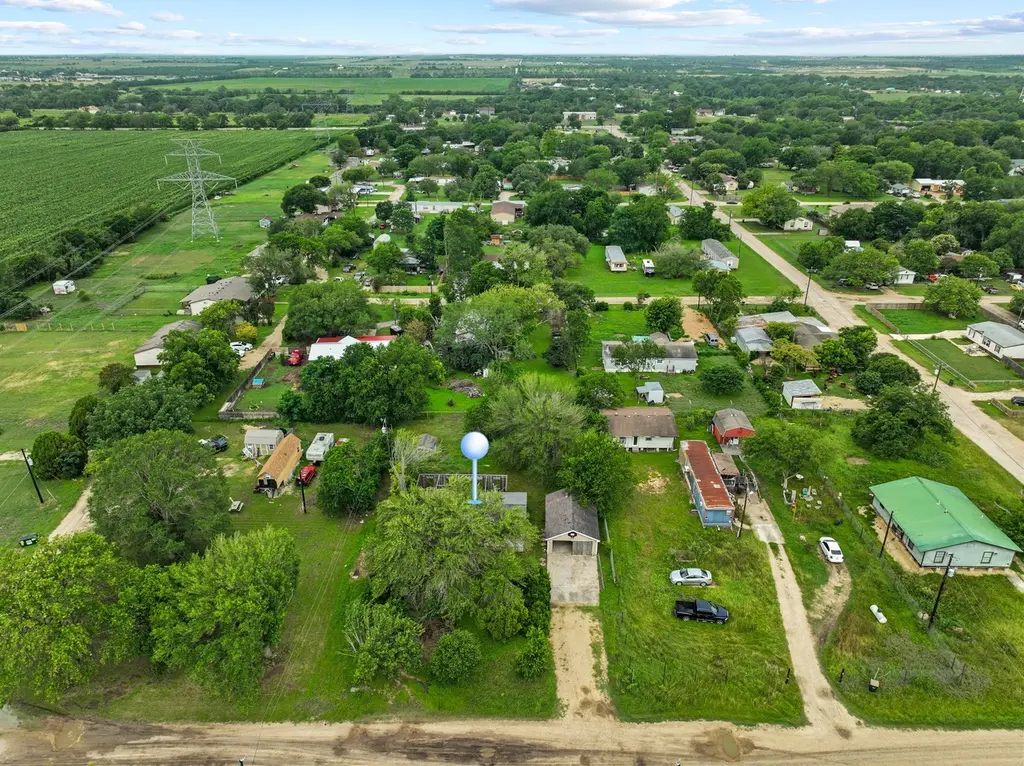
205 Skycrest Dr · Martindale, TX
Flood risk 1/10 · Minimal
- FEMA flood zone
- X (unshaded)
- Chance of flooding over 30 yrs
- 0.0%
- Est. flood insurance / yr
- $507 – $1,088
Fire risk 4/10 · Minor
- Est. fire insurance / yr
- $1,222 – $2,270
Heat risk 8/10 · Major
- Hot days now (above 108°F)
- 7 days/yr
- Hot days in 30 yrs
- 22 days/yr
Wind risk 8/10 · Major
- Chance of severe wind over 30 yrs
- 80.0%
Air-quality risk 1/10 · Minimal
- Unhealthy air days now
- 0 days/yr
- Unhealthy air days in 30 yrs
- 0 days/yr
Risk factors via First Street. Map © Google.
Why this score? — see what drove the B grade
The composite is a weighted blend of 9 inputs, each scored 0–100. Each bar is that input's sub-score; the figure is the points it added to the 100-point composite (weight × sub-score).
- Cash flow +30.0/30.0
- 1% rule +10.0/10.0
- DSCR +10.0/10.0
- ARV discount +7.5/15.0
- Appreciation +5.5/10.0
- Livability +3.5/5.0
- Rent growth +2.5/5.0
- Condition / age +2.5/5.0
- Schools +2.0/10.0
$99,000
🖨 Deal sheet 📄 Offer letter ✓ Due diligence
Listing remarks
Half acre lot with an existing detached 2-car garage, ready for a mobile home to be placed there. Original mobile home had a fire, but garage was not affected. Existing mobile home was built in 1994, could either be extensively remodeled or replaced. Priced at lot value, all utilities are present, new mobile home could be placed immediately!
Key facts
- Half acre lot
- 0.5 acre lot
- 2 garage spots
Tags
Property features AI
Finance
- Other: Lot size reported as 0.5 acres
- Financial info: Financial details not provided for investors
- HOA & community: No HOA or community information provided
Exterior
- Parking: Garage (2 covered spaces); Total parking for 5 vehicles
- Security: No security features reported
- Utilities: Electricity available; Public water; Septic tank sewer
- Home design: Single-story residence; Faces northeast; Foundation with pillar/post/pier
- Construction: Built per public records; Composition roof
- Exterior features: No exterior features reported; Property listed as tear down / value in land
Interior
- Kitchen: No kitchen appliance details provided
- Bedrooms: Two main-level bedrooms
- Flooring: Flooring details not provided
- Bathrooms: One full bathroom
- Heating & cooling: Heating and cooling details not provided
- Interior features: No special interior features reported
- Laundry & utility: No laundry or utility appliances listed
Neighborhood map
What this means for you Summary
Snapshot
- This is a 2-bed/1.0-bath manufactured listed at $99k.
Deal economics
- At list price, monthly cash flow is $937 ($11k/yr) — positive.
- The deal already cash-flows at list — no discount required.
- Meets the 1% rule at list price ($2k rent vs $99k).
Location & tenants
- Location reads 69/100 on livability (#397 in TX) — a middle-class / working-renter tenant base. Strengths: crime A+, cost of living A+, housing A+; Watch: schools F, amenities F, commute F.
- San Marcos CISD (rural): math 18% / reading 31% proficiency, ranked #731 of 826 in TX (top 88%) — low school quality limits family demand, transient renter base, plan for 1-2y turnover; 63% free/reduced lunch — lower-income household profile, screen leases tightly.
- Market conditions: 48 active listings in the ZIP; 2 comparable units currently listed for rent nearby; 529 units permitted in Caldwell County in 2024 (6 in 5+ unit buildings).
Forward outlook
- In year one you build about $2k of equity ($684 loan paydown + $975 appreciation (1.0% local appreciation)).
- Caldwell County population projected at +33% by 2050 — long-run rental-demand tailwind backs the buy-and-hold thesis.
- At projected returns (1.0% appreciation + 3.0% rent growth), your $28k cash investment doubles in ~3 years — after that, you're playing with house money.
Negotiation context
- Only 12 days on market — expect competitive offers; lowballing is unlikely to land.
Risks & watch-outs
- Climate carrying-cost: severe wind risk, 80% chance of damaging wind over 30y; extreme-heat days projected 7→22/yr by 2055 (HVAC capex compounding) — expect insurance premiums to compound above CPI over the hold.
Questions for the listing agent
- Is there a deadline driving the sale (1031 exchange, divorce, estate, relocation)? That informs how much negotiation room exists.
- Schools are F-rated, which usually means shorter tenancies and higher turnover. Who's the typical renter profile here, and what's been the actual vacancy rate?
- What's the average days-on-market for RENTAL listings here right now (not sales)? A rising rental-DOM trend means longer vacancies and softer asking-rent achievability than the comps imply.
- What's the recent tenant-quality profile in this submarket — average credit score on applications, eviction rate, late-payment / NSF rate, and stable-employment percentage? A property-management company in the area should have these aggregated.
- How much new for-sale + rental construction is in the pipeline within 1–3 miles? Heavy new supply typically softens prices + rents 12–24 months out; constrained supply supports both.
Investment metrics
- 1% rule
- 2.03% ✓
- Cap rate
- 17.65%
- Cash-on-cash
- 40.55%
- DSCR
- 2.80
- GRM
- 4.1
CMA / ARV
No comps found within radius.
Projected returns pro-forma
0.99% appreciation · 3.0% rent growth · sell at horizon
- IRR
- 43.1%
- Equity multiple
- 3.22×
- Total profit
- $61,442
- Equity at exit
- $33,720
- IRR
- 45.0%
- Equity multiple
- 6.37×
- Total profit
- $148,854
- Equity at exit
- $44,751
Cash invested: $27,720 (down + closing). Projections, not guarantees.
Landlord ↔ Tenant lean methodology
- Overall (STATE)
- 87 Strongly Landlord-Friendly
- State Texas
- 87 Strongly Landlord-Friendly · R+5
- County
- — inherits STATE
- City
- — inherits STATE
ZIP-level market 78655
- Home prices YoY
- 0.5%
- Active inventory
- 48
- Price-to-rent
- 4.1×
Monthly cashflow live
- Estimated rent
- $2,007 medium interval (Pro) →
- Mortgage (P&I)
- −$519
- Tax from tax record
- −$89 /mo · $1,064/yr
- Insurance
- −$41
- HOA
- −$0
- Vacancy / Maint / Mgmt
- −$422
- Net cashflow
- $937
Break-even live
UW: 25.0% down · 7.5% · 30yr · 1.5% tax · 5.0% vac · 8.0% maint · 8.0% mgmt
Financing live
Cash to close
- Down payment
- $24,750
- Closing costs
- $2,970
- Reserves months
- —
- Total cash needed
- —
Loan-product check · same deal, 3 products live
Conventional
25% down · 7.5% · 30yr
- Down + closing
- —
- Monthly P&I
- —
- Monthly cashflow
- —
- DSCR
- —
- Eligible?
- —
Personal DTI + credit; lowest rate.
DSCR
20% down · 8.5% · 30yr
- Down + closing
- —
- Monthly P&I
- —
- Monthly cashflow
- —
- DSCR
- —
- Eligible?
- —
No personal income docs; deal must DSCR.
Hard money
10% down · 12.0% · 12mo
- Down + closing
- —
- Monthly P&I
- —
- Monthly cashflow
- —
- DSCR
- —
- Eligible?
- —
Short-term bridge; refi at stabilization.
Rent comps 2 comps
| Address | Beds | Baths | Sqft | Rent | $/sqft | DOM | Units | Dist |
|---|---|---|---|---|---|---|---|---|
| 121 Butler Ln Martindale, TX | 2.0 | 2.0 | 1138 | $1,850 | $1.63 | 24d | 1 | 0.56mi |
| 426 Spring River Dr Martindale, TX | 3.0 | 2.0 | 1266 | $2,250 | $1.78 | 24d | 1 | 0.96mi |
Listing history 9 events
-
2026-06-18days on market $99,000 Active 12 DOM
-
2026-06-17days on market $99,000 Active 11 DOM
-
2026-06-16days on market $99,000 Active 10 DOM
-
2026-06-15days on market $99,000 Active 9 DOM
-
2026-06-13days on market $99,000 Active 7 DOM
-
2026-06-09days on market $99,000 Active 3 DOM
-
2026-06-08days on market $99,000 Active 2 DOM
-
2026-06-07remarks 343-char remark
-
2026-06-07$99,000 Active 1 DOM
ⓘ Source: listings_history table (triggers on properties + properties_extension) + one-shot
backfill from property_details.listing_events for pre-trigger history.
Tax reassessment forecast TX · Resets to sale price
- Current annual tax
- $1,064 · $89/mo
- Projected year-2 tax
- $1,812 · $151/mo
- Expected delta
- +$748/yr (+$62/mo · 70.3%)
ⓘ Screening estimate from a state-policy table — verify with the county assessor before closing.
Climate risk First Street
- Flood 1/10 Low FEMA zone X (unshaded) · 0% chance over 30 yrs
- Wildfire 4/10 Moderate
- Heat 8/10 Severe 7 d/yr ≥108°F today · 22 d/yr by 30 yrs out
- Wind 8/10 Severe 80% chance of damaging wind over 30 yrs
- Air quality 1/10 Low 0 unhealthy d/yr today · 0 by 30 yrs out
Nearby sold comps map
Loading sold comps map…
Walkable amenities ~0.75 mi
Loading nearby amenities…
Taxation est. · year 1
- Rental income
- $24,086
- − Mortgage interest
- −$5,546
- − Property taxes
- −$1,064
- − Insurance
- −$495
- − Repairs & maintenance
- −$1,927
- − Management
- −$1,927
- − Depreciation
- −$2,880
- Taxable income
- $10,248
- Est. tax owed @ 24.0%
- −$2,460
- After-tax cash flow
- $8,780/yr
For passive investors: Depreciation is non-cash, so a rental often shows a tax loss while cash-flowing — sheltering income. Rental losses are passive: they offset passive income freely, and up to $25,000/yr can offset ordinary (W-2) income if you actively participate and your MAGI is under $100k (phasing out to $0 by $150k); unused losses carry forward. On sale, claimed depreciation is recaptured at up to 25%, and gains may owe capital-gains tax (a 1031 exchange can defer both). Figures are a year-1 estimate at your 24.0% rate — not tax advice; consult a CPA.
Schools (NCES district)
- District
- San Marcos CISD
- NCES district ID
- 4838970
- Math proficiency
- 18% ▼ -16.00%
- Reading proficiency
- 31% ▼ -8.00%
- Median HH income
- $34,538
- Composite
- 20.11/100
- National rank
- #8644
- State rank
- #731 of 826 in TX
Livability — Martindale
- Score
- 69/100
- State rank
- #397
- US rank
- #8261
Category grades
Schools grade is shown separately in the Schools card above.
Census & demographics
- Population (ZIP)
- 3,687
Population outlook (Caldwell County) Hauer SSP2
- Today (2025)
- 46,557 people
- By 2030
- 49,673 · +6.7%
- By 2040
- 55,827 · +19.9%
- By 2050
- 61,832 · +32.8%
- By 2075
- 77,212 · +65.8%
- By 2100
- 89,225 · +91.6%
Race, ethnicity, and origin ACS 2023
- Neighborhood character
- Majority Hispanic (61%)
- Race & ethnicity
- Hispanic / Latino 61% Two or more races 40% White 33% Black 1%
- Hispanic origin (detail)
- Mexican 60%
- Common ancestry
- Lithuanian 6% Italian 1% Serbian 1%
- Foreign-born
- 16% · Canada, China
- Languages at home
- 66% English-only · Spanish 32% Russian/Polish/Slavic 1% Chinese 1%
Political lean MEDSL · Caldwell
- 2024 margin
- R (+14.4) · D 42.2% · R 56.6% · Other 1.2%
- 2008→2024 swing
- -8.4pp toward R · 2008: -6.0pp · 2024: -14.4pp
- All cycles
- 2024: R+14.4 2020: R+9.1 2016: R+15.8 2012: R+11.1 2008: R+6.0
Not yet ingested
- Civics
- —
Market trends
- HPI YoY
- ▲ 0.99%
- Current HPI
- 221.4376
- Rent YoY
- —
- Metro
- —
- State GDP YoY
- ▲ 3.95%
- F500 in state
- 110
Industry mix (Fortune 500 HQ in TX)
| Industry | F500 HQs | Revenue |
|---|---|---|
| Energy | 16 | $1,198B |
|
||
| Technology | 5 | $198B |
|
||
| Engineering / Construction | 4 | $72B |
|
||
| Energy Services | 3 | $60B |
|
||
| Utilities | 3 | $41B |
|
||
| Healthcare | 2 | $330B |
|
||
Price history
3 events — show timeline
- 2026-06-06 Listed $99,000 Unlock MLS
- 2020-09-29 Sold (Public Records) — Public Records
- 2000-01-12 Sold (Public Records) — Public Records
Property tax history
-0.8%/yrLatest (2025): $1,064 · +0.0% YoY. Source: county tax records.
Cash-flow waterfall
monthlySold comps — $/sqft
last 12 mo · ≤1 miLoading sold comps…