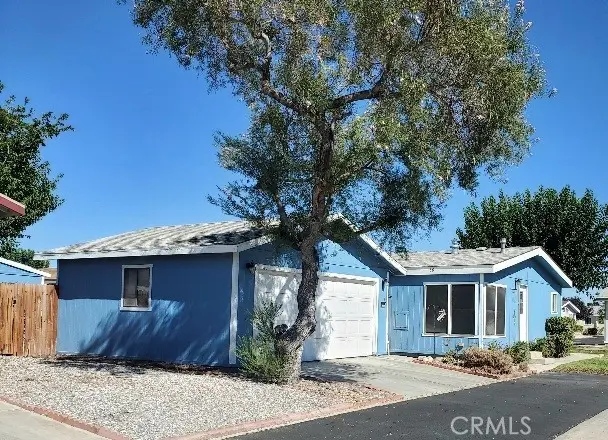
21621 Sandia Rd #59 · Apple Valley, CA
Flood risk 4/10 · Minor
- FEMA flood zone
- D
- Chance of flooding over 30 yrs
- 0.2%
- Est. flood insurance / yr
- $544 – $1,084
Fire risk 6/10 · Moderate
- Est. fire insurance / yr
- $659 – $1,223
Heat risk 7/10 · Major
- Hot days now (above 99°F)
- 5 days/yr
- Hot days in 30 yrs
- 14 days/yr
Wind risk 1/10 · Minimal
- Chance of severe wind over 30 yrs
- —
Air-quality risk 10/10 · Severe
- Unhealthy air days now
- 25 days/yr
- Unhealthy air days in 30 yrs
- 30 days/yr
Risk factors via First Street. Map © Google.
Why this score? — see what drove the B- grade
The composite is a weighted blend of 9 inputs, each scored 0–100. Each bar is that input's sub-score; the figure is the points it added to the 100-point composite (weight × sub-score).
- Cash flow +30.0/30.0
- 1% rule +10.0/10.0
- DSCR +10.0/10.0
- ARV discount +7.2/15.0
- Rent growth +3.6/5.0
- Schools +3.1/10.0
- Livability +3.1/5.0
- Condition / age +2.5/5.0
- Appreciation +0.0/10.0
$119,900
🖨 Deal sheet 📄 Offer letter ✓ Due diligence
Listing remarks MLS
ON HOLD FOR HEALTH REASONS. FANTASTIC PRICE for larger 1512 sq ft home in SENIOR 55+ gated community of MOUNTAIN VIEW VILLAS. This home is on a low maintenance lot with HUGE ADDITIONAL SHED along with 2 car garage. FULL NEW HVAC system installed 6 months ago. Updated kitchen cabinets and plenty of counter space to work with. Master suite is away from other bedrooms. Custom fireplace in open living room will be cozy for colder weather coming. The greenbelt gives you the greenery without the maintenance. All rooms are good size with formal dining and eat in area in kitchen. Washer, dryer, fridge will stay with the right offer. Seller has purchased another out of state and is willing to offer decorating concessions. The rear yard has covered patio and very easy to take care of. There is off leash doggy park and a calendar of social activities. One of the best senior living parks in the high desert. Shopping close by and Jess Ranch Market Place just a few minutes away. Don't miss this great buy! We have financing with as little as 5% down.
Key facts
- Gated community
- Custom fireplace
- Covered patio
Tags
Neighborhood map
What this means for you Summary
Snapshot
- This is a 3-bed/2.0-bath manufactured listed at $120k.
Deal economics
- At list price, monthly cash flow is $1k ($12k/yr) — positive.
- The deal already cash-flows at list — no discount required.
- Meets the 1% rule at list price ($2k rent vs $120k).
- Recommended offer: $106k (12.0% below list) — sets the bar for market timing.
- Cap rate 16.5% vs local median 3.5% in Apple Valley — top-decile yield for the area; either an underpriced asset or a hidden risk that comps aren't pricing in. Stress-test before assuming the spread holds.
Location & tenants
- Location reads 61/100 on livability (#532 in CA) — a middle-class / working-renter tenant base. Strengths: housing A+, commute B+; Watch: employment D+, schools F, crime D-.
- Apple Valley Unified (suburban): math 25% / reading 40% proficiency, ranked #955 of 1,400 in CA (top 68%) — families likely to look elsewhere, expect single-tenant / working-renter base with shorter leases; 60% free/reduced lunch — lower-income household profile, screen leases tightly.
- Market conditions: Rents rising fast (+4.3%/yr); 417 active listings in the ZIP; 7 comparable units currently listed for rent nearby; rentals lingering (median 44d on market — plan ~5-8 weeks vacancy on turnover, expect pricing pressure); 57% of comp listings sitting > 30 days — soft ceiling on asking rent; 5,458 units permitted in San Bernardino County in 2024 (1,500 in 5+ unit buildings).
- This rent runs 40% of the median local income ($67k/yr) — at the standard rent-burdened threshold; future hikes will face affordability resistance.
Forward outlook
- Local home prices are declining (-3.0%/yr); year-one equity from $829 of loan paydown is wiped out by about $4k of value loss. Plan a longer hold.
- San Bernardino County population projected at +15% by 2050 — modest demand growth; plan on rents tracking national, not racing it.
- At projected returns (-3.0% appreciation + 4.3% rent growth), your $34k cash investment doubles in ~4 years — after that, you're playing with house money.
Negotiation context
- It's been on market 271 days — a 12% lower offer ($106k) is reasonable based on typical stale-listing flexibility.
- 2 sale attempts with the ask held roughly flat each time — persistent listings suggest the price (not the market) is what's stuck; bring a comps-based counter.
Risks & watch-outs
- Climate carrying-cost: major wildfire risk; extreme-heat days projected 5→14/yr by 2055 (HVAC capex compounding) — expect insurance premiums to compound above CPI over the hold.
Questions for the listing agent
- It's been on market 271 days. Have you received any prior offers? Is the seller open to a 12% concession, seller financing, or rate buy-down credit?
- Why hasn't it sold? Are there any deal-killer items the seller is aware of (foundation, flood, title, zoning, code violations)?
- Is there a deadline driving the sale (1031 exchange, divorce, estate, relocation)? That informs how much negotiation room exists.
- Schools are F-rated, which usually means shorter tenancies and higher turnover. Who's the typical renter profile here, and what's been the actual vacancy rate?
- Crime grade is D in this area — have there been break-ins, vandalism, or insurance claims at this property in the last 3 years? What carrier currently insures it and at what premium?
- What's the average days-on-market for RENTAL listings here right now (not sales)? A rising rental-DOM trend means longer vacancies and softer asking-rent achievability than the comps imply.
- What's the recent tenant-quality profile in this submarket — average credit score on applications, eviction rate, late-payment / NSF rate, and stable-employment percentage? A property-management company in the area should have these aggregated.
- How much new for-sale + rental construction is in the pipeline within 1–3 miles? Heavy new supply typically softens prices + rents 12–24 months out; constrained supply supports both.
Investment metrics
- 1% rule
- 1.83% ✓
- Cap rate
- 16.46%
- Cash-on-cash
- 36.31%
- DSCR
- 2.62
- GRM
- 4.5
CMA / ARV
- ARV (median comp)
- $119,210
- List price
- $119,900
- Delta
- 0.58%
- Verdict
- FAIR
- Comps
- 13 within 1.0 mi
Show comp detail 12 sales within ~0.75 mi
| Address | Dist | Beds/Ba | Sqft | Sold | Price | $/sf | Match |
|---|---|---|---|---|---|---|---|
| 21621 Sandia Rd #57 | 0.00mi | 3/2.0 | 1,568 (+4%) | 1mo | $112,000 | $71 | 93 |
| 21621 Sandia #83 | 0.00mi | 3/2.0 | 1,456 (-4%) | 3mo | $100,000 | $69 | 91 |
| 21621 Sandia Rd #39 | 0.00mi | 3/2.0 | 1,560 (+3%) | 9mo | $105,000 | $67 | 87 |
| 21621 Sandia Rd #10 | 0.00mi | 3/2.0 | 1,620 (+7%) | 8mo | $160,000 | $99 | 81 |
| 21621 Sandia Rd #50 | 0.00mi | 3/2.0 | 1,440 (-5%) | 14mo | $135,000 | $94 | 80 |
| 21621 Sandia Rd #105 | 0.00mi | 2/2.0 (-1) | 1,440 (-5%) | 12mo | $144,900 | $101 | 77 |
| 21621 Sandia Rd #163 | 0.00mi | 3/2.0 | 1,386 (-8%) | 14mo | $150,000 | $108 | 75 |
| 21621 Sandia Rd #127 | 0.00mi | 3/2.0 | 1,300 (-14%) | 4mo | $155,000 | $119 | 74 |
| 21621 Sandia Rd #95 | 0.00mi | 3/2.0 | 1,300 (-14%) | 6mo | $139,000 | $107 | 72 |
| 21621 Sandia Rd #92 | 0.00mi | 3/2.0 | 1,344 (-11%) | 14mo | $119,000 | $89 | 70 |
| 21621 Sandia Rd #32 | 0.00mi | 3/2.0 | 1,296 (-14%) | 10mo | $105,000 | $81 | 68 |
| 21939 Del Oro Rd | 0.60mi | 4/2.0 (+1) | 1,584 (+5%) | 14mo | $350,000 | $221 | 48 |
Match score weights: distance 35% · size 25% · config 20% · recency 20%. Top-matched comps best support the ARV.
Projected returns pro-forma
-3.0% appreciation · 4.3% rent growth · sell at horizon
- IRR
- 33.4%
- Equity multiple
- 2.43×
- Total profit
- $48,144
- Equity at exit
- $17,877
- IRR
- 41.0%
- Equity multiple
- 5.09×
- Total profit
- $137,353
- Equity at exit
- $10,367
Cash invested: $33,572 (down + closing). Projections, not guarantees.
Landlord ↔ Tenant lean methodology
- Overall (STATE)
- 18 Strongly Tenant-Friendly
- State California
- 18 Strongly Tenant-Friendly · D+13
- County
- — inherits STATE
- City
- — inherits STATE
ZIP-level market 92308
- Home prices YoY
- -28.8%
- Rents YoY
- 4.3%
- Active inventory
- 417
- Price-to-rent
- 4.5×
Monthly cashflow live
- Estimated rent
- $2,196 high interval (Pro) →
- Mortgage (P&I)
- −$629
- Tax from tax record
- −$40 /mo · $484/yr
- Insurance
- −$50
- HOA
- −$0
- Vacancy / Maint / Mgmt
- −$461
- Net cashflow
- $1,016
Break-even live
UW: 25.0% down · 7.5% · 30yr · 1.5% tax · 5.0% vac · 8.0% maint · 8.0% mgmt
Financing live
Cash to close
- Down payment
- $29,975
- Closing costs
- $3,597
- Reserves months
- —
- Total cash needed
- —
Loan-product check · same deal, 3 products live
Conventional
25% down · 7.5% · 30yr
- Down + closing
- —
- Monthly P&I
- —
- Monthly cashflow
- —
- DSCR
- —
- Eligible?
- —
Personal DTI + credit; lowest rate.
DSCR
20% down · 8.5% · 30yr
- Down + closing
- —
- Monthly P&I
- —
- Monthly cashflow
- —
- DSCR
- —
- Eligible?
- —
No personal income docs; deal must DSCR.
Hard money
10% down · 12.0% · 12mo
- Down + closing
- —
- Monthly P&I
- —
- Monthly cashflow
- —
- DSCR
- —
- Eligible?
- —
Short-term bridge; refi at stabilization.
Rent comps 7 comps
| Address | Beds | Baths | Sqft | Rent | $/sqft | DOM | Units | Dist |
|---|---|---|---|---|---|---|---|---|
| 11255 Mohawk Rd Apple Valley, CA | 2.0 | 2.0 | 1147 | $1,950 | $1.70 | 44d | 1 | 0.63mi |
| 11515 Chimayo Rd Apple Valley, CA | 3.0 | 2.0 | 1471 | $2,250 | $1.53 | 44d | 1 | 0.74mi |
| 12406 Pawnee Rd Apple Valley, CA | 3.0 | 1.5 | 1488 | $2,200 | $1.48 | 17d | 1 | 1.03mi |
| 11045 Kiowa Rd Apple Valley, CA | 2.0 | 2.0 | 1147 | $1,825 | $1.59 | 24d | 1 | 1.14mi |
| 12401 Tesuque Rd Apple Valley, CA | 3.0 | 2.0 | 1506 | $2,245 | $1.49 | 44d | 1 | 1.40mi |
| 21181 Balsa St Apple Valley, CA | 3.0 | 2.0 | 1080 | $2,500 | $2.31 | 44d | 1 | 1.42mi |
| 22544 Sioux Rd Unit 31 Apple Valley, CA | 3.0 | 2.0 | 1236 | $1,795 | $1.45 | 20d | 1 | 1.48mi |
Listing history 3 events
-
2026-03-08status Active 1051-char remark
Show marketing remark (1051 chars)
ON HOLD FOR HEALTH REASONS. FANTASTIC PRICE for larger 1512 sq ft home in SENIOR 55+ gated community of MOUNTAIN VIEW VILLAS. This home is on a low maintenance lot with HUGE ADDITIONAL SHED along with 2 car garage. FULL NEW HVAC system installed 6 months ago. Updated kitchen cabinets and plenty of counter space to work with. Master suite is away from other bedrooms. Custom fireplace in open living room will be cozy for colder weather coming. The greenbelt gives you the greenery without the maintenance. All rooms are good size with formal dining and eat in area in kitchen. Washer, dryer, fridge will stay with the right offer. Seller has purchased another out of state and is willing to offer decorating concessions. The rear yard has covered patio and very easy to take care of. There is off leash doggy park and a calendar of social activities. One of the best senior living parks in the high desert. Shopping close by and Jess Ranch Market Place just a few minutes away. Don't miss this great buy! We have financing with as little as 5% down.
-
2025-11-22price $119,900 1051-char remark
Show marketing remark (1051 chars)
ON HOLD FOR HEALTH REASONS. FANTASTIC PRICE for larger 1512 sq ft home in SENIOR 55+ gated community of MOUNTAIN VIEW VILLAS. This home is on a low maintenance lot with HUGE ADDITIONAL SHED along with 2 car garage. FULL NEW HVAC system installed 6 months ago. Updated kitchen cabinets and plenty of counter space to work with. Master suite is away from other bedrooms. Custom fireplace in open living room will be cozy for colder weather coming. The greenbelt gives you the greenery without the maintenance. All rooms are good size with formal dining and eat in area in kitchen. Washer, dryer, fridge will stay with the right offer. Seller has purchased another out of state and is willing to offer decorating concessions. The rear yard has covered patio and very easy to take care of. There is off leash doggy park and a calendar of social activities. One of the best senior living parks in the high desert. Shopping close by and Jess Ranch Market Place just a few minutes away. Don't miss this great buy! We have financing with as little as 5% down.
-
2025-08-27$125,000 Active 1051-char remark
Show marketing remark (1051 chars)
ON HOLD FOR HEALTH REASONS. FANTASTIC PRICE for larger 1512 sq ft home in SENIOR 55+ gated community of MOUNTAIN VIEW VILLAS. This home is on a low maintenance lot with HUGE ADDITIONAL SHED along with 2 car garage. FULL NEW HVAC system installed 6 months ago. Updated kitchen cabinets and plenty of counter space to work with. Master suite is away from other bedrooms. Custom fireplace in open living room will be cozy for colder weather coming. The greenbelt gives you the greenery without the maintenance. All rooms are good size with formal dining and eat in area in kitchen. Washer, dryer, fridge will stay with the right offer. Seller has purchased another out of state and is willing to offer decorating concessions. The rear yard has covered patio and very easy to take care of. There is off leash doggy park and a calendar of social activities. One of the best senior living parks in the high desert. Shopping close by and Jess Ranch Market Place just a few minutes away. Don't miss this great buy! We have financing with as little as 5% down.
ⓘ Source: listings_history table (triggers on properties + properties_extension) + one-shot
backfill from property_details.listing_events for pre-trigger history.
Tax reassessment forecast CA · Resets to sale price
- Current annual tax
- $484 · $40/mo
- Projected year-2 tax
- $911 · $76/mo
- Expected delta
- +$428/yr (+$36/mo · 88.4%)
ⓘ Screening estimate from a state-policy table — verify with the county assessor before closing.
Climate risk First Street
- Flood 4/10 Moderate FEMA zone D · 20% chance over 30 yrs
- Wildfire 6/10 Major
- Heat 7/10 Severe 5 d/yr ≥99°F today · 14 d/yr by 30 yrs out
- Wind 1/10 Low
- Air quality 10/10 Extreme 25 unhealthy d/yr today · 30 by 30 yrs out
Nearby sold comps map
Loading sold comps map…
Walkable amenities ~0.75 mi
Loading nearby amenities…
Taxation est. · year 1
- Rental income
- $26,352
- − Mortgage interest
- −$6,716
- − Property taxes
- −$484
- − Insurance
- −$600
- − Repairs & maintenance
- −$2,108
- − Management
- −$2,108
- − Depreciation
- −$3,488
- Taxable income
- $10,848
- Est. tax owed @ 24.0%
- −$2,604
- After-tax cash flow
- $9,586/yr
For passive investors: Depreciation is non-cash, so a rental often shows a tax loss while cash-flowing — sheltering income. Rental losses are passive: they offset passive income freely, and up to $25,000/yr can offset ordinary (W-2) income if you actively participate and your MAGI is under $100k (phasing out to $0 by $150k); unused losses carry forward. On sale, claimed depreciation is recaptured at up to 25%, and gains may owe capital-gains tax (a 1031 exchange can defer both). Figures are a year-1 estimate at your 24.0% rate — not tax advice; consult a CPA.
Schools (NCES district)
- District
- Apple Valley Unified
- NCES district ID
- 0600017
- Math proficiency
- 25% ▬ 0.00%
- Reading proficiency
- 40% ▬ 0.00%
- Median HH income
- $49,264
- Composite
- 30.91/100
- National rank
- #11351
- State rank
- #955 of 1400 in CA
Livability — Apple Valley
- Score
- 61/100
- State rank
- #532
- US rank
- #17800
Category grades
Schools grade is shown separately in the Schools card above.
Census & demographics
- Census place
- Apple Valley, CA
- County
- San Bernardino County · 2,030,291 people
- City population
- 83,889
- Metro
- Riverside-San Bernardino-Ontario, CA
- Population (ZIP)
- 42,709
- Household income
- $66,568
- Rent vs Own
- Severe rent burden
- 1389.0
Population outlook (San Bernardino County) Hauer SSP2
- Today (2025)
- 2,300,329 people
- By 2030
- 2,378,907 · +3.4%
- By 2040
- 2,523,137 · +9.7%
- By 2050
- 2,642,388 · +14.9%
- By 2075
- 2,880,769 · +25.2%
- By 2100
- 2,909,436 · +26.5%
Race, ethnicity, and origin ACS 2023
- Neighborhood character
- Diverse neighborhood (Simpson 0.65)
- Race & ethnicity
- White 44% Hispanic / Latino 38% Two or more races 19% Black 9% Asian 3%
- Hispanic origin (detail)
- Mexican 34%
- Common ancestry
- Italian 1% Iranian 1% Slovak 1%
- Foreign-born
- 11% · Canada, South Korea
- Languages at home
- 75% English-only · Spanish 20% Tagalog/Filipino 1% Other Asian/Pacific 1%
Political lean MEDSL · San Bernardino
- 2024 margin
- Toss-up / Even · D 47.5% · R 49.7% · Other 2.8%
- 2008→2024 swing
- -8.5pp toward R · 2008: 6.3pp · 2024: -2.1pp
- All cycles
- 2024: R+2.1 2020: D+10.7 2016: D+9.8 2012: D+5.4 2008: D+6.3
Not yet ingested
- Civics
- —
Market trends
- HPI YoY
- ▼ -145.60%
- Current HPI
- 359.2305
- Rent YoY
- ▲ 4.30%
- Metro
- Riverside-San Bernardino-Ontario, CA
- State GDP YoY
- ▲ 3.21%
- F500 in state
- 116
Industry mix (Fortune 500 HQ in CA)
| Industry | F500 HQs | Revenue |
|---|---|---|
| Technology | 27 | $1,492B |
|
||
| Financial Services | 3 | $174B |
|
||
| Retail | 3 | $44B |
|
||
| Insurance | 3 | $26B |
|
||
| Media / Entertainment | 2 | $115B |
|
||
| Pharmaceuticals / Biotech | 2 | $62B |
|
||
Price history
-4.1% since first listed3 events — show timeline
- 2026-03-08 Relisted — CRMLS
- 2025-11-22 Price Changed $119,900 CRMLS
- 2025-08-27 Listed $125,000 CRMLS
Property tax history
-1.6%/yrLatest (2025): $484 · -34.2% YoY. Source: county tax records.
Cash-flow waterfall
monthlySold comps — $/sqft
last 12 mo · ≤1 miLoading sold comps…