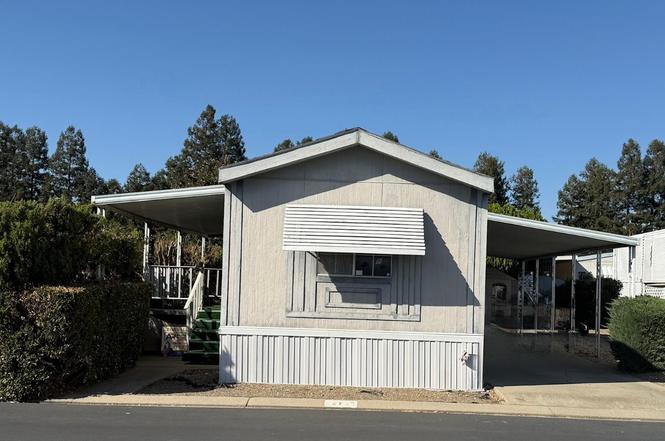
2500 N Highway 59 #270 · Merced, CA
Flood risk 5/10 · Moderate
- FEMA flood zone
- AO
- Chance of flooding over 30 yrs
- 0.64%
- Est. flood insurance / yr
- $848 – $2,087
Fire risk 1/10 · Minimal
- Est. fire insurance / yr
- $659 – $1,223
Heat risk 7/10 · Major
- Hot days now (above 105°F)
- 7 days/yr
- Hot days in 30 yrs
- 16 days/yr
Wind risk 1/10 · Minimal
- Chance of severe wind over 30 yrs
- —
Air-quality risk 10/10 · Severe
- Unhealthy air days now
- 34 days/yr
- Unhealthy air days in 30 yrs
- 35 days/yr
Risk factors via First Street. Map © Google.
Why this score? — see what drove the B- grade
The composite is a weighted blend of 9 inputs, each scored 0–100. Each bar is that input's sub-score; the figure is the points it added to the 100-point composite (weight × sub-score).
- Cash flow +30.0/30.0
- 1% rule +10.0/10.0
- DSCR +10.0/10.0
- ARV discount +7.5/15.0
- Livability +3.7/5.0
- Schools +2.8/10.0
- Condition / age +2.5/5.0
- Rent growth +2.3/5.0
- Appreciation +0.0/10.0
$79,000
🖨 Deal sheet (PDF) 📄 Offer letter ✓ Due diligence
Listing remarks MLS
This cozy and well-maintained 2-bedroom, 2-bath home is perfect for a couple looking to retire and enjoy peaceful living. Located in a friendly park with easy access to shopping and freeways, convenience is right at your doorstep. The home is move-in ready, offering comfort and simplicity. Seller is motivated and ready to make a dealdon't miss this opportunity!
Key facts
- 2,774 sq ft lot
- Community pool
- Built 1993
Property features AI
Finance
- Other: Living area and lot size source: seller; Parcel number available
- Financial info: Monthly land lease: $600 (includes sewer, trash, water)
- HOA & community: Senior community; Park name: Holiday Mobil/Senior Community; Community features include valley setting
Exterior
- Parking: Located in Holiday Mobil/Senior Community park
- Utilities: Public sewer; District/public water
- Home design: Single-story mobile home (13' x 60'); Mobile home remains on property
- Construction: Year built (per seller)
- Exterior features: Community pool; Back yard
Interior
- Bathrooms: 2 full bathrooms
- Heating & cooling: Central furnace heating
- Interior features: Living room entry
- Laundry & utility: Indoor laundry
Neighborhood map
What this means for you Summary
Snapshot
- This is a 2-bed/2.0-bath manufactured listed at $79k.
Deal economics
- At list price, monthly cash flow is $550 ($7k/yr) — positive.
- The deal already cash-flows at list — no discount required.
- Meets the 1% rule at list price ($2k rent vs $79k).
- Recommended offer: $70k (12.0% below list) — sets the bar for market timing.
- Cap rate 16.5% vs local median 3.4% in Merced — top-decile yield for the area; either an underpriced asset or a hidden risk that comps aren't pricing in. Stress-test before assuming the spread holds.
Location & tenants
- Location reads 73/100 on livability (#153 in CA) — a middle-class / working-renter tenant base. Strengths: amenities A+, commute A+, housing A+; Watch: schools D, employment D, crime F.
- Merced Union High (urban): math 20% / reading 46% proficiency, ranked #301 of 517 in CA (top 58%) — families likely to look elsewhere, expect single-tenant / working-renter base with shorter leases.
- Market conditions: Rents soft (-0.8%/yr); 172 active listings in the ZIP; 26 comparable units currently listed for rent nearby; rentals at typical pace (median 14d on market — plan ~3-4 weeks tenant-placement turnaround); 459 units permitted in Merced County in 2024 (0 in 5+ unit buildings).
Forward outlook
- Local home prices are declining (-3.0%/yr); year-one equity from $546 of loan paydown is wiped out by about $2k of value loss. Plan a longer hold.
- Merced County population projected at +12% by 2050 — modest demand growth; plan on rents tracking national, not racing it.
- At projected returns (-3.0% appreciation + 0.0% rent growth), your $22k cash investment doubles in ~5 years — after that, you're playing with house money.
Negotiation context
- It's been on market 268 days — a 12% lower offer ($70k) is reasonable based on typical stale-listing flexibility.
- 7 sale attempts since 4y ago with the ask held roughly flat each time — persistent listings suggest the price (not the market) is what's stuck; bring a comps-based counter.
- Current owner paid $30k; list at $79k implies a 163% gain — meaningful room to come down on a strong offer.
Risks & watch-outs
- Watch-outs: flood insurance adds $122/mo.
- Climate carrying-cost: in FEMA flood zone AO (mandatory federal flood insurance); extreme-heat days projected 7→16/yr by 2055 (HVAC capex compounding) — expect insurance premiums to compound above CPI over the hold.
Questions for the listing agent
- It's been on market 268 days. Have you received any prior offers? Is the seller open to a 12% concession, seller financing, or rate buy-down credit?
- What's the actual annual flood-insurance premium (NFIP or private), and is the property in a SFHA with mandatory coverage?
- Why hasn't it sold? Are there any deal-killer items the seller is aware of (foundation, flood, title, zoning, code violations)?
- Is there a deadline driving the sale (1031 exchange, divorce, estate, relocation)? That informs how much negotiation room exists.
- Schools are D-rated, which usually means shorter tenancies and higher turnover. Who's the typical renter profile here, and what's been the actual vacancy rate?
- Crime grade is F in this area — have there been break-ins, vandalism, or insurance claims at this property in the last 3 years? What carrier currently insures it and at what premium?
- What's the average days-on-market for RENTAL listings here right now (not sales)? A rising rental-DOM trend means longer vacancies and softer asking-rent achievability than the comps imply.
- What's the recent tenant-quality profile in this submarket — average credit score on applications, eviction rate, late-payment / NSF rate, and stable-employment percentage? A property-management company in the area should have these aggregated.
- How much new for-sale + rental construction is in the pipeline within 1–3 miles? Heavy new supply typically softens prices + rents 12–24 months out; constrained supply supports both.
Investment metrics
- 1% rule
- 1.95% ✓
- Cap rate
- 16.51%
- Cash-on-cash
- 36.50%
- DSCR
- 2.62
- GRM
- 4.3
CMA / ARV
No comps found within radius.
Projected returns pro-forma
-3.0% appreciation · 0.0% rent growth · sell at horizon
- IRR
- 20.6%
- Equity multiple
- 1.81×
- Total profit
- $17,836
- Equity at exit
- $11,779
- IRR
- 26.5%
- Equity multiple
- 2.97×
- Total profit
- $43,605
- Equity at exit
- $6,830
Cash invested: $22,120 (down + closing). Projections, not guarantees.
Landlord ↔ Tenant lean methodology
- Overall (STATE)
- 18 Strongly Tenant-Friendly
- State California
- 18 Strongly Tenant-Friendly · D+13
- County
- — inherits STATE
- City
- — inherits STATE
ZIP-level market 95348
- Rents YoY
- -0.8%
- Active inventory
- 172
- Price-to-rent
- 4.3×
Monthly cashflow live
- Estimated rent
- $1,543 high interval (Pro) →
- Mortgage (P&I)
- −$414
- Tax est. 1.5%
- −$99 /mo · $1,185/yr
- Insurance
- −$33
- Flood insurance flood zone
- −$122 /mo · $1,468/yr
- HOA
- −$0
- Vacancy / Maint / Mgmt
- −$324
- Net cashflow
- $550
Break-even live
Sensitivity live
| Price | -10% $605 | -5% $578 | +0% $550 | +5% $523 | +10% $496 |
|---|---|---|---|---|---|
| Rent | -10% $429 | -5% $490 | +0% $550 | +5% $611 | +10% $672 |
| Rate | -1.0pp $590 | -0.5pp $571 | base $550 | +0.5pp $530 | +1.0pp $509 |
UW: 25.0% down · 7.5% · 30yr · 1.5% tax · 5.0% vac · 8.0% maint · 8.0% mgmt
Financing live
Cash to close
- Down payment
- $19,750
- Closing costs
- $2,370
- Reserves months
- —
- Total cash needed
- —
Loan-product check · same deal, 3 products live
Conventional
25% down · 7.5% · 30yr
- Down + closing
- —
- Monthly P&I
- —
- Monthly cashflow
- —
- DSCR
- —
- Eligible?
- —
Personal DTI + credit; lowest rate.
DSCR
20% down · 8.5% · 30yr
- Down + closing
- —
- Monthly P&I
- —
- Monthly cashflow
- —
- DSCR
- —
- Eligible?
- —
No personal income docs; deal must DSCR.
Hard money
10% down · 12.0% · 12mo
- Down + closing
- —
- Monthly P&I
- —
- Monthly cashflow
- —
- DSCR
- —
- Eligible?
- —
Short-term bridge; refi at stabilization.
Rent comps 26 comps
| Address | Beds | Baths | Sqft | Rent | $/sqft | DOM | Units | Dist |
|---|---|---|---|---|---|---|---|---|
| 2908 Willowbrook Dr Unit 2962-28 Merced, CA | 2.0 | 2.0 | 1091 | $1,775 | $1.63 | 21d | 1 | 0.24mi |
| 1840 U St Unit 3 Merced, CA | 1.0 | 1.0 | 594 | $1,175 | $1.98 | 14d | 1 | 0.49mi |
| 1760 Conestoga Dr Apt B Merced, CA | 2.0 | 1.0 | 650 | $1,350 | $2.08 | 14d | 1 | 0.49mi |
| 1836 Cheyenne Dr Merced, CA | 3.0 | 2.0 | 1122 | $1,929 | $1.72 | 14d | 1 | 0.51mi |
| 1335 W 23rd St Merced, CA | 2.0 | 1.0 | 840 | $1,550 | $1.85 | 14d | 1 | 0.51mi |
| 1407 Madison Ct Merced, CA | 2.0 | 2.0 | 850 | $1,599 | $1.88 | 21d | 1 | 0.72mi |
| 3219 Denver Ave Unit 3221 Merced, CA | 3.0 | 2.0 | 1000 | $1,900 | $1.90 | 14d | 1 | 0.78mi |
| 3270 Denver Ave Unit 3 Merced, CA | 1.0 | 1.0 | 700 | $1,000 | $1.43 | 14d | 1 | 0.83mi |
| 929 W 22nd St Merced, CA | 2.0 | 1.0 | 936 | $1,595 | $1.70 | 14d | 1 | 0.86mi |
| 3270 Meadows Ave Merced, CA | 1.0 | 1.0 | 560 | $1,210 | $2.16 | 14d | 7 | 0.87mi |
| 1859 Heritage Dr Merced, CA | 3.0 | 2.0 | 1022 | $1,700 | $1.66 | 14d | 1 | 0.88mi |
| 820 W 23rd St Merced, CA | 2.0 | 1.0 | 1014 | $1,750 | $1.73 | 14d | 1 | 0.97mi |
| 2415 O St Unit 2419 Merced, CA | 2.0 | 1.5 | 1000 | $1,500 | $1.50 | 14d | 1 | 1.01mi |
| 1163 Loughborough Dr Merced, CA | 2.0 | 1.0 | 830 | $1,400 | $1.69 | 14d | 1 | 1.02mi |
| 3310 R St Unit A Merced, CA | 2.0 | 1.0 | 850 | $1,400 | $1.65 | 14d | 1 | 1.14mi |
| 3372 San Mateo Ct Merced, CA | 2.0 | 2.0 | 800 | $1,100 | $1.38 | 14d | 1 | 1.25mi |
| 925 Loughborough Dr Merced, CA | 1.0–2.0 | 1.0–2.0 | 770 | $1,350 | $1.75 | 14d | 3 | 1.27mi |
| 515 W Main St Unit 301 Merced, CA | 1.0 | 1.0 | 646 | $1,475 | $2.28 | 14d | 1 | 1.27mi |
| 777 Loughborough Dr Merced, CA | 1.0–2.0 | 1.0 | 810 | $1,139 | $1.41 | 14d | 2 | 1.35mi |
| 2142 K St Merced, CA | 1.0 | 1.0 | 700 | $1,079 | $1.54 | 14d | 1 | 1.37mi |
| 2128 K St Merced, CA | 1.0 | 1.0 | 700 | $1,000 | $1.43 | 14d | 1 | 1.38mi |
| 341 W 21st St Merced, CA | 2.0 | 1.0 | 700 | $1,050 | $1.50 | 21d | 1 | 1.38mi |
| 669 Loughborough Dr Merced, CA | 2.0 | 1.0 | 830 | $1,450 | $1.75 | 14d | 1 | 1.42mi |
| 669 Loughborough Dr Unit 689-04 Merced, CA | 1.0 | 1.0 | 530 | $1,240 | $2.34 | 14d | 1 | 1.42mi |
| 1922 Martin Luther King Jr Way Merced, CA | 2.0 | 1.0 | 900 | $1,375 | $1.53 | 14d | 1 | 1.46mi |
| 536 W 10th St Unit 3 Merced, CA | 2.0 | 1.0 | 623 | $1,300 | $2.09 | 14d | 1 | 1.49mi |
Listing history 35 events
-
2026-06-18days on market $79,000 Active 268 DOM
-
2026-06-17days on market $79,000 Active 267 DOM
-
2026-06-16days on market $79,000 Active 266 DOM
-
2026-06-15days on market $79,000 Active 265 DOM
-
2026-06-14days on market $79,000 Active 263 DOM
-
2026-06-13days on market $79,000 Active 262 DOM
-
2026-06-10days on market $79,000 Active 260 DOM
-
2026-06-09days on market $79,000 Active 259 DOM
-
2026-06-08days on market $79,000 Active 258 DOM
-
2026-06-07days on market $79,000 Active 257 DOM
-
2026-06-03days on market $79,000 Active 253 DOM
-
2026-06-02days on market $79,000 Active 252 DOM
-
2026-06-01days on market $79,000 Active 251 DOM
-
2026-05-31days on market $79,000 Active 250 DOM
-
2026-05-30days on market $79,000 Active 249 DOM
-
2025-09-24$79,000 Active 363-char remark
Show marketing remark (363 chars)
This cozy and well-maintained 2-bedroom, 2-bath home is perfect for a couple looking to retire and enjoy peaceful living. Located in a friendly park with easy access to shopping and freeways, convenience is right at your doorstep. The home is move-in ready, offering comfort and simplicity. Seller is motivated and ready to make a dealdon't miss this opportunity!
-
2025-09-23$79,000 Active
-
2025-09-11historical
-
2024-11-02price $79,900
-
2024-11-02price $79,900
-
2024-09-11$80,000 Active
-
2024-08-21soldstatus $30,000 Closed Sale
-
2024-07-23status Pending Sale
-
2024-07-08price $35,000
-
2024-05-22price $40,000
-
2024-05-22$45,000 Active
-
2024-04-24historical
-
2024-03-12price $40,000
-
2024-01-24$45,000 Active
-
2024-01-22historical
-
2024-01-17status Active
-
2024-01-15historical
-
2023-08-01price $35,000
-
2023-03-20price $45,000
-
2022-12-07$50,000 Active
ⓘ Source: listings_history table (triggers on properties + properties_extension) + one-shot
backfill from property_details.listing_events for pre-trigger history.
Climate risk First Street
- Flood 5/10 Major FEMA zone AO · 64% chance over 30 yrs
- Wildfire 1/10 Low
- Heat 7/10 Severe 7 d/yr ≥105°F today · 16 d/yr by 30 yrs out
- Wind 1/10 Low
- Air quality 10/10 Extreme 34 unhealthy d/yr today · 35 by 30 yrs out
Nearby sold comps map
Loading sold comps map…
Walkable amenities ~0.75 mi
Loading nearby amenities…
Taxation est. · year 1
- Rental income
- $18,512
- − Mortgage interest
- −$4,425
- − Property taxes
- −$1,185
- − Insurance
- −$1,862
- − Repairs & maintenance
- −$1,481
- − Management
- −$1,481
- − Depreciation
- −$2,298
- Taxable income
- $5,779
- Est. tax owed @ 24.0%
- −$1,387
- After-tax cash flow
- $5,219/yr
For passive investors: Depreciation is non-cash, so a rental often shows a tax loss while cash-flowing — sheltering income. Rental losses are passive: they offset passive income freely, and up to $25,000/yr can offset ordinary (W-2) income if you actively participate and your MAGI is under $100k (phasing out to $0 by $150k); unused losses carry forward. On sale, claimed depreciation is recaptured at up to 25%, and gains may owe capital-gains tax (a 1031 exchange can defer both). Figures are a year-1 estimate at your 24.0% rate — not tax advice; consult a CPA.
Schools (NCES district)
- District
- Merced Union High
- NCES district ID
- 0624660
- Math proficiency
- 20% ▲ 3.00%
- Reading proficiency
- 46% ▼ -1.00%
- Median HH income
- $44,977
- Composite
- 28.11/100
- National rank
- #6823
- State rank
- #301 of 517 in CA
Livability — Merced
- Score
- 73/100
- State rank
- #153
- US rank
- #5111
Category grades
Schools grade is shown separately in the Schools card above.
Census & demographics
- Census place
- Merced, CA
- County
- Merced County · 205,386 people
- City population
- 112,228
- Metro
- Merced, CA
- Population (ZIP)
- 37,540
- Household income
- $64,944
- Rent vs Own
- Severe rent burden
- 1408.0
Population outlook (Merced County) Hauer SSP2
- Today (2025)
- 285,501 people
- By 2030
- 293,437 · +2.8%
- By 2040
- 308,808 · +8.2%
- By 2050
- 321,011 · +12.4%
- By 2075
- 338,497 · +18.6%
- By 2100
- 330,493 · +15.8%
Race, ethnicity, and origin ACS 2023
- Neighborhood character
- Diverse neighborhood (Simpson 0.68)
- Race & ethnicity
- Hispanic / Latino 49% White 23% Asian 16% Two or more races 15% Black 7%
- Hispanic origin (detail)
- Mexican 45%
- Common ancestry
- Russian 2% Lithuanian 1% Italian 1%
- Foreign-born
- 22% · Canada, Guatemala, China
- Languages at home
- 53% English-only · Spanish 32% Other Asian/Pacific 8% Other Indo-European 4%
Political lean MEDSL · Merced
- 2024 margin
- Toss-up / Even · D 46.5% · R 50.9% · Other 2.6%
- 2008→2024 swing
- -12.7pp toward R · 2008: 8.3pp · 2024: -4.4pp
- All cycles
- 2024: R+4.4 2020: D+10.6 2016: D+7.9 2012: D+5.4 2008: D+8.3
Not yet ingested
- Civics
- —
Market trends
- HPI YoY
- ▼ -323.74%
- Current HPI
- 247.7309
- Rent YoY
- ▼ -0.77%
- Metro
- Merced, CA
- State GDP YoY
- ▲ 3.21%
- F500 in state
- 116
Industry mix (Fortune 500 HQ in CA)
| Industry | F500 HQs | Revenue |
|---|---|---|
| Technology | 27 | $1,492B |
|
||
| Financial Services | 3 | $174B |
|
||
| Retail | 3 | $44B |
|
||
| Insurance | 3 | $26B |
|
||
| Media / Entertainment | 2 | $115B |
|
||
| Pharmaceuticals / Biotech | 2 | $62B |
|
||
Price history
+58.0% since first listed20 events — show timeline
- 2025-09-24 Listed $79,000 FRESNOMLS
- 2025-09-23 Listed $79,000 CRMLS
- 2025-09-11 Listing Removed — CRMLS
- 2024-11-02 Price Changed $79,900 CRMLS
- 2024-11-02 Price Changed $79,900 FRESNOMLS
- 2024-09-11 Listed $80,000 CRMLS
- 2024-08-21 Sold (MLS) $30,000 CRMLS
- 2024-07-23 Pending — CRMLS
- 2024-07-08 Price Changed $35,000 CRMLS
- 2024-05-22 Price Changed $40,000 CRMLS
- 2024-05-22 Listed $45,000 CRMLS
- 2024-04-24 Listing Removed — CRMLS
- 2024-03-12 Price Changed $40,000 CRMLS
- 2024-01-24 Listed $45,000 CRMLS
- 2024-01-22 Listing Removed — CRMLS
- 2024-01-17 Relisted — CRMLS
- 2024-01-15 Listing Removed — CRMLS
- 2023-08-01 Price Changed $35,000 CRMLS
- 2023-03-20 Price Changed $45,000 CRMLS
- 2022-12-07 Listed $50,000 CRMLS
Property tax history
-3.2%/yrLatest (2020): $133 · -4.1% YoY. Source: county tax records.
Cash-flow waterfall
monthlySold comps — $/sqft
last 12 mo · ≤1 miLoading sold comps…