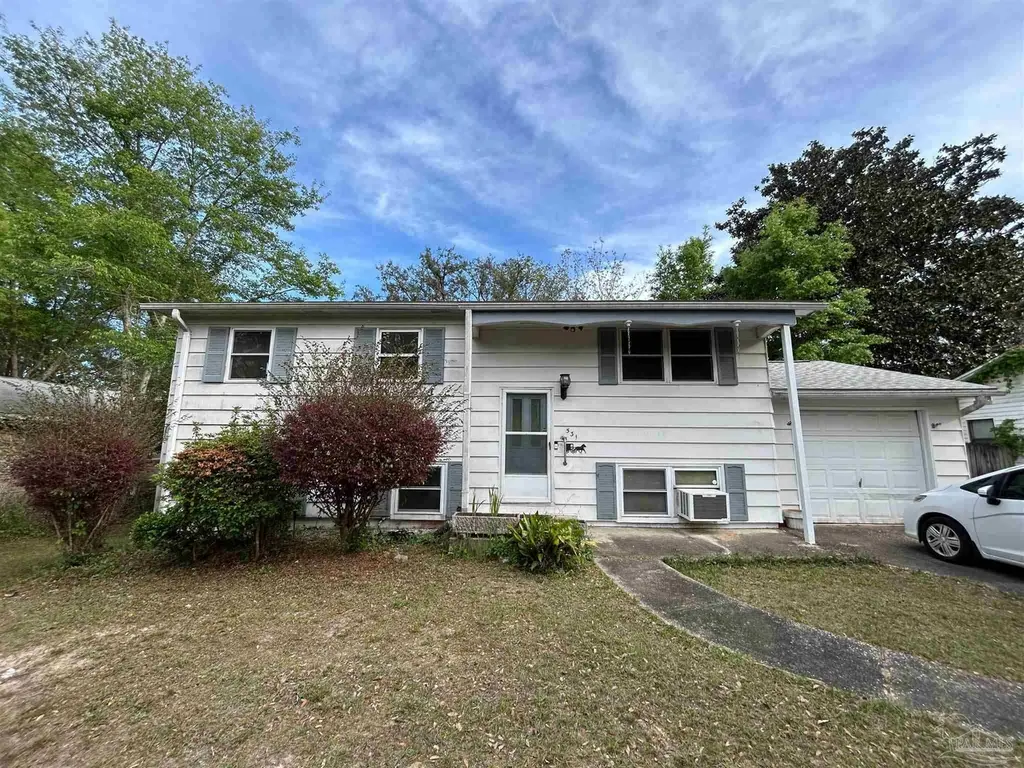
531 Chadwick St · Pensacola, FL
Flood risk 3/10 · Minor
- FEMA flood zone
- X (unshaded)
- Chance of flooding over 30 yrs
- 0.2%
- Est. flood insurance / yr
- $473 – $860
Fire risk 1/10 · Minimal
- Est. fire insurance / yr
- $947 – $1,759
Heat risk 10/10 · Severe
- Hot days now (above 105°F)
- 7 days/yr
- Hot days in 30 yrs
- 22 days/yr
Wind risk 9/10 · Severe
- Chance of severe wind over 30 yrs
- 99.0%
Air-quality risk 1/10 · Minimal
- Unhealthy air days now
- 0 days/yr
- Unhealthy air days in 30 yrs
- 0 days/yr
Risk factors via First Street. Map © Google.
Why this score? — see what drove the C+ grade
The composite is a weighted blend of 9 inputs, each scored 0–100. Each bar is that input's sub-score; the figure is the points it added to the 100-point composite (weight × sub-score).
- Cash flow +22.8/30.0
- ARV discount +12.4/15.0
- DSCR +7.3/10.0
- 1% rule +6.2/10.0
- Livability +4.2/5.0
- Schools +3.6/10.0
- Rent growth +3.3/5.0
- Condition / age +2.5/5.0
- Appreciation +0.0/10.0
$195,000
🖨 Deal sheet 📄 Offer letter ✓ Due diligence
Listing remarks MLS
This unique property offers a rare opportunity for renovation with strong upside potential. Featuring a split floor plan, the home includes two full-sized kitchens, making it ideal for multi-generational living, rental potential, or a creative redesign. The lower level functions as a private master suite, while the upper level offers three additional bedrooms and a full bathroom. Key updates include a newer roof and gas heater, providing a solid starting point for improvements. The home is currently equipped with window units (no central AC). With the right vision, this property can be transformed into a standout residence or income-producing investment. The sq footage is not including the downstairs multipurpose room with the fire place that can be used as heated and cooled space.
Key facts
- 0.27 acre lot
- Garage
- Built 1962
Neighborhood map
What this means for you Summary
Snapshot
- This is a 4-bed/2.0-bath single-family listed at $195k.
Deal economics
- At list price, monthly cash flow is $339 ($4k/yr) — positive.
- The deal already cash-flows at list — no discount required.
- Meets the 1% rule at list price ($2k rent vs $195k).
- Recommended offer: $183k (6.0% below list) — sets the bar for market timing.
- Cap rate 8.4% vs local median 3.6% in Pensacola — top-decile yield for the area; either an underpriced asset or a hidden risk that comps aren't pricing in. Stress-test before assuming the spread holds.
Location & tenants
- Location reads 83/100 on livability (#53 in FL, #924 nationally) — a professional / high-income tenant draw. Strengths: commute A+, cost of living A+, housing A+.
- Escambia (suburban): math 40% / reading 45% proficiency, ranked #56 of 73 in FL (top 77%) — families likely to look elsewhere, expect single-tenant / working-renter base with shorter leases.
- Market conditions: Rents rising (+3.4%/yr); 240 active listings in the ZIP; 1 comparable units currently listed for rent nearby; 1,479 units permitted in Escambia County in 2024 (0 in 5+ unit buildings).
- This rent runs 37% of the median local income ($71k/yr) — at the standard rent-burdened threshold; future hikes will face affordability resistance.
Forward outlook
- Local home prices are declining (-3.0%/yr); year-one equity from $1k of loan paydown is wiped out by about $6k of value loss. Plan a longer hold.
- Escambia County population projected at +13% by 2050 — modest demand growth; plan on rents tracking national, not racing it.
Negotiation context
- It's been on market 66 days — a 6% lower offer ($183k) is reasonable based on typical stale-listing flexibility.
- 3 sale attempts since 26y ago with the ask held roughly flat each time — persistent listings suggest the price (not the market) is what's stuck; bring a comps-based counter.
Risks & watch-outs
- Climate carrying-cost: severe wind risk, 99% chance of damaging wind over 30y; extreme-heat days projected 7→22/yr by 2055 (HVAC capex compounding) — expect insurance premiums to compound above CPI over the hold.
Questions for the listing agent
- It's been on market 66 days. Have you received any prior offers? Is the seller open to a 6% concession, seller financing, or rate buy-down credit?
- Built in 1962 — when were the roof, HVAC, electrical panel, plumbing, and water heater last replaced?
- Why hasn't it sold? Are there any deal-killer items the seller is aware of (foundation, flood, title, zoning, code violations)?
- Is there a deadline driving the sale (1031 exchange, divorce, estate, relocation)? That informs how much negotiation room exists.
- What's the average days-on-market for RENTAL listings here right now (not sales)? A rising rental-DOM trend means longer vacancies and softer asking-rent achievability than the comps imply.
- What's the recent tenant-quality profile in this submarket — average credit score on applications, eviction rate, late-payment / NSF rate, and stable-employment percentage? A property-management company in the area should have these aggregated.
- How much new for-sale + rental construction is in the pipeline within 1–3 miles? Heavy new supply typically softens prices + rents 12–24 months out; constrained supply supports both.
Investment metrics
- 1% rule
- 1.12% ✓
- Cap rate
- 8.38%
- Cash-on-cash
- 7.45%
- DSCR
- 1.33
- GRM
- 7.4
CMA / ARV
- ARV (median comp)
- $218,675
- List price
- $195,000
- Delta
- -10.83%
- Verdict
- UNDERPRICED
- Comps
- 20 within 1.0 mi
Show comp detail 6 sales within ~0.75 mi
| Address | Dist | Beds/Ba | Sqft | Sold | Price | $/sf | Match |
|---|---|---|---|---|---|---|---|
| 533 Ditmar St | 0.11mi | 4/3.0 | 2,321 (-4%) | 2mo | $250,000 | $108 | 84 |
| 1091 Windchime Way | 0.71mi | 3/2.0 (-1) | 2,496 (+4%) | 1mo | $545,000 | $218 | 54 |
| 4266 Acacia Dr | 0.38mi | 3/2.0 (-1) | 2,098 (-13%) | 15mo | $255,000 | $122 | 44 |
| 5053 Crestwood Rd | 0.61mi | 3/2.0 (-1) | 2,130 (-11%) | 12mo | $242,000 | $114 | 37 |
| 1145 Windchime Way | 0.73mi | 3/2.0 (-1) | 2,600 (+8%) | 13mo | $575,000 | $221 | 36 |
| 380 Clematis St | 0.62mi | 4/3.0 | 2,102 (-13%) | 16mo | $319,500 | $152 | 33 |
Match score weights: distance 35% · size 25% · config 20% · recency 20%. Top-matched comps best support the ARV.
Projected returns pro-forma
-3.0% appreciation · 3.39% rent growth · sell at horizon
- IRR
- -4.4%
- Equity multiple
- 0.83×
- Total profit
- $-9,073
- Equity at exit
- $29,075
- IRR
- 5.7%
- Equity multiple
- 1.43×
- Total profit
- $23,734
- Equity at exit
- $16,860
Cash invested: $54,600 (down + closing). Projections, not guarantees.
Landlord ↔ Tenant lean methodology
- Overall (STATE)
- 87 Strongly Landlord-Friendly
- State Florida
- 87 Strongly Landlord-Friendly · R+3
- County
- — inherits STATE
- City
- — inherits STATE
ZIP-level market 32503
- Rents YoY
- 3.4%
- Active inventory
- 240
- Price-to-rent
- 7.4×
Monthly cashflow live
- Estimated rent
- $2,193 medium interval (Pro) →
- Mortgage (P&I)
- −$1,023
- Tax from tax record
- −$289 /mo · $3,471/yr
- Insurance
- −$81
- HOA
- −$0
- Vacancy / Maint / Mgmt
- −$460
- Net cashflow
- $339
Break-even live
UW: 25.0% down · 7.5% · 30yr · 1.5% tax · 5.0% vac · 8.0% maint · 8.0% mgmt
Financing live
Cash to close
- Down payment
- $48,750
- Closing costs
- $5,850
- Reserves months
- —
- Total cash needed
- —
Loan-product check · same deal, 3 products live
Conventional
25% down · 7.5% · 30yr
- Down + closing
- —
- Monthly P&I
- —
- Monthly cashflow
- —
- DSCR
- —
- Eligible?
- —
Personal DTI + credit; lowest rate.
DSCR
20% down · 8.5% · 30yr
- Down + closing
- —
- Monthly P&I
- —
- Monthly cashflow
- —
- DSCR
- —
- Eligible?
- —
No personal income docs; deal must DSCR.
Hard money
10% down · 12.0% · 12mo
- Down + closing
- —
- Monthly P&I
- —
- Monthly cashflow
- —
- DSCR
- —
- Eligible?
- —
Short-term bridge; refi at stabilization.
Rent comps 1 comps
| Address | Beds | Baths | Sqft | Rent | $/sqft | DOM | Units | Dist |
|---|---|---|---|---|---|---|---|---|
| 4400 N 9th Ave Pensacola, FL | 3.0 | 1.5 | 1713 | $2,000 | $1.17 | 23d | 1 | 0.44mi |
Listing history 13 events
-
2026-06-08days on market $195,000 Active 66 DOM
-
2026-06-07days on market $195,000 Active 65 DOM
-
2026-06-03days on market $195,000 Active 61 DOM
-
2026-06-02days on market $195,000 Active 60 DOM
-
2026-06-01days on market $195,000 Active 59 DOM
-
2026-05-31days on market $195,000 Active 58 DOM
-
2026-05-31days on market $195,000 Active 57 DOM
-
2026-05-18price $195,000 792-char remark
Show marketing remark (792 chars)
This unique property offers a rare opportunity for renovation with strong upside potential. Featuring a split floor plan, the home includes two full-sized kitchens, making it ideal for multi-generational living, rental potential, or a creative redesign. The lower level functions as a private master suite, while the upper level offers three additional bedrooms and a full bathroom. Key updates include a newer roof and gas heater, providing a solid starting point for improvements. The home is currently equipped with window units (no central AC). With the right vision, this property can be transformed into a standout residence or income-producing investment. The sq footage is not including the downstairs multipurpose room with the fire place that can be used as heated and cooled space.
-
2026-04-03$199,000 Active 792-char remark
Show marketing remark (792 chars)
This unique property offers a rare opportunity for renovation with strong upside potential. Featuring a split floor plan, the home includes two full-sized kitchens, making it ideal for multi-generational living, rental potential, or a creative redesign. The lower level functions as a private master suite, while the upper level offers three additional bedrooms and a full bathroom. Key updates include a newer roof and gas heater, providing a solid starting point for improvements. The home is currently equipped with window units (no central AC). With the right vision, this property can be transformed into a standout residence or income-producing investment. The sq footage is not including the downstairs multipurpose room with the fire place that can be used as heated and cooled space.
-
2003-02-24historical
-
2002-10-09$79,900
-
2001-07-19historical
-
2000-08-19$89,900
ⓘ Source: listings_history table (triggers on properties + properties_extension) + one-shot
backfill from property_details.listing_events for pre-trigger history.
Tax reassessment forecast FL · Resets to sale price
- Current annual tax
- $3,471 · $289/mo
- Projected year-2 tax
- $3,471 · $289/mo
- Expected delta
- $0/yr ($0/mo · 0.0%)
ⓘ Screening estimate from a state-policy table — verify with the county assessor before closing.
Climate risk First Street
- Flood 3/10 Moderate FEMA zone X (unshaded) · 20% chance over 30 yrs
- Wildfire 1/10 Low
- Heat 10/10 Extreme 7 d/yr ≥105°F today · 22 d/yr by 30 yrs out
- Wind 9/10 Extreme 99% chance of damaging wind over 30 yrs
- Air quality 1/10 Low 0 unhealthy d/yr today · 0 by 30 yrs out
Nearby sold comps map
Loading sold comps map…
Walkable amenities ~0.75 mi
Loading nearby amenities…
Taxation est. · year 1
- Rental income
- $26,313
- − Mortgage interest
- −$10,923
- − Property taxes
- −$3,471
- − Insurance
- −$975
- − Repairs & maintenance
- −$2,105
- − Management
- −$2,105
- − Depreciation
- −$5,673
- Taxable income
- $1,061
- Est. tax owed @ 24.0%
- −$255
- After-tax cash flow
- $3,815/yr
For passive investors: Depreciation is non-cash, so a rental often shows a tax loss while cash-flowing — sheltering income. Rental losses are passive: they offset passive income freely, and up to $25,000/yr can offset ordinary (W-2) income if you actively participate and your MAGI is under $100k (phasing out to $0 by $150k); unused losses carry forward. On sale, claimed depreciation is recaptured at up to 25%, and gains may owe capital-gains tax (a 1031 exchange can defer both). Figures are a year-1 estimate at your 24.0% rate — not tax advice; consult a CPA.
Schools (NCES district)
- District
- Escambia
- NCES district ID
- 1200510
- Math proficiency
- 40% ▼ -9.00%
- Reading proficiency
- 45% ▼ -4.00%
- Median HH income
- $44,649
- Composite
- 36.04/100
- National rank
- #4773
- State rank
- #56 of 73 in FL
Livability — Pensacola
- Score
- 83/100
- State rank
- #53
- US rank
- #924
Category grades
Schools grade is shown separately in the Schools card above.
Census & demographics
- Census place
- Pensacola, FL
- County
- Escambia County · 301,722 people
- City population
- 237,636
- Metro
- Pensacola-Ferry Pass-Brent, FL
- Population (ZIP)
- 33,559
- Household income
- $71,411
- Rent vs Own
- Severe rent burden
- 948.0
Population outlook (Escambia County) Hauer SSP2
- Today (2025)
- 334,637 people
- By 2030
- 345,779 · +3.3%
- By 2040
- 364,828 · +9.0%
- By 2050
- 378,514 · +13.1%
- By 2075
- 403,220 · +20.5%
- By 2100
- 386,125 · +15.4%
Race, ethnicity, and origin ACS 2023
- Neighborhood character
- Predominantly White (68%)
- Race & ethnicity
- White 68% Black 20% Two or more races 6% Hispanic / Latino 5% Asian 2%
- Common ancestry
- Lithuanian 3% Italian 2% Romanian 2%
- Foreign-born
- 5% · Canada, China
- Languages at home
- 93% English-only · Spanish 3% Arabic 1% Tagalog/Filipino 1%
Political lean MEDSL · Escambia
- 2024 margin
- R (+19.5) · D 39.7% · R 59.2% · Other 1.1%
- 2008→2024 swing
- -0.2pp no change · 2008: -19.3pp · 2024: -19.5pp
- All cycles
- 2024: R+19.5 2020: R+15.1 2016: R+20.6 2012: R+20.6 2008: R+19.3
Not yet ingested
- Civics
- —
Market trends
- HPI YoY
- ▼ -300.02%
- Current HPI
- 294.4873
- Rent YoY
- ▲ 3.39%
- Metro
- Pensacola-Ferry Pass-Brent, FL
- State GDP YoY
- ▲ 3.28%
- F500 in state
- 36
Industry mix (Fortune 500 HQ in FL)
| Industry | F500 HQs | Revenue |
|---|---|---|
| Industrial Technology | 2 | $29B |
|
||
| Insurance | 2 | $17B |
|
||
| Retail | 1 | $60B |
|
||
| Technology Distribution | 1 | $58B |
|
||
| Homebuilding | 1 | $35B |
|
||
| Technology Manufacturing | 1 | $35B |
|
||
Price history
+116.9% since first listed6 events — show timeline
- 2026-05-18 Price Changed $195,000 PARMLS
- 2026-04-03 Listed $199,000 PARMLS
- 2003-02-24 Listing Removed — PARMLS
- 2002-10-09 Listed $79,900 PARMLS
- 2001-07-19 Listing Removed — PARMLS
- 2000-08-19 Listed $89,900 PARMLS
Property tax history
+17.0%/yrLatest (2025): $3,471 · +4.5% YoY. Source: county tax records.
Cash-flow waterfall
monthlySold comps — $/sqft
last 12 mo · ≤1 miLoading sold comps…