8 Fordham Hill Oval Unit 3D · New York, NY
Flood risk 1/10 · Minimal
- FEMA flood zone
- X (unshaded)
- Chance of flooding over 30 yrs
- 0.0%
- Est. flood insurance / yr
- $507 – $1,088
Fire risk 1/10 · Minimal
- Est. fire insurance / yr
- $691 – $1,283
Heat risk 6/10 · Moderate
- Hot days now (above 99°F)
- 7 days/yr
- Hot days in 30 yrs
- 14 days/yr
Wind risk 6/10 · Moderate
- Chance of severe wind over 30 yrs
- 27.0%
Air-quality risk 3/10 · Minor
- Unhealthy air days now
- 3 days/yr
- Unhealthy air days in 30 yrs
- 4 days/yr
Risk factors via First Street. Map © Google.
Why this score? — see what drove the D- grade
The composite is a weighted blend of 9 inputs, each scored 0–100. Each bar is that input's sub-score; the figure is the points it added to the 100-point composite (weight × sub-score).
- 1% rule +8.5/10.0
- ARV discount +7.5/15.0
- Appreciation +5.3/10.0
- Schools +5.0/10.0
- Rent growth +4.2/5.0
- Livability +3.8/5.0
- Condition / age +2.5/5.0
- Cash flow +0.0/30.0
- DSCR +0.0/10.0
$159,000
🖨 Deal sheet 📄 Offer letter ✓ Due diligence
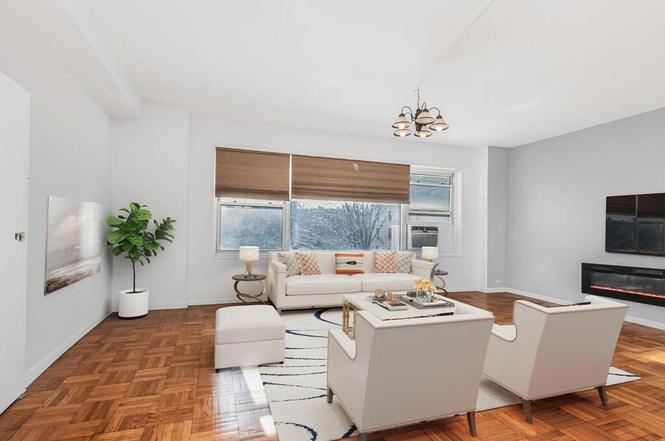
Listing remarks
Welcome to this lovely one bedroom apartment with natural hardwood floors. The large living room and dining area is soaked in sunlight and accommodates full dinning room furniture. With a cozy eat in kitchen with plenty of cabinets and storage this is a great space to make those delicious meals. Enjoy this quiet serene environment that is near restaurants, shopping, schools, parks and your choice of transportation. Fordham Hill Oval is a gated community with 24-hour security with video surveillance, a playground, laundry room, community room, on 7 acres in the University Heights section of The Bronx. Maintenance includes all Utilities (gas, electricity, basic cable, insurance and taxes) and
Key facts
- Gated community
- Video surveillance
- Cozy eat in kitchen
Tags
Property features AI
Exterior
- Parking: Off-site parking
- Utilities: Public sewer; Cable available
- Home design: Stock cooperative
- Construction: Brick construction
- Exterior features: Brick construction; Not waterfront
Interior
- Kitchen: Other appliances
- Bedrooms: 3rd floor entry level
- Flooring: Hardwood
- Bathrooms: 1 full bathroom
- Heating & cooling: Baseboard heating; Wall/window air conditioning units
- Interior features: Entrance foyer; Hardwood flooring; Pets allowed with size limit
Neighborhood map
What this means for you Summary
Snapshot
- This is a 1-bed/1.0-bath condo listed at $159k.
Deal economics
- At list price, monthly cash flow is $-872 ($-10k/yr) — negative.
- The deal already cash-flows at list — no discount required.
- Meets the 1% rule at list price ($2k rent vs $159k).
- Recommended offer: $140k (12.0% below list) — sets the bar for market timing.
- Cap rate -0.3% vs local median 2.6% in New York — below-typical yield; the buyer is paying a premium for something (appreciation thesis, condition, location) that the cap rate doesn't capture.
Location & tenants
- Location reads 75/100 on livability (#268 in NY, #4,188 nationally) — a middle-class / working-renter tenant base. Strengths: amenities A+, commute A+, health & safety A; Watch: crime F, cost of living F.
- Market conditions: Rents rising fast (+6.7%/yr); 122 active listings in the ZIP; 1 comparable units currently listed for rent nearby; 6,929 units permitted in Bronx County in 2024 (6,829 in 5+ unit buildings).
- At $2,139/mo this rent would consume 56% of the median local household income ($46k/yr) (locally 9659% of renters already pay >50% of income on rent) — very limited rent-growth headroom before tenants either downsize or default.
Forward outlook
- In year one you build about $2k of equity ($1k loan paydown + $801 appreciation (0.5% local appreciation)).
- Bronx County population projected at +21% by 2050 — long-run rental-demand tailwind backs the buy-and-hold thesis.
Negotiation context
- It's been on market 149 days — a 12% lower offer ($140k) is reasonable based on typical stale-listing flexibility.
Risks & watch-outs
- Watch-outs: HOA is 68% of rent; built in 1950 — expect roof / HVAC / electrical / plumbing capex.
- Climate carrying-cost: major wind risk, 27% chance of damaging wind over 30y; extreme-heat days projected 7→14/yr by 2055 (HVAC capex compounding) — expect insurance premiums to compound above CPI over the hold.
Questions for the listing agent
- What do current leases actually rent for vs. the listed asking? Can we see a recent rent roll and the last 12 months of T-12 income?
- It's been on market 149 days. Have you received any prior offers? Is the seller open to a 12% concession, seller financing, or rate buy-down credit?
- Built in 1950 — when were the roof, HVAC, electrical panel, plumbing, and water heater last replaced?
- What does the HOA fee cover, when was the last increase, and are there any pending special assessments or reserve-fund shortfalls?
- Any open or pending special assessments — roof, HVAC, plumbing, elevator, façade? What's the per-unit balance and payoff schedule, and is the seller paying it off at close or rolling it to the buyer?
- Why hasn't it sold? Are there any deal-killer items the seller is aware of (foundation, flood, title, zoning, code violations)?
- Is there a deadline driving the sale (1031 exchange, divorce, estate, relocation)? That informs how much negotiation room exists.
- Schools are B-rated — typically a magnet for longer-tenancy family renters. What's the average tenant stay here, and is there a school-zone premium baked into asking?
- Crime grade is F in this area — have there been break-ins, vandalism, or insurance claims at this property in the last 3 years? What carrier currently insures it and at what premium?
- The area grade is low — what's the realistic commute time and amenity access for the typical tenant pool here? Any planned neighborhood developments (good or bad) we should know about?
- What's the average days-on-market for RENTAL listings here right now (not sales)? A rising rental-DOM trend means longer vacancies and softer asking-rent achievability than the comps imply.
- What's the recent tenant-quality profile in this submarket — average credit score on applications, eviction rate, late-payment / NSF rate, and stable-employment percentage? A property-management company in the area should have these aggregated.
- How much new apartment / multifamily construction is in the pipeline within 1–3 miles? Heavy new supply (>2% of stock underway) typically softens rents 12–24 months out; light construction supports rent growth.
Investment metrics
- 1% rule
- 1.35% ✓
- Cap rate
- -0.29%
- Cash-on-cash
- -23.50%
- DSCR
- -0.05
- GRM
- 6.2
CMA / ARV
No comps found within radius.
Projected returns pro-forma
0.5% appreciation · 6.7% rent growth · sell at horizon
- IRR
- -21.1%
- Equity multiple
- -0.06×
- Total profit
- $-47,178
- Equity at exit
- $50,214
- IRR
- -7.9%
- Equity multiple
- -0.05×
- Total profit
- $-46,959
- Equity at exit
- $63,690
Cash invested: $44,520 (down + closing). Projections, not guarantees.
Landlord ↔ Tenant lean methodology
- Overall (CITY)
- 0 Strongly Tenant-Friendly
- State New York
- 15 Strongly Tenant-Friendly · D+10
- County
- — inherits STATE
- City New York
- 0 Strongly Tenant-Friendly · D+34
ZIP-level market 10468
- Home prices YoY
- 0.2%
- Rents YoY
- 6.7%
- Active inventory
- 122
- Price-to-rent
- 6.2×
Monthly cashflow live
- Estimated rent
- $2,139 medium interval (Pro) →
- Mortgage (P&I)
- −$834
- Tax est. 1.5%
- −$199 /mo · $2,385/yr
- Insurance
- −$66
- HOA est. from 1 same-building comp
- −$1,463
- Vacancy / Maint / Mgmt
- −$449
- Net cashflow
- $-872
Break-even live
UW: 25.0% down · 7.5% · 30yr · 1.5% tax · 5.0% vac · 8.0% maint · 8.0% mgmt
Financing live
Cash to close
- Down payment
- $39,750
- Closing costs
- $4,770
- Reserves months
- —
- Total cash needed
- —
Loan-product check · same deal, 3 products live
Conventional
25% down · 7.5% · 30yr
- Down + closing
- —
- Monthly P&I
- —
- Monthly cashflow
- —
- DSCR
- —
- Eligible?
- —
Personal DTI + credit; lowest rate.
DSCR
20% down · 8.5% · 30yr
- Down + closing
- —
- Monthly P&I
- —
- Monthly cashflow
- —
- DSCR
- —
- Eligible?
- —
No personal income docs; deal must DSCR.
Hard money
10% down · 12.0% · 12mo
- Down + closing
- —
- Monthly P&I
- —
- Monthly cashflow
- —
- DSCR
- —
- Eligible?
- —
Short-term bridge; refi at stabilization.
Rent comps 1 comps
| Address | Beds | Baths | Sqft | Rent | $/sqft | DOM | Units | Dist |
|---|---|---|---|---|---|---|---|---|
| 2600 Netherland Ave Bronx, NY | 1.0–3.0 | 1.0–2.5 | 1132 | $2,775 | $2.45 | 22d | 3 | 1.08mi |
HOA detail condo
- Monthly dues
- $0 · $0/yr
- Likely covers
- gaselectriccablesecurity
- Assessments
- None detected in remarks — confirm with the listing agent.
Listing history 11 events
-
2026-06-18days on market $159,000 Active 149 DOM
-
2026-06-17days on market $159,000 Active 148 DOM
-
2026-06-15days on market $159,000 Active 146 DOM
-
2026-06-13days on market $159,000 Active 144 DOM
-
2026-06-10days on market $159,000 Active 140 DOM
-
2026-06-08days on market $159,000 Active 139 DOM
-
2026-06-04days on market $159,000 Active 135 DOM
-
2026-06-03days on market $159,000 Active 134 DOM
-
2026-06-01days on market $159,000 Active 132 DOM
-
2026-05-31days on market $159,000 Active 131 DOM
-
2026-01-20$159,000 Active
ⓘ Source: listings_history table (triggers on properties + properties_extension) + one-shot
backfill from property_details.listing_events for pre-trigger history.
Climate risk First Street
- Flood 1/10 Low FEMA zone X (unshaded) · 0% chance over 30 yrs
- Wildfire 1/10 Low
- Heat 6/10 Major 7 d/yr ≥99°F today · 14 d/yr by 30 yrs out
- Wind 6/10 Major 27% chance of damaging wind over 30 yrs
- Air quality 3/10 Moderate 3 unhealthy d/yr today · 4 by 30 yrs out
Nearby sold comps map
Loading sold comps map…
Walkable amenities ~0.75 mi
Loading nearby amenities…
Taxation est. · year 1
- Rental income
- $25,672
- − Mortgage interest
- −$8,906
- − Property taxes
- −$2,385
- − Insurance
- −$795
- − Repairs & maintenance
- −$2,054
- − Management
- −$2,054
- − HOA
- −$17,556
- − Depreciation
- −$4,625
- Taxable loss
- −$12,703
- Est. tax savings @ 24.0%
- +$3,049
- After-tax cash flow
- $-7,412/yr
For passive investors: Depreciation is non-cash, so a rental often shows a tax loss while cash-flowing — sheltering income. Rental losses are passive: they offset passive income freely, and up to $25,000/yr can offset ordinary (W-2) income if you actively participate and your MAGI is under $100k (phasing out to $0 by $150k); unused losses carry forward. On sale, claimed depreciation is recaptured at up to 25%, and gains may owe capital-gains tax (a 1031 exchange can defer both). Figures are a year-1 estimate at your 24.0% rate — not tax advice; consult a CPA.
Schools (NCES district)
No district data.
Livability — New York
- Score
- 75/100
- State rank
- #268
- US rank
- #4188
Category grades
Schools grade is shown separately in the Schools card above.
Census & demographics
- Census place
- New York, NY
- County
- Bronx County · 1,197,324 people
- City population
- 7,731,280
- Metro
- New York-Newark-Jersey City, NY-NJ-PA
- Population (ZIP)
- 75,557
- Household income
- $46,233
- Rent vs Own
- Severe rent burden
- 9659.0
Population outlook (Bronx County) Hauer SSP2
- Today (2025)
- 1,607,353 people
- By 2030
- 1,681,852 · +4.6%
- By 2040
- 1,824,421 · +13.5%
- By 2050
- 1,945,470 · +21.0%
- By 2075
- 2,187,887 · +36.1%
- By 2100
- 2,244,136 · +39.6%
Race, ethnicity, and origin ACS 2023
- Neighborhood character
- Predominantly Hispanic (76%)
- Race & ethnicity
- Hispanic / Latino 76% Black 17% Two or more races 15% White 3% Asian 2% Native American 2%
- Hispanic origin (detail)
- Mexican 10% Puerto Rican 11% Dominican 45%
- Common ancestry
- Hispanic 1%
- Foreign-born
- 46% · Canada, Vietnam, Jamaica
- Languages at home
- 22% English-only · Spanish 69% French/Haitian/Cajun 1% Other Indo-European 1%
Political lean MEDSL · Bronx
- 2024 margin
- Solid D (+45.4) · D 72.7% · R 27.3%
- 2008→2024 swing
- -32.3pp toward R · 2008: 77.8pp · 2024: 45.4pp
- All cycles
- 2024: D+45.4 2020: D+67.6 2016: D+79.1 2012: D+82.9 2008: D+77.8
Not yet ingested
- Civics
- —
Market trends
- HPI YoY
- ▲ 0.50%
- Current HPI
- 249.8923
- Rent YoY
- ▲ 6.70%
- Metro
- New York-Newark-Jersey City, NY-NJ-PA
- State GDP YoY
- ▲ 2.60%
- F500 in state
- 92
Industry mix (Fortune 500 HQ in NY)
| Industry | F500 HQs | Revenue |
|---|---|---|
| Financial Services | 10 | $950B |
|
||
| Consumer Goods | 9 | $162B |
|
||
| Insurance | 4 | $225B |
|
||
| Telecommunications | 2 | $144B |
|
||
| Pharmaceuticals | 2 | $112B |
|
||
| Media / Entertainment | 2 | $69B |
|
||
Price history
1 event — show timeline
- 2026-01-20 Listed $159,000 OneKey® MLS as Distributed by MLS Grid
Cash-flow waterfall
monthlySold comps — $/sqft
last 12 mo · ≤1 miLoading sold comps…