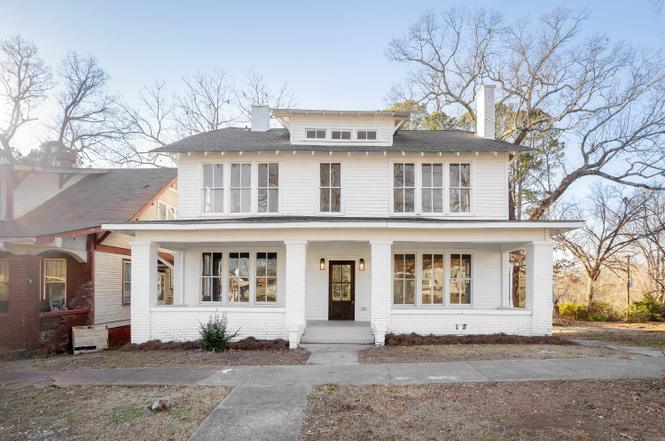
709 Austin Ave · Sheffield, AL
Flood risk 1/10 · Minimal
- FEMA flood zone
- X (unshaded)
- Chance of flooding over 30 yrs
- 0.0%
- Est. flood insurance / yr
- $507 – $1,088
Fire risk 1/10 · Minimal
- Est. fire insurance / yr
- $916 – $1,700
Heat risk 6/10 · Moderate
- Hot days now (above 108°F)
- 7 days/yr
- Hot days in 30 yrs
- 20 days/yr
Wind risk 5/10 · Moderate
- Chance of severe wind over 30 yrs
- 23.0%
Air-quality risk 2/10 · Minimal
- Unhealthy air days now
- 0 days/yr
- Unhealthy air days in 30 yrs
- 1 days/yr
Risk factors via First Street. Map © Google.
Why this score? — see what drove the D+ grade
The composite is a weighted blend of 9 inputs, each scored 0–100. Each bar is that input's sub-score; the figure is the points it added to the 100-point composite (weight × sub-score).
- Cash flow +15.7/30.0
- ARV discount +15.0/15.0
- DSCR +4.8/10.0
- 1% rule +4.3/10.0
- Livability +3.0/5.0
- Rent growth +2.5/5.0
- Condition / age +2.5/5.0
- Schools +1.9/10.0
- Appreciation +0.0/10.0
$199,000
🖨 Deal sheet 📄 Offer letter ✓ Due diligence
Listing remarks
Remarkable renovation! The character of this 115 year old home has been kept intact, but so many things are NEW. The HVAC, roof, hardwood floors, electrical, plumbing, stainless appliances, cabinets, Quartz countertops, two new decks with iron railings, tile floors in the kitchen and bathroom, and tile shower are all brand new. Gold finishes and light fixtures are also new. The baseboards are 12" (new) but maintain the character of the home. Many windows have new glass, and the original French doors into the study add that southern feel to this awesome house. Another feature that adds character is the side entry leading into the stairwell. The view of the Sheffield Courthouse is stunni
Key facts
- New plumbing
- New hvac
- New hardwood floors
Tags
Neighborhood map
What this means for you Summary
Snapshot
- This is a 4-bed/1.0-bath single-family listed at $199k.
Deal economics
- At list price, monthly cash flow is $86 ($1k/yr) — positive.
- The deal already cash-flows at list — no discount required.
- To meet the 1% rule (rent ≥ 1% of price), the offer needs to be $185k (7.0% below list).
- Recommended offer: $175k (12.0% below list) — sets the bar for market timing.
- Cap rate 6.8% vs local median 5.1% in Sheffield — top-decile yield for the area; either an underpriced asset or a hidden risk that comps aren't pricing in. Stress-test before assuming the spread holds.
Location & tenants
- Location reads 60/100 on livability (#312 in AL) — a middle-class / working-renter tenant base. Strengths: cost of living A+, housing A+; Watch: schools F, crime F, amenities F.
- Sheffield City (suburban): math 12% / reading 34% proficiency, ranked #103 of 129 in AL (top 80%) — low school quality limits family demand, transient renter base, plan for 1-2y turnover; 74% free/reduced lunch — lower-income household profile, screen leases tightly.
- Market conditions: 115 active listings in the ZIP; 1 comparable units currently listed for rent nearby; 91 units permitted in Colbert County in 2024 (0 in 5+ unit buildings).
Forward outlook
- Local home prices are declining (-3.0%/yr); year-one equity from $1k of loan paydown is wiped out by about $6k of value loss. Plan a longer hold.
- Colbert County population projected to shrink 7% by 2050 — rents likely to lag national; underwrite the cash flow, not the appreciation.
Negotiation context
- It's been on market 196 days — a 12% lower offer ($175k) is reasonable based on typical stale-listing flexibility.
- 4 sale attempts since 2y ago; this cycle's ask has dropped $36k (15%) from the opening price — seller is motivated, your offer sets the floor, not the list.
- Current owner paid $60k; list at $199k implies a 232% gain — meaningful room to come down on a strong offer.
Risks & watch-outs
- Watch-outs: built in 1910 — expect roof / HVAC / electrical / plumbing capex.
- Climate carrying-cost: moderate wind risk, 23% chance of damaging wind over 30y; extreme-heat days projected 7→20/yr by 2055 (HVAC capex compounding) — expect insurance premiums to compound above CPI over the hold.
Questions for the listing agent
- It's been on market 196 days. Have you received any prior offers? Is the seller open to a 12% concession, seller financing, or rate buy-down credit?
- Built in 1910 — when were the roof, HVAC, electrical panel, plumbing, and water heater last replaced?
- Why hasn't it sold? Are there any deal-killer items the seller is aware of (foundation, flood, title, zoning, code violations)?
- Is there a deadline driving the sale (1031 exchange, divorce, estate, relocation)? That informs how much negotiation room exists.
- Schools are F-rated, which usually means shorter tenancies and higher turnover. Who's the typical renter profile here, and what's been the actual vacancy rate?
- Crime grade is F in this area — have there been break-ins, vandalism, or insurance claims at this property in the last 3 years? What carrier currently insures it and at what premium?
- The area grade is low — what's the realistic commute time and amenity access for the typical tenant pool here? Any planned neighborhood developments (good or bad) we should know about?
- What's the average days-on-market for RENTAL listings here right now (not sales)? A rising rental-DOM trend means longer vacancies and softer asking-rent achievability than the comps imply.
- What's the recent tenant-quality profile in this submarket — average credit score on applications, eviction rate, late-payment / NSF rate, and stable-employment percentage? A property-management company in the area should have these aggregated.
- How much new for-sale + rental construction is in the pipeline within 1–3 miles? Heavy new supply typically softens prices + rents 12–24 months out; constrained supply supports both.
Investment metrics
- 1% rule
- 0.93% ✗
- Cap rate
- 6.81%
- Cash-on-cash
- 1.86%
- DSCR
- 1.08
- GRM
- 9.0
CMA / ARV
- ARV (on-the-fly)
- $312,444
- Comps found
- 8
Show comp detail 8 sales within ~0.75 mi
| Address | Dist | Beds/Ba | Sqft | Sold | Price | $/sf | Match |
|---|---|---|---|---|---|---|---|
| 709 Austin Ave | 0.00mi | 4/2.5 | 3,152 (-0%) | 1mo | $211,000 | $67 | 93 |
| 820 River Bluff Dr | 0.56mi | 4/3.5 | 3,148 (-0%) | 0mo | $497,000 | $158 | 63 |
| 818 Alabama Ct | 0.24mi | 5/2.0 (+1) | 3,274 (+4%) | 16mo | $238,500 | $73 | 60 |
| 801 Montgomery Ave | 0.12mi | 4/2.5 | 3,541 (+12%) | 12mo | $380,000 | $107 | 58 |
| 604 N Nashville Ave | 0.23mi | 5/6.0 (+1) | 3,000 (-5%) | 6mo | $247,000 | $82 | 56 |
| 830 Riverbluff Dr | 0.51mi | 4/3.5 | 3,013 (-4%) | 10mo | $325,500 | $108 | 51 |
| 911 N Raleigh Ave | 0.16mi | 5/3.5 (+1) | 2,774 (-12%) | 10mo | $255,000 | $92 | 49 |
| 425 Park Blvd | 0.31mi | 3/2.0 (-1) | 2,728 (-14%) | 20mo | $270,000 | $99 | 37 |
Match score weights: distance 35% · size 25% · config 20% · recency 20%. Top-matched comps best support the ARV.
Projected returns pro-forma
-3.0% appreciation · 3.0% rent growth · sell at horizon
- IRR
- -13.3%
- Equity multiple
- 0.52×
- Total profit
- $-26,725
- Equity at exit
- $29,672
- IRR
- -4.4%
- Equity multiple
- 0.71×
- Total profit
- $-16,084
- Equity at exit
- $17,206
Cash invested: $55,720 (down + closing). Projections, not guarantees.
Landlord ↔ Tenant lean methodology
- Overall (STATE)
- 90 Strongly Landlord-Friendly
- State Alabama
- 90 Strongly Landlord-Friendly · R+15
- County
- — inherits STATE
- City
- — inherits STATE
ZIP-level market 35660
- Home prices YoY
- -29.5%
- Active inventory
- 115
- Price-to-rent
- 9.0×
Monthly cashflow live
- Estimated rent
- $1,850 medium interval (Pro) →
- Mortgage (P&I)
- −$1,044
- Tax est. 1.5%
- −$249 /mo · $2,985/yr
- Insurance
- −$83
- HOA
- −$0
- Vacancy / Maint / Mgmt
- −$388
- Net cashflow
- $86
Break-even live
UW: 25.0% down · 7.5% · 30yr · 1.5% tax · 5.0% vac · 8.0% maint · 8.0% mgmt
Financing live
Cash to close
- Down payment
- $49,750
- Closing costs
- $5,970
- Reserves months
- —
- Total cash needed
- —
Loan-product check · same deal, 3 products live
Conventional
25% down · 7.5% · 30yr
- Down + closing
- —
- Monthly P&I
- —
- Monthly cashflow
- —
- DSCR
- —
- Eligible?
- —
Personal DTI + credit; lowest rate.
DSCR
20% down · 8.5% · 30yr
- Down + closing
- —
- Monthly P&I
- —
- Monthly cashflow
- —
- DSCR
- —
- Eligible?
- —
No personal income docs; deal must DSCR.
Hard money
10% down · 12.0% · 12mo
- Down + closing
- —
- Monthly P&I
- —
- Monthly cashflow
- —
- DSCR
- —
- Eligible?
- —
Short-term bridge; refi at stabilization.
Rent comps 1 comps
| Address | Beds | Baths | Sqft | Rent | $/sqft | DOM | Units | Dist |
|---|---|---|---|---|---|---|---|---|
| 1211 N Nashville Ave Sheffield, AL | 5.0 | 3.0 | 2567 | $1,850 | $0.72 | 43d | 1 | 0.39mi |
Listing history 19 events
-
2026-04-15status Pending
-
2026-04-03price $199,000
-
2026-02-24price $212,000
-
2025-10-15price $219,999
-
2025-10-01$235,000 Active
-
2025-09-11status Active
-
2025-09-03status Pending
-
2025-08-28price $235,000
-
2025-07-19price $245,000
-
2025-05-17price $255,000
-
2025-04-22price $265,000
-
2025-04-03price $289,000
-
2025-03-07price $299,000
-
2025-02-15price $304,900
-
2025-01-18$319,900 Active
-
2024-03-28soldstatus $60,000
-
2024-03-27soldstatus $35,000
-
2024-03-26$79,000 Active
-
2020-03-16soldstatus $186,000
ⓘ Source: listings_history table (triggers on properties + properties_extension) + one-shot
backfill from property_details.listing_events for pre-trigger history.
Climate risk First Street
- Flood 1/10 Low FEMA zone X (unshaded) · 0% chance over 30 yrs
- Wildfire 1/10 Low
- Heat 6/10 Major 7 d/yr ≥108°F today · 20 d/yr by 30 yrs out
- Wind 5/10 Major 23% chance of damaging wind over 30 yrs
- Air quality 2/10 Low 0 unhealthy d/yr today · 1 by 30 yrs out
Nearby sold comps map
Loading sold comps map…
Walkable amenities ~0.75 mi
Loading nearby amenities…
Taxation est. · year 1
- Rental income
- $22,200
- − Mortgage interest
- −$11,147
- − Property taxes
- −$2,985
- − Insurance
- −$995
- − Repairs & maintenance
- −$1,776
- − Management
- −$1,776
- − Depreciation
- −$5,789
- Taxable loss
- −$2,268
- Est. tax savings @ 24.0%
- +$544
- After-tax cash flow
- $1,579/yr
For passive investors: Depreciation is non-cash, so a rental often shows a tax loss while cash-flowing — sheltering income. Rental losses are passive: they offset passive income freely, and up to $25,000/yr can offset ordinary (W-2) income if you actively participate and your MAGI is under $100k (phasing out to $0 by $150k); unused losses carry forward. On sale, claimed depreciation is recaptured at up to 25%, and gains may owe capital-gains tax (a 1031 exchange can defer both). Figures are a year-1 estimate at your 24.0% rate — not tax advice; consult a CPA.
Schools (NCES district)
- District
- Sheffield City
- NCES district ID
- 0103000
- Math proficiency
- 12% ▼ -30.00%
- Reading proficiency
- 34% ▼ -1.00%
- Median HH income
- $34,188
- Composite
- 18.8/100
- National rank
- #8866
- State rank
- #103 of 129 in AL
Livability — Sheffield
- Score
- 60/100
- State rank
- #312
- US rank
- #19366
Category grades
Schools grade is shown separately in the Schools card above.
Census & demographics
- Census place
- Sheffield, AL
- City population
- 9,385
- Population (ZIP)
- 9,385
Population outlook (Colbert County) Hauer SSP2
- Today (2025)
- 54,154 people
- By 2030
- 53,746 · -0.8%
- By 2040
- 52,431 · -3.2%
- By 2050
- 50,303 · -7.1%
- By 2075
- 44,789 · -17.3%
- By 2100
- 36,676 · -32.3%
Race, ethnicity, and origin ACS 2023
- Neighborhood character
- Predominantly White (68%)
- Race & ethnicity
- White 68% Black 26% Two or more races 4% Hispanic / Latino 2%
- Common ancestry
- Slovak 1% Lithuanian 1% Serbian 1%
- Foreign-born
- 1% · Canada
- Languages at home
- 98% English-only · Spanish 2%
Political lean MEDSL · Colbert
- 2024 margin
- Solid R (+46.4) · D 26.4% · R 72.8%
- 2008→2024 swing
- -26.2pp toward R · 2008: -20.3pp · 2024: -46.4pp
- All cycles
- 2024: R+46.4 2020: R+38.9 2016: R+38.3 2012: R+20.4 2008: R+20.3
Not yet ingested
- Civics
- —
Market trends
- HPI YoY
- ▼ -74.23%
- Current HPI
- 177.3226
- Rent YoY
- —
- Metro
- —
- State GDP YoY
- ▲ 2.94%
- F500 in state
- 4
Industry mix (Fortune 500 HQ in AL)
| Industry | F500 HQs | Revenue |
|---|---|---|
| Financial Services | 1 | $8B |
|
||
| Healthcare | 1 | $5B |
|
||
Price history
+7.0% since first listed19 events — show timeline
- 2026-04-15 Pending — SAARMLS
- 2026-04-03 Price Changed $199,000 SAARMLS
- 2026-02-24 Price Changed $212,000 SAARMLS
- 2025-10-15 Price Changed $219,999 SAARMLS
- 2025-10-01 Listed $235,000 SAARMLS
- 2025-09-11 Relisted — SAARMLS
- 2025-09-03 Pending — SAARMLS
- 2025-08-28 Price Changed $235,000 SAARMLS
- 2025-07-19 Price Changed $245,000 SAARMLS
- 2025-05-17 Price Changed $255,000 SAARMLS
- 2025-04-22 Price Changed $265,000 SAARMLS
- 2025-04-03 Price Changed $289,000 SAARMLS
- 2025-03-07 Price Changed $299,000 SAARMLS
- 2025-02-15 Price Changed $304,900 SAARMLS
- 2025-01-18 Listed $319,900 SAARMLS
- 2024-03-28 Sold (Public Records) $60,000 Public Records
- 2024-03-27 Sold (Public Records) $35,000 Public Records
- 2024-03-26 Listed $79,000 SAARMLS
- 2020-03-16 Sold (Public Records) $186,000 Public Records
Property tax history
+5.0%/yrLatest (2025): $398 · +70.8% YoY. Source: county tax records.
Cash-flow waterfall
monthlySold comps — $/sqft
last 12 mo · ≤1 miLoading sold comps…