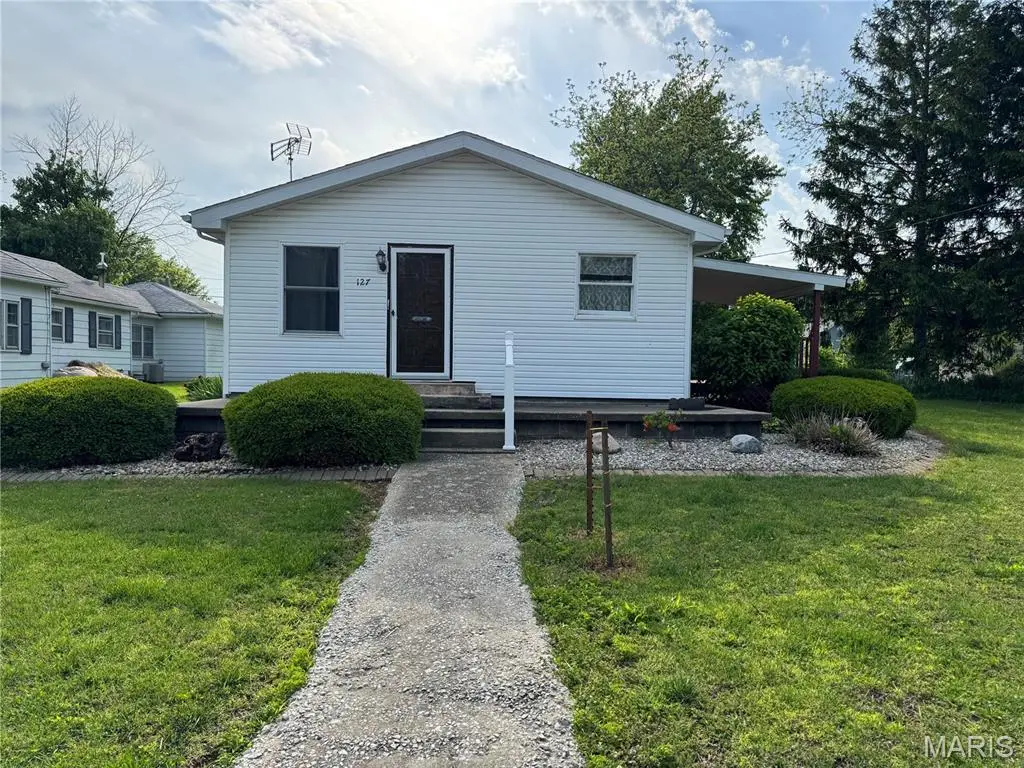
127 Hilton Ave · Panama, IL
Flood risk 1/10 · Minimal
- FEMA flood zone
- —
- Chance of flooding over 30 yrs
- 0.0%
- Est. flood insurance / yr
- —
Fire risk 1/10 · Minimal
- Est. fire insurance / yr
- $804 – $1,492
Heat risk 4/10 · Minor
- Hot days now (above 107°F)
- 7 days/yr
- Hot days in 30 yrs
- 20 days/yr
Wind risk 2/10 · Minimal
- Chance of severe wind over 30 yrs
- 1.0%
Air-quality risk 3/10 · Minor
- Unhealthy air days now
- 2 days/yr
- Unhealthy air days in 30 yrs
- 3 days/yr
Risk factors via First Street. Map © Google.
Why this score? — see what drove the B grade
The composite is a weighted blend of 9 inputs, each scored 0–100. Each bar is that input's sub-score; the figure is the points it added to the 100-point composite (weight × sub-score).
- Cash flow +30.0/30.0
- 1% rule +10.0/10.0
- DSCR +10.0/10.0
- ARV discount +8.6/15.0
- Appreciation +5.0/10.0
- Livability +2.8/5.0
- Rent growth +2.5/5.0
- Condition / age +2.5/5.0
- Schools +2.4/10.0
$68,000
🖨 Deal sheet 📄 Offer letter ✓ Due diligence
Listing remarks
Come and see this adorable three bedroom, one bath home in Panama! With just some paint, this move-in ready home features recent updates, including new flooring throughout and some bathroom updates. Along with these recent updates, this home offers a nice sized kitchen pantry, as well as storage closets throughout. Outside, you will find a nice covered patio to enjoy comfortable outdoor living. The attractive landscaping adds nice curb appeal and is low maintenance. You will also find a ten by twenty shed could be used as a hobby shed or safe storing. You do NOT want to miss the opportunities this home has to offer!
Key facts
- Kitchen pantry
- New flooring
- Covered patio
Tags
Property features AI
Finance
- Other: Living area reported as 1,056 (source: public records)
Exterior
- Parking: Alley access; Gravel parking
- Utilities: Public water; Public sewer; Electric service by Ameren; Cable available; Phone available; Electricity connected; Natural gas connected; Sewer connected
- Home design: Single-family residence, updated/remodeled; One story
- Construction: Vinyl siding exterior; Architectural shingle roof; Crawl space foundation; Built/updated (year source: owner)
- Exterior features: Covered patio/porch; Deck; Side porch; Entry steps/stairs; Storage; Outbuilding; Rectangular lot with some trees; Asphalt road frontage on a city street
Interior
- Kitchen: Built-in gas oven; Range hood; Eat-in kitchen with pantry and walk-in pantry
- Bedrooms: Three bedrooms, all on the main level
- Flooring: Carpet; Laminate
- Bathrooms: One full bathroom (main level)
- Heating & cooling: Natural gas heating; Central air conditioning
- Interior features: Built-in features; Eat-in kitchen; Laminate counters; Pantry; Walk-in pantry; Patio
- Laundry & utility: Washer/dryer included; Gas dryer hookup; Laundry closet; Common area laundry access
Neighborhood map
What this means for you Summary
Snapshot
- This is a 3-bed/1.0-bath single-family listed at $68k.
Deal economics
- At list price, monthly cash flow is $382 ($5k/yr) — positive.
- The deal already cash-flows at list — no discount required.
- Meets the 1% rule at list price ($1k rent vs $68k).
Location & tenants
- Location reads 56/100 on livability (#1,230 in IL) — a working-class tenant base; expect higher turnover. Strengths: cost of living A+, housing A+; Watch: employment C-, crime D-, amenities F.
- Hillsboro CUSD 3 (town): math 20% / reading 36% proficiency, ranked #282 of 620 in IL (top 46%) — low school quality limits family demand, transient renter base, plan for 1-2y turnover.
- Zoned schools: Hillsboro High School (math 12% / reading 17%, grade F, #479 of 693 statewide, top 71%, 468 students, 0% FRL) — zoned schools average 0% FRL vs 44% district-wide (44 pts lower); this property's tenant base skews higher-income than the district average.
- Zoned-school proficiency averages 14% at this address vs 28% district-wide (-14 pts) — the specific schools serving this property underperform the Hillsboro CUSD 3 average; the district grade overstates school quality for this exact location.
- Market conditions: 2 active listings in the ZIP; 12 units permitted in Montgomery County in 2024 (0 in 5+ unit buildings).
Forward outlook
- In year one you build about $3k of equity ($470 loan paydown + $2k appreciation (3.0% local appreciation)).
- Montgomery County population projected at -20% by 2050 — secular population decline; favor cash flow + early exit over multi-decade hold.
- At projected returns (3.0% appreciation + 3.0% rent growth), your $19k cash investment doubles in ~3 years — after that, you're playing with house money.
Negotiation context
- Only 2 days on market — expect competitive offers; lowballing is unlikely to land.
- Current owner paid $28k; list at $68k implies a 147% gain — meaningful room to come down on a strong offer.
Questions for the listing agent
- Built in 1975 — when were the roof, HVAC, electrical panel, plumbing, and water heater last replaced?
- Is there a deadline driving the sale (1031 exchange, divorce, estate, relocation)? That informs how much negotiation room exists.
- Schools are F-rated, which usually means shorter tenancies and higher turnover. Who's the typical renter profile here, and what's been the actual vacancy rate?
- Crime grade is D in this area — have there been break-ins, vandalism, or insurance claims at this property in the last 3 years? What carrier currently insures it and at what premium?
- What's the average days-on-market for RENTAL listings here right now (not sales)? A rising rental-DOM trend means longer vacancies and softer asking-rent achievability than the comps imply.
- What's the recent tenant-quality profile in this submarket — average credit score on applications, eviction rate, late-payment / NSF rate, and stable-employment percentage? A property-management company in the area should have these aggregated.
- How much new for-sale + rental construction is in the pipeline within 1–3 miles? Heavy new supply typically softens prices + rents 12–24 months out; constrained supply supports both.
Investment metrics
- 1% rule
- 1.59% ✓
- Cap rate
- 13.04%
- Cash-on-cash
- 24.10%
- DSCR
- 2.07
- GRM
- 5.3
CMA / ARV
- ARV (on-the-fly)
- $69,696
- Comps found
- 3
Show comp detail 3 sales within ~0.75 mi
| Address | Dist | Beds/Ba | Sqft | Sold | Price | $/sf | Match |
|---|---|---|---|---|---|---|---|
| 127 Hilton Ave | 0.00mi | 3/1.0 | 1,056 (0%) | 0mo | $68,000 | $64 | 100 |
| 113 Hickory St | 0.29mi | 2/1.0 (-1) | 1,098 (+4%) | 0mo | $72,000 | $66 | 75 |
| 608 North Ave | 0.44mi | 2/1.0 (-1) | 912 (-14%) | 11mo | $85,000 | $93 | 43 |
Match score weights: distance 35% · size 25% · config 20% · recency 20%. Top-matched comps best support the ARV.
Projected returns pro-forma
3.0% appreciation · 3.0% rent growth · sell at horizon
- IRR
- 30.2%
- Equity multiple
- 2.71×
- Total profit
- $32,558
- Equity at exit
- $30,576
- IRR
- 30.6%
- Equity multiple
- 5.30×
- Total profit
- $81,811
- Equity at exit
- $47,121
Cash invested: $19,040 (down + closing). Projections, not guarantees.
Landlord ↔ Tenant lean methodology
- Overall (STATE)
- 43 Moderately Tenant-Leaning
- State Illinois
- 43 Moderately Tenant-Leaning · D+7
- County
- — inherits STATE
- City
- — inherits STATE
ZIP-level market 62077
- Active inventory
- 2
- Price-to-rent
- 5.3×
Monthly cashflow live
- Estimated rent
- $1,079 medium interval (Pro) →
- Mortgage (P&I)
- −$357
- Tax est. 1.5%
- −$85 /mo · $1,020/yr
- Insurance
- −$28
- HOA
- −$0
- Vacancy / Maint / Mgmt
- −$227
- Net cashflow
- $382
Break-even live
UW: 25.0% down · 7.5% · 30yr · 1.5% tax · 5.0% vac · 8.0% maint · 8.0% mgmt
Financing live
Cash to close
- Down payment
- $17,000
- Closing costs
- $2,040
- Reserves months
- —
- Total cash needed
- —
Loan-product check · same deal, 3 products live
Conventional
25% down · 7.5% · 30yr
- Down + closing
- —
- Monthly P&I
- —
- Monthly cashflow
- —
- DSCR
- —
- Eligible?
- —
Personal DTI + credit; lowest rate.
DSCR
20% down · 8.5% · 30yr
- Down + closing
- —
- Monthly P&I
- —
- Monthly cashflow
- —
- DSCR
- —
- Eligible?
- —
No personal income docs; deal must DSCR.
Hard money
10% down · 12.0% · 12mo
- Down + closing
- —
- Monthly P&I
- —
- Monthly cashflow
- —
- DSCR
- —
- Eligible?
- —
Short-term bridge; refi at stabilization.
Listing history 3 events
-
2026-05-07status Pending
-
2026-05-04$68,000 Active
-
1999-03-01soldstatus $27,500
ⓘ Source: listings_history table (triggers on properties + properties_extension) + one-shot
backfill from property_details.listing_events for pre-trigger history.
Climate risk First Street
- Flood 1/10 Low 0% chance over 30 yrs
- Wildfire 1/10 Low
- Heat 4/10 Moderate 7 d/yr ≥107°F today · 20 d/yr by 30 yrs out
- Wind 2/10 Low 100% chance of damaging wind over 30 yrs
- Air quality 3/10 Moderate 2 unhealthy d/yr today · 3 by 30 yrs out
Nearby sold comps map
Loading sold comps map…
Walkable amenities ~0.75 mi
Loading nearby amenities…
Taxation est. · year 1
- Rental income
- $12,946
- − Mortgage interest
- −$3,809
- − Property taxes
- −$1,020
- − Insurance
- −$340
- − Repairs & maintenance
- −$1,036
- − Management
- −$1,036
- − Depreciation
- −$1,978
- Taxable income
- $3,727
- Est. tax owed @ 24.0%
- −$894
- After-tax cash flow
- $3,693/yr
For passive investors: Depreciation is non-cash, so a rental often shows a tax loss while cash-flowing — sheltering income. Rental losses are passive: they offset passive income freely, and up to $25,000/yr can offset ordinary (W-2) income if you actively participate and your MAGI is under $100k (phasing out to $0 by $150k); unused losses carry forward. On sale, claimed depreciation is recaptured at up to 25%, and gains may owe capital-gains tax (a 1031 exchange can defer both). Figures are a year-1 estimate at your 24.0% rate — not tax advice; consult a CPA.
Schools (NCES district)
- District
- Hillsboro CUSD 3
- NCES district ID
- 1719200
- Math proficiency
- 20% ▼ -4.00%
- Reading proficiency
- 36% ▼ -7.00%
- Median HH income
- $43,744
- Composite
- 23.89/100
- National rank
- #7794
- State rank
- #282 of 620 in IL
Livability — Panama
- Score
- 56/100
- State rank
- #1230
- US rank
- #23048
Category grades
Schools grade is shown separately in the Schools card above.
Census & demographics
- Census place
- Panama, IL
- Population (ZIP)
- 327
Population outlook (Montgomery County) Hauer SSP2
- Today (2025)
- 27,471 people
- By 2030
- 26,410 · -3.9%
- By 2040
- 24,233 · -11.8%
- By 2050
- 21,948 · -20.1%
- By 2075
- 16,686 · -39.3%
- By 2100
- 11,369 · -58.6%
Race, ethnicity, and origin ACS 2023
- Neighborhood character
- Predominantly White (99%)
- Race & ethnicity
- White 99%
- Common ancestry
- Lithuanian 1% Scotch-Irish 1% Italian 1%
- Foreign-born
- 0% · Canada
- Languages at home
- 97% English-only · Other Indo-European 2% Spanish 1%
Political lean MEDSL · Montgomery
- 2024 margin
- Solid R (+44.0) · D 27.1% · R 71.1% · Other 1.8%
- 2008→2024 swing
- -46.7pp toward R · 2008: 2.6pp · 2024: -44.0pp
- All cycles
- 2024: R+44.0 2020: R+41.0 2016: R+40.0 2012: R+14.2 2008: D+2.6
Not yet ingested
- Civics
- —
Market trends
- HPI YoY
- —
- Current HPI
- —
- Rent YoY
- —
- Metro
- —
- State GDP YoY
- ▲ 1.59%
- F500 in state
- 60
Industry mix (Fortune 500 HQ in IL)
| Industry | F500 HQs | Revenue |
|---|---|---|
| Insurance | 4 | $201B |
|
||
| Consumer Goods | 4 | $87B |
|
||
| Industrial Machinery | 3 | $64B |
|
||
| Healthcare | 2 | $55B |
|
||
| Retail / Pharmacy | 1 | $148B |
|
||
| Agriculture / Food | 1 | $86B |
|
||
Price history
+147.3% since first listed3 events — show timeline
- 2026-05-07 Pending — MARIS as Distributed by MLS Grid
- 2026-05-04 Listed $68,000 MARIS as Distributed by MLS Grid
- 1999-03-01 Sold (Public Records) $27,500 Public Records
Property tax history
-1.4%/yrLatest (2024): $121 · -4.7% YoY. Source: county tax records.
Cash-flow waterfall
monthlySold comps — $/sqft
last 12 mo · ≤1 miLoading sold comps…