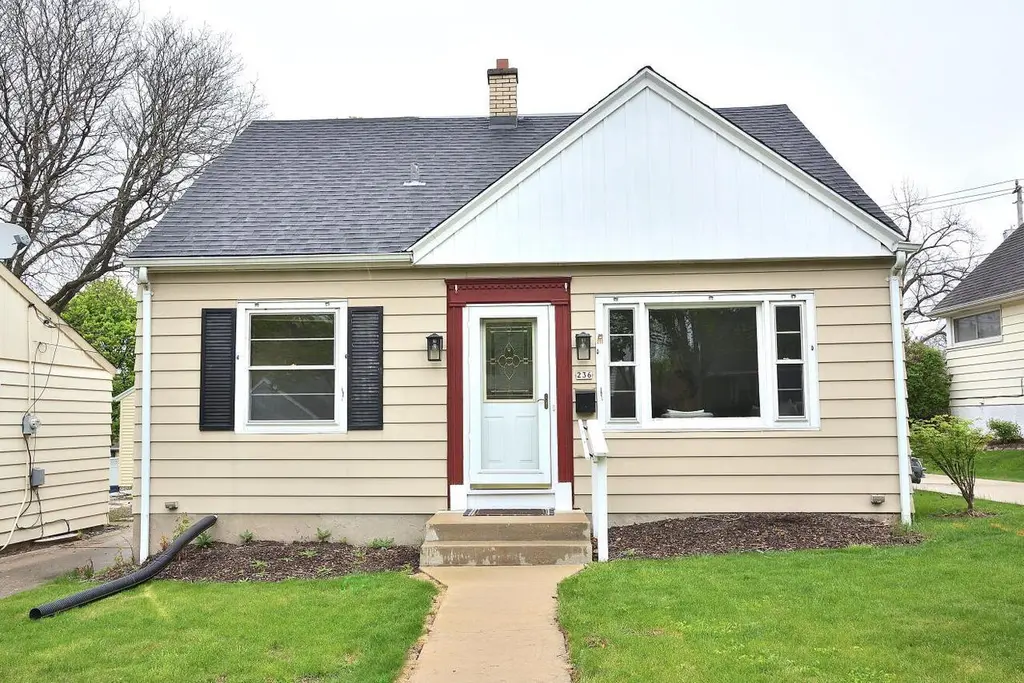
236 N 90th St · Milwaukee, WI
Flood risk 1/10 · Minimal
- FEMA flood zone
- X (unshaded)
- Chance of flooding over 30 yrs
- 0.0%
- Est. flood insurance / yr
- $473 – $860
Fire risk 1/10 · Minimal
- Est. fire insurance / yr
- $636 – $1,182
Heat risk 2/10 · Minimal
- Hot days now (above 101°F)
- 7 days/yr
- Hot days in 30 yrs
- 13 days/yr
Wind risk 2/10 · Minimal
- Chance of severe wind over 30 yrs
- —
Air-quality risk 2/10 · Minimal
- Unhealthy air days now
- 1 days/yr
- Unhealthy air days in 30 yrs
- 1 days/yr
Risk factors via First Street. Map © Google.
Why this score? — see what drove the B- grade
The composite is a weighted blend of 9 inputs, each scored 0–100. Each bar is that input's sub-score; the figure is the points it added to the 100-point composite (weight × sub-score).
- Cash flow +24.8/30.0
- ARV discount +15.0/15.0
- DSCR +8.0/10.0
- 1% rule +6.4/10.0
- Livability +4.0/5.0
- Rent growth +3.3/5.0
- Condition / age +2.5/5.0
- Schools +1.2/10.0
- Appreciation +0.0/10.0
$299,900
🖨 Deal sheet 📄 Offer letter ✓ Due diligence
Listing remarks
Welcome to this charming Cannon Park home with 4 bedrooms, 1 full and 2 half baths. Sunlight fills the inviting living room, while the spacious family room with new carpet and wood-burning stove offers a cozy retreat. Bright dinette, comfortable kitchen, and gleaming hardwood floors add warmth and character. Upstairs features a primary bedroom with powder room and adjoining walk-through 4th bedroom--ideal for a private suite, office, or nursery. Enjoy the large deck overlooking a generous backyard with shed. Updates include new roof (home & garage, 2025), furnace & A/C (2019), fresh paint, refinished floors and new lighting. Prime location near freeway access, Froedtert &
Key facts
- 7,405 sq ft lot
- Garage
- Built 1951
Property features AI
Finance
- Other: Estimated living area range: 1,251–1,500 sq ft
Exterior
- Parking: Detached 1-car garage with opener; Total of 1.5 garage parking spaces
- Utilities: Municipal water; Municipal sewer; Natural gas
- Home design: 1.5-story single-family home; Residential zoning; Assessor/public record used for year built
- Construction: Aluminum/aluminum-steel exterior
- Exterior features: Deck; Sidewalks
Interior
- Kitchen: Range; Refrigerator; Dishwasher; Garbage disposal
- Bedrooms: Primary bedroom (upper) about 14 x 11; Bedroom 2 (main) about 11 x 11; Bedroom 3 (main) about 12 x 8; Bedroom 4 (upper) about 14 x 11
- Flooring: Wood floors; Ceramic tile (bath)
- Bathrooms: One full bathroom with shower over tub; Two half baths; Ceramic tile and master bedroom bath
- Heating & cooling: Forced air heating (natural gas); Central air conditioning
- Interior features: Cable/satellite available; Walk-thru bedroom; Wood floors; Full block basement
- Laundry & utility: Washer; Dryer
Neighborhood map
What this means for you Summary
Snapshot
- This is a 4-bed/1.0-bath single-family listed at $300k.
Deal economics
- At list price, monthly cash flow is $633 ($8k/yr) — positive.
- The deal already cash-flows at list — no discount required.
- Meets the 1% rule at list price ($3k rent vs $300k).
- Recommended offer: $295k (1.5% below list) — sets the bar for market timing.
- Cap rate 8.8% vs local median 5.1% in Milwaukee — top-decile yield for the area; either an underpriced asset or a hidden risk that comps aren't pricing in. Stress-test before assuming the spread holds.
Location & tenants
- Location reads 81/100 on livability (#55 in WI, #1,534 nationally) — a professional / high-income tenant draw. Strengths: amenities A+, commute A+, cost of living A+; Watch: employment D+, schools F, crime F.
- Milwaukee School District (urban): math 10% / reading 18% proficiency, ranked #337 of 342 in WI (top 98%) — low school quality limits family demand, transient renter base, plan for 1-2y turnover; 77% free/reduced lunch — lower-income household profile, screen leases tightly.
- Market conditions: Rents rising (+3.3%/yr); 36 active listings in the ZIP; 4 comparable units currently listed for rent nearby; rentals leasing fast (median 12d on market — plan ~1-2 weeks tenant-placement turnaround); solid renter incomes; 1,017 units permitted in Milwaukee County in 2024 (803 in 5+ unit buildings).
- This rent runs 44% of the median local income ($93k/yr) — at the standard rent-burdened threshold; future hikes will face affordability resistance.
Forward outlook
- Local home prices are declining (-3.0%/yr); year-one equity from $2k of loan paydown is wiped out by about $9k of value loss. Plan a longer hold.
- Milwaukee County population projected at +4% by 2050 — modest demand growth; plan on rents tracking national, not racing it.
Negotiation context
- It's been on market 17 days — a 2% lower offer ($295k) is reasonable based on typical stale-listing flexibility.
Risks & watch-outs
- Watch-outs: built in 1951 — expect roof / HVAC / electrical / plumbing capex.
Questions for the listing agent
- Built in 1951 — when were the roof, HVAC, electrical panel, plumbing, and water heater last replaced?
- Is there a deadline driving the sale (1031 exchange, divorce, estate, relocation)? That informs how much negotiation room exists.
- Schools are F-rated, which usually means shorter tenancies and higher turnover. Who's the typical renter profile here, and what's been the actual vacancy rate?
- Crime grade is F in this area — have there been break-ins, vandalism, or insurance claims at this property in the last 3 years? What carrier currently insures it and at what premium?
- What's the average days-on-market for RENTAL listings here right now (not sales)? A rising rental-DOM trend means longer vacancies and softer asking-rent achievability than the comps imply.
- What's the recent tenant-quality profile in this submarket — average credit score on applications, eviction rate, late-payment / NSF rate, and stable-employment percentage? A property-management company in the area should have these aggregated.
- How much new for-sale + rental construction is in the pipeline within 1–3 miles? Heavy new supply typically softens prices + rents 12–24 months out; constrained supply supports both.
Investment metrics
- 1% rule
- 1.14% ✓
- Cap rate
- 8.83%
- Cash-on-cash
- 9.05%
- DSCR
- 1.40
- GRM
- 7.3
CMA / ARV
- ARV (median comp)
- $372,400
- List price
- $299,900
- Delta
- -19.47%
- Verdict
- UNDERPRICED
- Comps
- 20 within 1.0 mi
Show comp detail 12 sales within ~0.75 mi
| Address | Dist | Beds/Ba | Sqft | Sold | Price | $/sf | Match |
|---|---|---|---|---|---|---|---|
| 236 N 90th St | 0.00mi | 4/2.0 | 1,461 (0%) | 0mo | $327,000 | $224 | 96 |
| 210 N 90th St | 0.04mi | 3/2.0 (-1) | 1,410 (-4%) | 1mo | $387,500 | $275 | 83 |
| 9034 W Mt Vernon Ave | 0.07mi | 3/2.0 (-1) | 1,377 (-6%) | 0mo | $405,000 | $294 | 78 |
| 9131 W Mt Vernon Ave | 0.14mi | 4/2.0 | 1,599 (+9%) | 1mo | $320,000 | $200 | 73 |
| 9020 W Hawthorne Ave | 0.20mi | 3/1.0 (-1) | 1,338 (-8%) | 0mo | $290,000 | $217 | 71 |
| 555 Robertson St | 0.39mi | 4/2.0 | 1,546 (+6%) | 4mo | $400,000 | $259 | 64 |
| 158 N 92nd St | 0.22mi | 3/2.0 (-1) | 1,307 (-10%) | 6mo | $261,000 | $200 | 58 |
| 170 S 80th St | 0.69mi | 3/1.5 (-1) | 1,425 (-2%) | 2mo | $340,000 | $239 | 55 |
| 610 N 99th St | 0.65mi | 3/1.0 (-1) | 1,332 (-9%) | 0mo | $350,000 | $263 | 49 |
| 8223 Portland Ave | 0.74mi | 4/1.5 | 1,629 (+12%) | 3mo | $439,000 | $269 | 42 |
| 422 S 94th Pl | 0.61mi | 4/1.0 | 1,242 (-15%) | 6mo | $170,000 | $137 | 41 |
| 161 S 79 St | 0.71mi | 3/1.5 (-1) | 1,607 (+10%) | 3mo | $287,250 | $179 | 40 |
Match score weights: distance 35% · size 25% · config 20% · recency 20%. Top-matched comps best support the ARV.
Projected returns pro-forma
-3.0% appreciation · 3.26% rent growth · sell at horizon
- IRR
- -2.3%
- Equity multiple
- 0.91×
- Total profit
- $-7,333
- Equity at exit
- $44,716
- IRR
- 7.7%
- Equity multiple
- 1.59×
- Total profit
- $49,439
- Equity at exit
- $25,930
Cash invested: $83,972 (down + closing). Projections, not guarantees.
Landlord ↔ Tenant lean methodology
- Overall (STATE)
- 73 Landlord-Friendly
- State Wisconsin
- 73 Landlord-Friendly · R+2
- County
- — inherits STATE
- City
- — inherits STATE
ZIP-level market 53226
- Rents YoY
- 3.3%
- Active inventory
- 36
- Price-to-rent
- 7.3×
Monthly cashflow live
- Estimated rent
- $3,424 medium interval (Pro) →
- Mortgage (P&I)
- −$1,573
- Tax from tax record
- −$375 /mo · $4,495/yr
- Insurance
- −$125
- HOA
- −$0
- Vacancy / Maint / Mgmt
- −$719
- Net cashflow
- $633
Break-even live
UW: 25.0% down · 7.5% · 30yr · 1.5% tax · 5.0% vac · 8.0% maint · 8.0% mgmt
Financing live
Cash to close
- Down payment
- $74,975
- Closing costs
- $8,997
- Reserves months
- —
- Total cash needed
- —
Loan-product check · same deal, 3 products live
Conventional
25% down · 7.5% · 30yr
- Down + closing
- —
- Monthly P&I
- —
- Monthly cashflow
- —
- DSCR
- —
- Eligible?
- —
Personal DTI + credit; lowest rate.
DSCR
20% down · 8.5% · 30yr
- Down + closing
- —
- Monthly P&I
- —
- Monthly cashflow
- —
- DSCR
- —
- Eligible?
- —
No personal income docs; deal must DSCR.
Hard money
10% down · 12.0% · 12mo
- Down + closing
- —
- Monthly P&I
- —
- Monthly cashflow
- —
- DSCR
- —
- Eligible?
- —
Short-term bridge; refi at stabilization.
Rent comps 4 comps
| Address | Beds | Baths | Sqft | Rent | $/sqft | DOM | Units | Dist |
|---|---|---|---|---|---|---|---|---|
| 185 N 90th St Milwaukee, WI | 3.0 | 1.5 | 1500 | $2,200 | $1.47 | 14d | 1 | 0.12mi |
| 1427 S 86th St West Allis, WI | 3.0 | 1.0 | 998 | $1,399 | $1.40 | 12d | 1 | 1.34mi |
| 7400 W State St Milwaukee, WI | 1.0–3.0 | 1.0–2.0 | 1106 | $3,995 | $3.61 | 2d | 8 | 1.38mi |
| 7474 Harwood Ave Wauwatosa, WI | 3.0 | 1.0–3.0 | 999 | $4,780 | $4.78 | 3d | 73 | 1.41mi |
Listing history 3 events
-
2026-05-09historical Contingent 738-char remark
-
2026-05-07$299,900 Active 738-char remark
-
2026-04-30historical $299,900 738-char remark
ⓘ Source: listings_history table (triggers on properties + properties_extension) + one-shot
backfill from property_details.listing_events for pre-trigger history.
Tax reassessment forecast WI · Partial reset (capped growth)
- Current annual tax
- $4,495 · $375/mo
- Projected year-2 tax
- $5,022 · $418/mo
- Expected delta
- +$526/yr (+$44/mo · 11.7%)
ⓘ Screening estimate from a state-policy table — verify with the county assessor before closing.
Climate risk First Street
- Flood 1/10 Low FEMA zone X (unshaded) · 0% chance over 30 yrs
- Wildfire 1/10 Low
- Heat 2/10 Low 7 d/yr ≥101°F today · 13 d/yr by 30 yrs out
- Wind 2/10 Low
- Air quality 2/10 Low 1 unhealthy d/yr today · 1 by 30 yrs out
Nearby sold comps map
Loading sold comps map…
Walkable amenities ~0.75 mi
Loading nearby amenities…
Taxation est. · year 1
- Rental income
- $41,092
- − Mortgage interest
- −$16,799
- − Property taxes
- −$4,495
- − Insurance
- −$1,500
- − Repairs & maintenance
- −$3,287
- − Management
- −$3,287
- − Depreciation
- −$8,724
- Taxable income
- $2,999
- Est. tax owed @ 24.0%
- −$720
- After-tax cash flow
- $6,876/yr
For passive investors: Depreciation is non-cash, so a rental often shows a tax loss while cash-flowing — sheltering income. Rental losses are passive: they offset passive income freely, and up to $25,000/yr can offset ordinary (W-2) income if you actively participate and your MAGI is under $100k (phasing out to $0 by $150k); unused losses carry forward. On sale, claimed depreciation is recaptured at up to 25%, and gains may owe capital-gains tax (a 1031 exchange can defer both). Figures are a year-1 estimate at your 24.0% rate — not tax advice; consult a CPA.
Schools (NCES district)
- District
- Milwaukee School District
- NCES district ID
- 5509600
- Math proficiency
- 10% ▼ -5.00%
- Reading proficiency
- 18% ▬ 0.00%
- Median HH income
- $36,339
- Composite
- 11.61/100
- National rank
- #9696
- State rank
- #337 of 342 in WI
Livability — Milwaukee
- Score
- 81/100
- State rank
- #55
- US rank
- #1534
Category grades
Schools grade is shown separately in the Schools card above.
Census & demographics
- Census place
- Milwaukee, WI
- County
- Milwaukee County · 926,379 people
- City population
- 573,768
- Metro
- Milwaukee-Waukesha, WI
- Population (ZIP)
- 18,908
- Household income
- $93,132
- Rent vs Own
- Severe rent burden
- 580.0
Population outlook (Milwaukee County) Hauer SSP2
- Today (2025)
- 995,758 people
- By 2030
- 1,009,124 · +1.3%
- By 2040
- 1,028,128 · +3.3%
- By 2050
- 1,040,066 · +4.4%
- By 2075
- 1,057,849 · +6.2%
- By 2100
- 1,039,774 · +4.4%
Race, ethnicity, and origin ACS 2023
- Neighborhood character
- Predominantly White (79%)
- Race & ethnicity
- White 79% Black 7% Hispanic / Latino 5% Asian 5% Two or more races 4%
- Hispanic origin (detail)
- Mexican 3%
- Common ancestry
- Romanian 10% Portuguese 4% Lithuanian 3%
- Foreign-born
- 6% · Canada, China
- Languages at home
- 92% English-only · Spanish 3% Chinese 1% Other Indo-European 1%
Political lean MEDSL · Milwaukee
- 2024 margin
- Solid D (+38.5) · D 68.3% · R 29.8% · Other 1.8%
- 2008→2024 swing
- +2.7pp toward D · 2008: 35.9pp · 2024: 38.5pp
- All cycles
- 2024: D+38.5 2020: D+39.9 2016: D+37.5 2012: D+34.6 2008: D+35.9
Not yet ingested
- Civics
- —
Market trends
- HPI YoY
- ▼ -227.28%
- Current HPI
- 253.6781
- Rent YoY
- ▲ 3.26%
- Metro
- Milwaukee-Waukesha, WI
- State GDP YoY
- ▲ 2.10%
- F500 in state
- 20
Industry mix (Fortune 500 HQ in WI)
| Industry | F500 HQs | Revenue |
|---|---|---|
| Industrial Machinery | 4 | $23B |
|
||
| Industrial Technology | 2 | $36B |
|
||
| Insurance | 1 | $36B |
|
||
| Professional Services | 1 | $19B |
|
||
| Utilities | 1 | $9B |
|
||
| Consumer Goods | 1 | $3B |
|
||
Price history
+9.0% since first listed5 events — show timeline
- 2026-06-12 Sold (MLS) $327,000 METROMLS
- 2026-05-24 Pending — METROMLS
- 2026-05-09 Contingent — METROMLS
- 2026-05-07 Listed $299,900 METROMLS
- 2026-04-30 Coming Soon $299,900 METROMLS
Property tax history
+0.6%/yrLatest (2024): $4,495 · +7.3% YoY. Source: county tax records.
Cash-flow waterfall
monthlySold comps — $/sqft
last 12 mo · ≤1 miLoading sold comps…