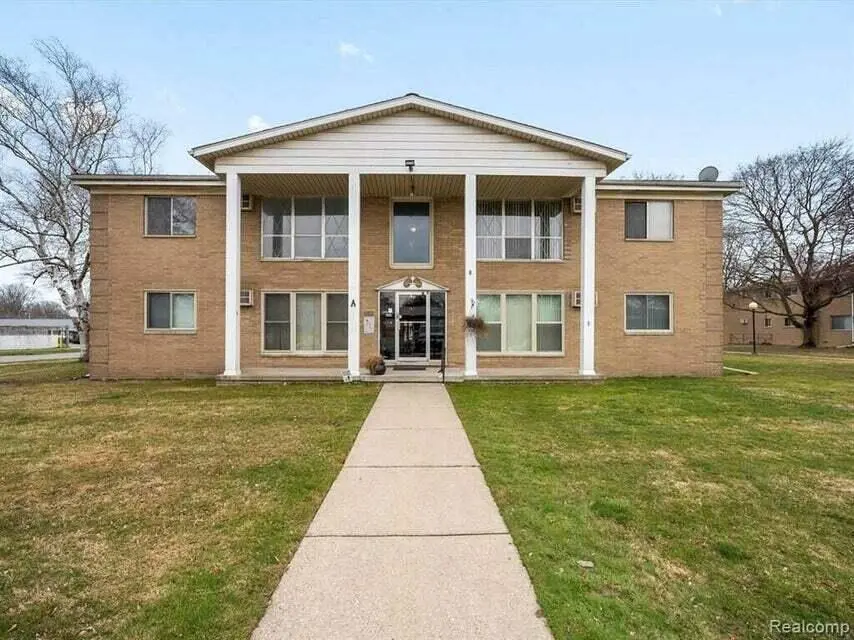
26305 W 7 Mile Unit A201 · Redford, MI
Flood risk No data
- FEMA flood zone
- —
- Chance of flooding over 30 yrs
- —
- Est. flood insurance / yr
- —
Fire risk No data
- Est. fire insurance / yr
- —
Heat risk No data
- Hot days now (above threshold)
- —
- Hot days in 30 yrs
- —
Wind risk No data
- Chance of severe wind over 30 yrs
- —
Air-quality risk No data
- Unhealthy air days now
- —
- Unhealthy air days in 30 yrs
- —
Risk factors via First Street. Map © Google.
Why this score? — see what drove the C- grade
The composite is a weighted blend of 9 inputs, each scored 0–100. Each bar is that input's sub-score; the figure is the points it added to the 100-point composite (weight × sub-score).
- Cash flow +20.2/30.0
- 1% rule +9.1/10.0
- ARV discount +7.5/15.0
- DSCR +6.4/10.0
- Rent growth +2.5/5.0
- Livability +2.5/5.0
- Condition / age +2.5/5.0
- Schools +1.4/10.0
- Appreciation +0.0/10.0
$92,500
🖨 Deal sheet 📄 Offer letter ✓ Due diligence
Listing remarks MLS
Updated two bedroom upper unit condo with large kitchen, newer carpet and windows. Stable complex with pool, gated parking and security cameras on site. Shared laundry facilities located in a common basement with an assigned storage cage. Agent to verify all information.
Key facts
- Security cameras
- Large kitchen
- Gated parking
Tags
Property features AI
Finance
- HOA & community: Monthly association fee of $295; Association covers water, sewer, trash, snow removal, and lawn/yard care
Exterior
- Utilities: Public water; Natural gas water heater; Public sewer
- Home design: Ranch-style condominium; Living area approximately 860
- Construction: Brick construction; Built in 1965
- Exterior features: Sidewalk; Paved road access; Public water
Interior
- Kitchen: Kitchen (12 x 12); Dishwasher; Microwave; Range
- Bedrooms: Primary bedroom (12 x 12); Second bedroom (12 x 11)
- Bathrooms: One full bathroom (10 x 10)
- Heating & cooling: Forced air heating
- Interior features: Six total rooms; Full basement
Neighborhood map
What this means for you Summary
Snapshot
- This is a 2-bed/1.0-bath condo listed at $92k.
Deal economics
- At list price, monthly cash flow is $117 ($1k/yr) — positive.
- The deal already cash-flows at list — no discount required.
- Meets the 1% rule at list price ($1k rent vs $92k).
- Recommended offer: $87k (6.0% below list) — sets the bar for market timing.
Location & tenants
- Location reads: area grade C — affects rentability + tenant quality, not the cash-flow math above.
- Redford Union Schools District No. 1 (suburban): math 8% / reading 23% proficiency, ranked #489 of 540 in MI (top 91%) — low school quality limits family demand, transient renter base, plan for 1-2y turnover; 66% free/reduced lunch — lower-income household profile, screen leases tightly.
- Market conditions: 86 active listings in the ZIP; 31 comparable units currently listed for rent nearby; rentals at typical pace (median 24d on market — plan ~3-4 weeks tenant-placement turnaround); 2,639 units permitted in Wayne County in 2024 (1,216 in 5+ unit buildings).
Forward outlook
- Local home prices are declining (-3.0%/yr); year-one equity from $640 of loan paydown is wiped out by about $3k of value loss. Plan a longer hold.
- Wayne County population projected at -17% by 2050 — secular population decline; favor cash flow + early exit over multi-decade hold.
Negotiation context
- It's been on market 80 days — a 6% lower offer ($87k) is reasonable based on typical stale-listing flexibility.
- 7 sale attempts since 3y ago with the ask held roughly flat each time — persistent listings suggest the price (not the market) is what's stuck; bring a comps-based counter.
- Current owner paid $68k; 36% above their basis — modest negotiation headroom, anchor on the comps not their cost.
Risks & watch-outs
- Watch-outs: HOA is 23% of rent.
Questions for the listing agent
- It's been on market 80 days. Have you received any prior offers? Is the seller open to a 6% concession, seller financing, or rate buy-down credit?
- Built in 1965 — when were the roof, HVAC, electrical panel, plumbing, and water heater last replaced?
- What does the HOA fee cover, when was the last increase, and are there any pending special assessments or reserve-fund shortfalls?
- Any open or pending special assessments — roof, HVAC, plumbing, elevator, façade? What's the per-unit balance and payoff schedule, and is the seller paying it off at close or rolling it to the buyer?
- Why hasn't it sold? Are there any deal-killer items the seller is aware of (foundation, flood, title, zoning, code violations)?
- Is there a deadline driving the sale (1031 exchange, divorce, estate, relocation)? That informs how much negotiation room exists.
- What's the average days-on-market for RENTAL listings here right now (not sales)? A rising rental-DOM trend means longer vacancies and softer asking-rent achievability than the comps imply.
- What's the recent tenant-quality profile in this submarket — average credit score on applications, eviction rate, late-payment / NSF rate, and stable-employment percentage? A property-management company in the area should have these aggregated.
- How much new apartment / multifamily construction is in the pipeline within 1–3 miles? Heavy new supply (>2% of stock underway) typically softens rents 12–24 months out; light construction supports rent growth.
Investment metrics
- 1% rule
- 1.41% ✓
- Cap rate
- 7.81%
- Cash-on-cash
- 5.42%
- DSCR
- 1.24
- GRM
- 5.9
CMA / ARV
No comps found within radius.
Projected returns pro-forma
-3.0% appreciation · 3.0% rent growth · sell at horizon
- IRR
- -7.7%
- Equity multiple
- 0.72×
- Total profit
- $-7,348
- Equity at exit
- $13,792
- IRR
- 2.1%
- Equity multiple
- 1.15×
- Total profit
- $3,967
- Equity at exit
- $7,998
Cash invested: $25,900 (down + closing). Projections, not guarantees.
Landlord ↔ Tenant lean methodology
- Overall (STATE)
- 62 Landlord-Friendly
- State Michigan
- 62 Landlord-Friendly · EVEN
- County
- — inherits STATE
- City
- — inherits STATE
ZIP-level market 48240
- Active inventory
- 86
- Price-to-rent
- 5.9×
Monthly cashflow live
- Estimated rent
- $1,308 high interval (Pro) →
- Mortgage (P&I)
- −$485
- Tax from tax record
- −$98 /mo · $1,174/yr
- Insurance
- −$39
- HOA
- −$295
- Vacancy / Maint / Mgmt
- −$275
- Net cashflow
- $117
Break-even live
UW: 25.0% down · 7.5% · 30yr · 1.5% tax · 5.0% vac · 8.0% maint · 8.0% mgmt
Financing live
Cash to close
- Down payment
- $23,125
- Closing costs
- $2,775
- Reserves months
- —
- Total cash needed
- —
Loan-product check · same deal, 3 products live
Conventional
25% down · 7.5% · 30yr
- Down + closing
- —
- Monthly P&I
- —
- Monthly cashflow
- —
- DSCR
- —
- Eligible?
- —
Personal DTI + credit; lowest rate.
DSCR
20% down · 8.5% · 30yr
- Down + closing
- —
- Monthly P&I
- —
- Monthly cashflow
- —
- DSCR
- —
- Eligible?
- —
No personal income docs; deal must DSCR.
Hard money
10% down · 12.0% · 12mo
- Down + closing
- —
- Monthly P&I
- —
- Monthly cashflow
- —
- DSCR
- —
- Eligible?
- —
Short-term bridge; refi at stabilization.
Rent comps 31 comps
| Address | Beds | Baths | Sqft | Rent | $/sqft | DOM | Units | Dist |
|---|---|---|---|---|---|---|---|---|
| 26539 Clarita Redford, MI | 3.0 | 1.5 | 931 | $1,875 | $2.01 | 24d | 1 | 0.21mi |
| 19354 Seminole Redford, MI | 3.0 | 1.0 | 1050 | $1,450 | $1.38 | 24d | 1 | 0.63mi |
| 18732 Salem Unit 2 Detroit, MI | 2.0 | 1.0 | 925 | $1,050 | $1.14 | 12d | 1 | 0.90mi |
| 25822 W 6 Mile Rd Redford Township, MI | 2.0 | 2.0 | 1100 | $1,100 | $1.00 | 24d | 1 | 0.99mi |
| 20524 Indian Redford, MI | 3.0 | 1.0 | 988 | $1,600 | $1.62 | 24d | 1 | 1.00mi |
| 20091 Inkster Rd Livonia, MI | 2.0 | 1.0 | 756 | $1,400 | $1.85 | 5d | 1 | 1.00mi |
| 18405 Gillman St Livonia, MI | 3.0 | 2.0 | 1014 | $1,950 | $1.92 | 5d | 1 | 1.12mi |
| 20083 Salem St Detroit, MI | 3.0 | 1.0 | 969 | $1,050 | $1.08 | 10d | 1 | 1.13mi |
| 20083 Salem St Detroit, MI | 3.0 | 1.0 | 969 | $1,050 | $1.08 | 4d | 1 | 1.13mi |
| 20410 Five Points St Redford, MI | 3.0 | 1.0 | 950 | $1,600 | $1.68 | 4d | 1 | 1.14mi |
| 17324 Salem St Detroit, MI | 2.0 | 1.0 | 989 | $1,200 | $1.21 | 24d | 1 | 1.19mi |
| 24224 W 7 Mile Rd Detroit, MI | 1.0–2.0 | 1.0 | 600 | $875 | $1.46 | 43d | 3 | 1.22mi |
| 18302 Wormer St Detroit, MI | 3.0 | 1.0 | 1046 | $1,475 | $1.41 | 43d | 1 | 1.24mi |
| 25304 Shiawassee Cir #105 Southfield, MI | 1.0 | 1.0 | 700 | $1,050 | $1.50 | 43d | 1 | 1.25mi |
| 25740 Shiawassee St Southfield, MI | 1.0–2.0 | 1.0 | 850 | $1,253 | $1.47 | 43d | 10 | 1.26mi |
| 25340 Shiawassee Cir Unit 208 Southfield, MI | 1.0 | 1.0 | 575 | $1,050 | $1.83 | 18d | 1 | 1.30mi |
| 25400 Basin St Bldg 9 Southfield, MI | 1.0 | 1.0 | 750 | $1,175 | $1.57 | 43d | 1 | 1.32mi |
| 25400 Basin St Southfield, MI | 1.0–2.0 | 1.0 | 825 | $1,400 | $1.70 | 5d | 11 | 1.32mi |
| 19264 Telegraph Rd Unit G2 Detroit, MI | 1.0 | 1.0 | 700 | $820 | $1.17 | 43d | 1 | 1.34mi |
| 19264 Telegraph Rd Unit G7 Detroit, MI | 2.0 | 1.0 | 820 | $975 | $1.19 | 43d | 1 | 1.34mi |
| 19276 Telegraph Rd Detroit, MI | 2.0 | 1.0 | 820 | $975 | $1.19 | 43d | 1 | 1.34mi |
| 19250 Telegraph Rd Unit O7 Detroit, MI | 2.0 | 1.0 | 820 | $975 | $1.19 | 24d | 1 | 1.34mi |
| 25010 W 8 Mile Rd Southfield, MI | 1.0 | 1.0 | 820 | $1,110 | $1.35 | 1d | 2 | 1.34mi |
| 19254 Telegraph Rd Unit M5 Detroit, MI | 1.0 | 1.0 | 700 | $820 | $1.17 | 14d | 1 | 1.34mi |
| 19248 Telegraph Rd Unit P7 Detroit, MI | 2.0 | 1.0 | 820 | $975 | $1.19 | 24d | 1 | 1.34mi |
| 24651 W McNichols Rd Detroit, MI | 1.0 | 1.0 | 700 | $800 | $1.14 | 43d | 4 | 1.35mi |
| 19260 Telegraph Rd Unit J2 Detroit, MI | 1.0 | 1.0 | 700 | $820 | $1.17 | 43d | 1 | 1.37mi |
| 20745 Saint Francis Unit 208 Farmington Hills, MI | 2.0 | 1.0 | 900 | $1,395 | $1.55 | 14d | 1 | 1.40mi |
| 20745 Saint Francis Unit 101 Farmington Hills, MI | 2.0 | 1.0 | 900 | $1,495 | $1.66 | 43d | 1 | 1.40mi |
| 19800 Telegraph Rd Detroit, MI | 2.0 | 1.0 | 855 | $1,020 | $1.19 | 43d | 1 | 1.48mi |
| 21335 Negaunee Unit 1542196P Southfield, MI | 3.0 | 1.0 | 850 | $3,345 | $3.94 | 4d | 1 | 1.49mi |
HOA detail condo
- Monthly dues
- $295 · $3,540/yr
- Likely covers
- poolsecurity
- Assessments
- None detected in remarks — confirm with the listing agent.
Listing history 29 events
-
2026-06-18days on market $92,500 Active 80 DOM
-
2026-06-17days on market $92,500 Active 79 DOM
-
2026-06-16days on market $92,500 Active 78 DOM
-
2026-06-15days on market $92,500 Active 77 DOM
-
2026-06-13days on market $92,500 Active 75 DOM
-
2026-06-13days on market $92,500 Active 74 DOM
-
2026-06-09days on market $92,500 Active 71 DOM
-
2026-06-08days on market $92,500 Active 70 DOM
-
2026-06-07days on market $92,500 Active 69 DOM
-
2026-06-04days on market $92,500 Active 66 DOM
-
2026-06-03days on market $92,500 Active 65 DOM
-
2026-06-02days on market $92,500 Active 64 DOM
-
2026-06-01days on market $92,500 Active 63 DOM
-
2026-05-31days on market $92,500 Active 62 DOM
-
2026-03-30$92,500 Active 271-char remark
Show marketing remark (271 chars)
Updated two bedroom upper unit condo with large kitchen, newer carpet and windows. Stable complex with pool, gated parking and security cameras on site. Shared laundry facilities located in a common basement with an assigned storage cage. Agent to verify all information.
-
2026-03-30$92,500 Active
Show marketing remark (271 chars)
Updated two bedroom upper unit condo with large kitchen, newer carpet and windows. Stable complex with pool, gated parking and security cameras on site. Shared laundry facilities located in a common basement with an assigned storage cage. Agent to verify all information.
-
2026-03-30$92,500 Active 271-char remark
Show marketing remark (271 chars)
Updated two bedroom upper unit condo with large kitchen, newer carpet and windows. Stable complex with pool, gated parking and security cameras on site. Shared laundry facilities located in a common basement with an assigned storage cage. Agent to verify all information.
-
2023-04-07soldstatus $67,900
-
2023-04-05soldstatus $67,900 Sold
-
2023-04-05soldstatus $67,900 Closed
-
2023-03-31status Pending
-
2023-03-31status Pending
-
2023-03-02status Active
-
2023-03-02status Active
-
2023-02-20status Pending
-
2023-02-20status Pending
-
2023-02-01$67,900 Active
-
2023-02-01$67,900 Active
-
1992-05-08soldstatus $41,900
ⓘ Source: listings_history table (triggers on properties + properties_extension) + one-shot
backfill from property_details.listing_events for pre-trigger history.
Tax reassessment forecast MI · Partial reset (capped growth)
- Current annual tax
- $1,174 · $98/mo
- Projected year-2 tax
- $1,299 · $108/mo
- Expected delta
- +$125/yr (+$10/mo · 10.7%)
ⓘ Screening estimate from a state-policy table — verify with the county assessor before closing.
Nearby sold comps map
Loading sold comps map…
Walkable amenities ~0.75 mi
Loading nearby amenities…
Taxation est. · year 1
- Rental income
- $15,697
- − Mortgage interest
- −$5,181
- − Property taxes
- −$1,174
- − Insurance
- −$462
- − Repairs & maintenance
- −$1,256
- − Management
- −$1,256
- − HOA
- −$3,540
- − Depreciation
- −$2,691
- Taxable income
- $137
- Est. tax owed @ 24.0%
- −$33
- After-tax cash flow
- $1,371/yr
For passive investors: Depreciation is non-cash, so a rental often shows a tax loss while cash-flowing — sheltering income. Rental losses are passive: they offset passive income freely, and up to $25,000/yr can offset ordinary (W-2) income if you actively participate and your MAGI is under $100k (phasing out to $0 by $150k); unused losses carry forward. On sale, claimed depreciation is recaptured at up to 25%, and gains may owe capital-gains tax (a 1031 exchange can defer both). Figures are a year-1 estimate at your 24.0% rate — not tax advice; consult a CPA.
Schools (NCES district)
- District
- Redford Union Schools District No. 1
- NCES district ID
- 2629460
- Math proficiency
- 8% ▼ -6.00%
- Reading proficiency
- 23% ▬ 0.00%
- Median HH income
- $49,778
- Composite
- 14.1/100
- National rank
- #9460
- State rank
- #489 of 540 in MI
Livability — Redford
No livability data for this city. (Only ~50 U.S. cities are tracked.)
Census & demographics
- City population
- 36,976
- Population (ZIP)
- 17,097
Population outlook (Wayne County) Hauer SSP2
- Today (2025)
- 1,675,273 people
- By 2030
- 1,620,300 · -3.3%
- By 2040
- 1,502,341 · -10.3%
- By 2050
- 1,384,039 · -17.4%
- By 2075
- 1,124,592 · -32.9%
- By 2100
- 881,193 · -47.4%
Race, ethnicity, and origin ACS 2023
- Neighborhood character
- Diverse neighborhood (Simpson 0.64)
- Race & ethnicity
- White 45% Black 40% Two or more races 10% Hispanic / Latino 6%
- Hispanic origin (detail)
- Mexican 6%
- Common ancestry
- Romanian 5% Lithuanian 3% Slovak 2%
- Foreign-born
- 4% · Canada
- Languages at home
- 93% English-only · Spanish 5% Chinese 1%
Political lean MEDSL · Wayne
- 2024 margin
- Strong D (+29.0) · D 62.7% · R 33.7% · Other 3.6%
- 2008→2024 swing
- -20.5pp toward R · 2008: 49.5pp · 2024: 29.0pp
- All cycles
- 2024: D+29.0 2020: D+38.1 2016: D+37.3 2012: D+46.9 2008: D+49.5
Not yet ingested
- Civics
- —
Market trends
- HPI YoY
- ▼ -177.98%
- Current HPI
- 236.2958
- Rent YoY
- —
- Metro
- —
- State GDP YoY
- ▲ 1.37%
- F500 in state
- 28
Industry mix (Fortune 500 HQ in MI)
| Industry | F500 HQs | Revenue |
|---|---|---|
| Automotive Parts | 3 | $48B |
|
||
| Automotive | 2 | $372B |
|
||
| Chemicals | 1 | $45B |
|
||
| Automotive Retail | 1 | $29B |
|
||
| Healthcare / Medical Devices | 1 | $23B |
|
||
| Automotive Technology | 1 | $20B |
|
||
Price history
+120.8% since first listed15 events — show timeline
- 2026-03-30 Listed $92,500 REALCOMP
- 2026-03-30 Listed $92,500 SW Michigan MLS
- 2026-03-30 Listed $92,500 MiRealSource-MiMLS
- 2023-04-07 Sold (Public Records) $67,900 Public Records
- 2023-04-05 Sold (MLS) $67,900 MiRealSource-MiMLS
- 2023-04-05 Sold (MLS) $67,900 REALCOMP
- 2023-03-31 Pending — MiRealSource-MiMLS
- 2023-03-31 Pending — REALCOMP
- 2023-03-02 Relisted — MiRealSource-MiMLS
- 2023-03-02 Relisted — REALCOMP
- 2023-02-20 Pending — MiRealSource-MiMLS
- 2023-02-20 Pending — REALCOMP
- 2023-02-01 Listed $67,900 MiRealSource-MiMLS
- 2023-02-01 Listed $67,900 REALCOMP
- 1992-05-08 Sold (Public Records) $41,900 Public Records
Property tax history
+6.6%/yrLatest (2025): $1,174 · -42.8% YoY. Source: county tax records.
Cash-flow waterfall
monthlySold comps — $/sqft
last 12 mo · ≤1 miLoading sold comps…