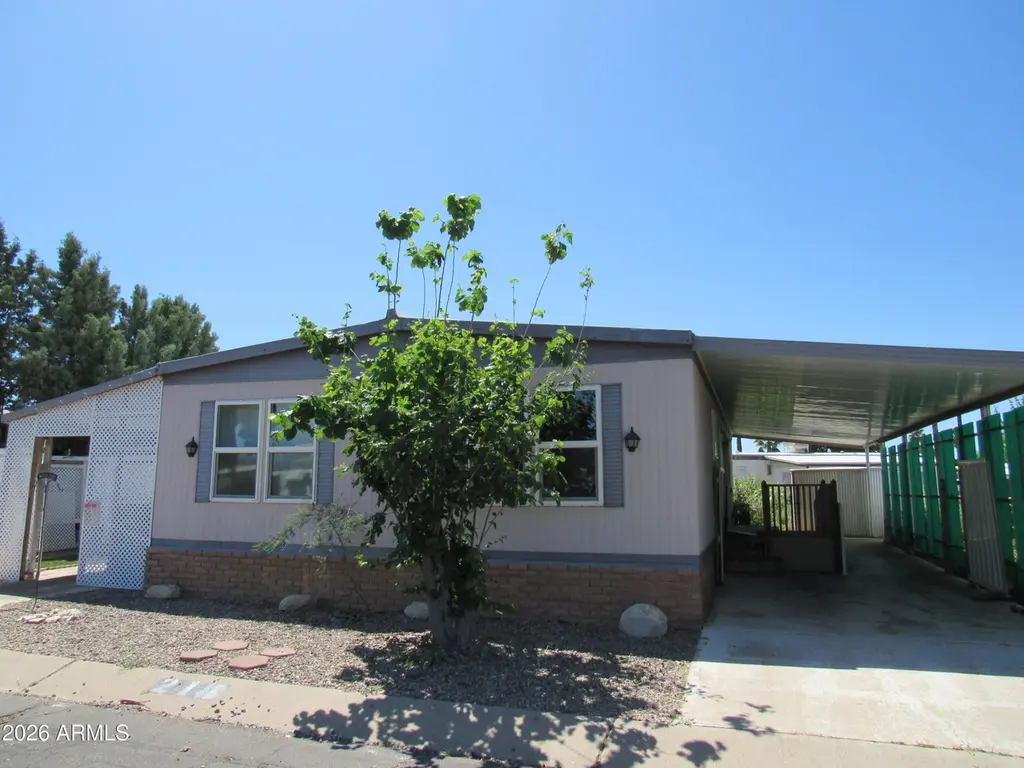
3411 S Camino Seco -- #218 · Tucson, AZ
Flood risk 1/10 · Minimal
- FEMA flood zone
- X (unshaded)
- Chance of flooding over 30 yrs
- 0.0%
- Est. flood insurance / yr
- $507 – $1,088
Fire risk 5/10 · Moderate
- Est. fire insurance / yr
- $610 – $1,132
Heat risk 7/10 · Major
- Hot days now (above 104°F)
- 6 days/yr
- Hot days in 30 yrs
- 15 days/yr
Wind risk 1/10 · Minimal
- Chance of severe wind over 30 yrs
- —
Air-quality risk 1/10 · Minimal
- Unhealthy air days now
- 0 days/yr
- Unhealthy air days in 30 yrs
- 0 days/yr
Risk factors via First Street. Map © Google.
Why this score? — see what drove the B+ grade
The composite is a weighted blend of 9 inputs, each scored 0–100. Each bar is that input's sub-score; the figure is the points it added to the 100-point composite (weight × sub-score).
- Cash flow +30.0/30.0
- ARV discount +15.0/15.0
- 1% rule +10.0/10.0
- DSCR +10.0/10.0
- Livability +3.7/5.0
- Condition / age +2.8/5.0
- Rent growth +2.5/5.0
- Schools +1.6/10.0
- Appreciation +0.0/10.0
$39,000
🖨 Deal sheet 📄 Offer letter ✓ Due diligence
Listing remarks
Tons of Potential This two bedroom, two bath home is on the boulevard with mountain views. Large yard. Large open concept with counter and range on island off kitchen. Built in microwave and large space for new fridge. Matching washer and dryer in hallway. Stainless steel sink and lots of cabinets. Large living room windows for that extra light. New flooring throughout. Skylights and ceiling fans to help with electricity. Primary bedroom has walk-in closet. Large craft room or enclosed porch for extra storage or hobbies. 55+
Key facts
- Built in microwave
- Open concept
- Large yard
Tags
Property features AI
Finance
- Other: Lot size source listed as owner; Building area source listed as owner
- HOA & community: Monthly association fee ($749) covering grounds maintenance and street maintenance; Community amenities include pool, pickleball courts, and tennis courts
Exterior
- Parking: 2 covered parking spaces; 2 open parking spaces; 2 carport spaces
- Security: Gated community
- Utilities: City water; Public sewer
- Home design: Manufactured/mobile housing; Leasehold ownership
- Construction: Metal siding and wood frame construction; Metal roof
- Exterior features: Desert front and desert back landscaping; Mountain views; Heated spa
Interior
- Kitchen: Includes dishwasher
- Bedrooms: 2 possible bedrooms
- Flooring: Laminate
- Bathrooms: 2 full bathrooms
- Heating & cooling: Central air conditioning; Has heating
- Interior features: Dishwasher; Laminate flooring; Laundry inside
- Laundry & utility: Laundry located inside the unit
Neighborhood map
What this means for you Summary
Snapshot
- This is a 2-bed/2.0-bath manufactured listed at $39k. Condition is rated average.
Deal economics
- At list price, monthly cash flow is $248 ($3k/yr) — positive.
- The deal already cash-flows at list — no discount required.
- Meets the 1% rule at list price ($2k rent vs $39k).
- Recommended offer: $38k (3.0% below list) — sets the bar for market timing.
- Cap rate 13.9% vs local median 3.7% in Tucson — top-decile yield for the area; either an underpriced asset or a hidden risk that comps aren't pricing in. Stress-test before assuming the spread holds.
Location & tenants
- Location reads 74/100 on livability (#17 in AZ, #4,502 nationally) — a middle-class / working-renter tenant base. Strengths: commute A+, cost of living A+, housing A+; Watch: health & safety C-, schools D+, crime F.
- Tucson Unified District (4403) (urban): math 14% / reading 23% proficiency, ranked #190 of 249 in AZ (top 76%) — low school quality limits family demand, transient renter base, plan for 1-2y turnover.
- Market conditions: Rents soft (-0.2%/yr); 194 active listings in the ZIP; 34 comparable units currently listed for rent nearby; rentals at typical pace (median 22d on market — plan ~3-4 weeks tenant-placement turnaround); 5,268 units permitted in Pima County in 2024 (996 in 5+ unit buildings).
- This rent runs 31% of the median local income ($62k/yr) — at the standard rent-burdened threshold; future hikes will face affordability resistance.
Forward outlook
- Local home prices are declining (-3.0%/yr); year-one equity from $270 of loan paydown is wiped out by about $1k of value loss. Plan a longer hold.
- Pima County population projected at +8% by 2050 — modest demand growth; plan on rents tracking national, not racing it.
- At projected returns (-3.0% appreciation + 0.0% rent growth), your $11k cash investment doubles in ~8 years — after that, you're playing with house money.
Negotiation context
- It's been on market 48 days — a 3% lower offer ($38k) is reasonable based on typical stale-listing flexibility.
Risks & watch-outs
- Watch-outs: HOA is 47% of rent.
- Climate carrying-cost: moderate wildfire risk; extreme-heat days projected 6→15/yr by 2055 (HVAC capex compounding) — expect insurance premiums to compound above CPI over the hold.
Questions for the listing agent
- It's been on market 48 days. Have you received any prior offers? Is the seller open to a 3% concession, seller financing, or rate buy-down credit?
- Built in 1972 — when were the roof, HVAC, electrical panel, plumbing, and water heater last replaced?
- What does the HOA fee cover, when was the last increase, and are there any pending special assessments or reserve-fund shortfalls?
- Is there a deadline driving the sale (1031 exchange, divorce, estate, relocation)? That informs how much negotiation room exists.
- Schools are D-rated, which usually means shorter tenancies and higher turnover. Who's the typical renter profile here, and what's been the actual vacancy rate?
- Crime grade is F in this area — have there been break-ins, vandalism, or insurance claims at this property in the last 3 years? What carrier currently insures it and at what premium?
- What's the average days-on-market for RENTAL listings here right now (not sales)? A rising rental-DOM trend means longer vacancies and softer asking-rent achievability than the comps imply.
- What's the recent tenant-quality profile in this submarket — average credit score on applications, eviction rate, late-payment / NSF rate, and stable-employment percentage? A property-management company in the area should have these aggregated.
- How much new for-sale + rental construction is in the pipeline within 1–3 miles? Heavy new supply typically softens prices + rents 12–24 months out; constrained supply supports both.
Investment metrics
- 1% rule
- 4.11% ✓
- Cap rate
- 13.91%
- Cash-on-cash
- 27.20%
- DSCR
- 2.21
- GRM
- 2.0
CMA / ARV
- ARV (median comp)
- $69,000
- List price
- $39,000
- Delta
- -43.48%
- Verdict
- UNDERPRICED
- Comps
- 3 within 1.0 mi
Show comp detail 2 sales within ~0.75 mi
| Address | Dist | Beds/Ba | Sqft | Sold | Price | $/sf | Match |
|---|---|---|---|---|---|---|---|
| 3411 S Camino Seco #12 | 0.00mi | 2/2.0 | 1,100 (-4%) | 3mo | $69,000 | $63 | 90 |
| 3768 S Andrew Johnson Ave | 0.41mi | 2/2.0 | 1,248 (+8%) | 6mo | $212,500 | $170 | 62 |
Match score weights: distance 35% · size 25% · config 20% · recency 20%. Top-matched comps best support the ARV.
Projected returns pro-forma
-3.0% appreciation · 0.0% rent growth · sell at horizon
- IRR
- 13.2%
- Equity multiple
- 1.48×
- Total profit
- $5,232
- Equity at exit
- $5,815
- IRR
- 15.0%
- Equity multiple
- 1.79×
- Total profit
- $8,672
- Equity at exit
- $3,372
Cash invested: $10,920 (down + closing). Projections, not guarantees.
Landlord ↔ Tenant lean methodology
- Overall (STATE)
- 87 Strongly Landlord-Friendly
- State Arizona
- 87 Strongly Landlord-Friendly · R+3
- County
- — inherits STATE
- City
- — inherits STATE
ZIP-level market 85730
- Home prices YoY
- -30.9%
- Rents YoY
- -0.2%
- Active inventory
- 194
- Price-to-rent
- 2.0×
Monthly cashflow live
- Estimated rent
- $1,603 high interval (Pro) →
- Mortgage (P&I)
- −$205
- Tax est. 1.5%
- −$49 /mo · $585/yr
- Insurance
- −$16
- HOA
- −$749
- Vacancy / Maint / Mgmt
- −$337
- Net cashflow
- $248
Break-even live
UW: 25.0% down · 7.5% · 30yr · 1.5% tax · 5.0% vac · 8.0% maint · 8.0% mgmt
Financing live
Cash to close
- Down payment
- $9,750
- Closing costs
- $1,170
- Reserves months
- —
- Total cash needed
- —
Loan-product check · same deal, 3 products live
Conventional
25% down · 7.5% · 30yr
- Down + closing
- —
- Monthly P&I
- —
- Monthly cashflow
- —
- DSCR
- —
- Eligible?
- —
Personal DTI + credit; lowest rate.
DSCR
20% down · 8.5% · 30yr
- Down + closing
- —
- Monthly P&I
- —
- Monthly cashflow
- —
- DSCR
- —
- Eligible?
- —
No personal income docs; deal must DSCR.
Hard money
10% down · 12.0% · 12mo
- Down + closing
- —
- Monthly P&I
- —
- Monthly cashflow
- —
- DSCR
- —
- Eligible?
- —
Short-term bridge; refi at stabilization.
Rent comps 34 comps
| Address | Beds | Baths | Sqft | Rent | $/sqft | DOM | Units | Dist |
|---|---|---|---|---|---|---|---|---|
| 3455 S Magda Ave Tucson, AZ | 3.0 | 2.0 | 1500 | $2,000 | $1.33 | 44d | 1 | 0.21mi |
| 3673 S Camino Seco Unit 1 Tucson, AZ | 1.0 | 1.0 | 800 | $945 | $1.18 | 24d | 1 | 0.25mi |
| 8838 E Arbor St Tucson, AZ | 2.0 | 2.0 | 799 | $1,295 | $1.62 | 20d | 1 | 0.54mi |
| 2650 S Brandywine Ln Tucson, AZ | 3.0 | 2.5 | 1340 | $1,500 | $1.12 | 44d | 1 | 0.62mi |
| 8829 E Eagle Creek Dr Tucson, AZ | 3.0 | 2.0 | 1280 | $1,830 | $1.43 | 16d | 1 | 0.70mi |
| 8981 E Golf Links Rd Unit 2 Tucson, AZ | 2.0 | 2.0 | 971 | $1,890 | $1.95 | 44d | 1 | 0.75mi |
| 2618 S Camino Seco Tucson, AZ | 2.0 | 1.5 | 1442 | $1,299 | $0.90 | 24d | 1 | 0.78mi |
| 4289 S Goodall Pl Tucson, AZ | 3.0 | 2.0 | 1372 | $1,950 | $1.42 | 44d | 1 | 0.82mi |
| 8737 E Pebble Stone Ln Tucson, AZ | 3.0 | 2.0 | 1383 | $2,095 | $1.51 | 44d | 1 | 0.88mi |
| 9172 E Corte Arroyo Oeste Tucson, AZ | 3.0 | 2.0 | 1350 | $1,900 | $1.41 | 3d | 1 | 0.92mi |
| 4433 S Sunrise Bluff Way Tucson, AZ | 3.0 | 2.0 | 1465 | $1,895 | $1.29 | 24d | 1 | 0.93mi |
| 8250 E Golf Links Rd Tucson, AZ | 1.0–3.0 | 1.0–2.0 | 865 | $1,600 | $1.85 | 2d | 22 | 0.94mi |
| 8763 E Pebble Stone Ln Tucson, AZ | 3.0 | 2.0 | 1262 | $1,995 | $1.58 | 3d | 1 | 0.96mi |
| 8024 E Victoria Dr Tucson, AZ | 3.0 | 2.0 | 1127 | $1,500 | $1.33 | 24d | 1 | 1.00mi |
| 8030 E Lakeside Pkwy Tucson, AZ | 2.0 | 2.0 | 880 | $1,308 | $1.49 | 3d | 1 | 1.00mi |
| 9009 E Kinross Dr Tucson, AZ | 3.0 | 2.0 | 1304 | $1,715 | $1.32 | 21d | 1 | 1.02mi |
| 8755 E Stone Meadow Cir Tucson, AZ | 3.0 | 2.0 | 1465 | $1,925 | $1.31 | 17d | 1 | 1.02mi |
| 7950 E Stella Rd Tucson, AZ | 2.0 | 2.0 | 1000 | $1,195 | $1.20 | 21d | 1 | 1.10mi |
| 7950 E Stella Rd Tucson, AZ | 2.0 | 2.0 | 1000 | $1,395 | $1.40 | 3d | 1 | 1.10mi |
| 7983 E Escalante Rd Unit 3 Tucson, AZ | 2.0 | 1.0 | 850 | $1,075 | $1.26 | 15d | 1 | 1.11mi |
| 3410 S Lakeside Pl Tucson, AZ | 3.0 | 2.0 | 1271 | $1,800 | $1.42 | 24d | 1 | 1.12mi |
| 8061 E Senate St Tucson, AZ | 2.0 | 2.5 | 1298 | $1,700 | $1.31 | 21d | 1 | 1.13mi |
| 2024 S Birdie Cir Tucson, AZ | 3.0 | 2.0 | 1479 | $1,675 | $1.13 | 3d | 1 | 1.16mi |
| 2425 S Rose Peak Dr Tucson, AZ | 2.0 | 1.0 | 821 | $1,200 | $1.46 | 17d | 1 | 1.16mi |
| 4775 S Wild Rose Dr Tucson, AZ | 3.0 | 2.0 | 1165 | $1,645 | $1.41 | 24d | 1 | 1.17mi |
| 4775 S Wild Rose Dr Tucson, AZ | 3.0 | 2.0 | 1165 | $1,695 | $1.45 | 3d | 1 | 1.17mi |
| 9055 E Alderpoint Way Tucson, AZ | 3.0 | 2.0 | 1165 | $1,695 | $1.45 | 21d | 1 | 1.21mi |
| 9801 E Domenic Ln Tucson, AZ | 3.0 | 2.0 | 1428 | $1,791 | $1.25 | 12d | 1 | 1.24mi |
| 9699 E Vendela St Tucson, AZ | 3.0 | 2.0 | 1165 | $1,800 | $1.55 | 44d | 1 | 1.34mi |
| 9746 E Sascha St Tucson, AZ | 3.0 | 2.0 | 1024 | $1,800 | $1.76 | 15d | 1 | 1.35mi |
| 7701 E 45th St Tucson, AZ | 3.0 | 2.0 | 1127 | $1,395 | $1.24 | 12d | 1 | 1.38mi |
| 9961 E Skyward Way Tucson, AZ | 2.0 | 2.0 | 1012 | $1,550 | $1.53 | 3d | 1 | 1.47mi |
| 9960 E Banister Dr Tucson, AZ | 3.0 | 2.0 | 1252 | $1,575 | $1.26 | 44d | 1 | 1.49mi |
| 3892 S Evergreen Ave Tucson, AZ | 2.0 | 1.0 | 730 | $1,295 | $1.77 | 44d | 1 | 1.50mi |
HOA detail
- Monthly dues
- $749 · $8,988/yr
- Likely covers
- electric
Listing history 15 events
-
2026-06-18days on market $39,000 Active 48 DOM
-
2026-06-17days on market $39,000 Active 47 DOM
-
2026-06-16days on market $39,000 Active 46 DOM
-
2026-06-15days on market $39,000 Active 45 DOM
-
2026-06-13days on market $39,000 Active 43 DOM
-
2026-06-10days on market $39,000 Active 40 DOM
-
2026-06-09days on market $39,000 Active 39 DOM
-
2026-06-08days on market $39,000 Active 38 DOM
-
2026-06-07days on market $39,000 Active 37 DOM
-
2026-06-05days on market $39,000 Active 34 DOM
-
2026-06-03days on market $39,000 Active 33 DOM
-
2026-06-02days on market $39,000 Active 32 DOM
-
2026-06-01days on market $39,000 Active 31 DOM
-
2026-05-31days on market $39,000 Active 30 DOM
-
2026-05-01$39,000 Active 541-char remark
ⓘ Source: listings_history table (triggers on properties + properties_extension) + one-shot
backfill from property_details.listing_events for pre-trigger history.
Climate risk First Street
- Flood 1/10 Low FEMA zone X (unshaded) · 0% chance over 30 yrs
- Wildfire 5/10 Major
- Heat 7/10 Severe 6 d/yr ≥104°F today · 15 d/yr by 30 yrs out
- Wind 1/10 Low
- Air quality 1/10 Low 0 unhealthy d/yr today · 0 by 30 yrs out
Nearby sold comps map
Loading sold comps map…
Walkable amenities ~0.75 mi
Loading nearby amenities…
Taxation est. · year 1
- Rental income
- $19,231
- − Mortgage interest
- −$2,185
- − Property taxes
- −$585
- − Insurance
- −$195
- − Repairs & maintenance
- −$1,538
- − Management
- −$1,538
- − HOA
- −$8,988
- − Depreciation
- −$1,135
- Taxable income
- $3,067
- Est. tax owed @ 24.0%
- −$736
- After-tax cash flow
- $2,234/yr
For passive investors: Depreciation is non-cash, so a rental often shows a tax loss while cash-flowing — sheltering income. Rental losses are passive: they offset passive income freely, and up to $25,000/yr can offset ordinary (W-2) income if you actively participate and your MAGI is under $100k (phasing out to $0 by $150k); unused losses carry forward. On sale, claimed depreciation is recaptured at up to 25%, and gains may owe capital-gains tax (a 1031 exchange can defer both). Figures are a year-1 estimate at your 24.0% rate — not tax advice; consult a CPA.
Condition & rehab AI · 12 photos
This two-bedroom, two-bath manufactured home has average condition with cosmetic updates needed to enhance its resale and rental value.
Repairs flagged
- Minor Kitchen cabinets — Worn appearance
- Minor Bathtub and shower — Dated appearance
- Minor Landscaping — Could be upgraded for curb appeal
Value-add opportunities
- Both Paint interior walls — Fresh paint enhances curb appeal and interior aesthetics
- Both Replace fencing — Upgraded fencing improves curb appeal and security
- Both Replace kitchen cabinets — New cabinets improve functionality and aesthetics
- Both Replace bathtub and shower — Modern fixtures enhance functionality and aesthetics
Renovation cost estimate screening
| Repair item | Severity | Est. cost |
|---|---|---|
| Kitchen cabinets · Worn appearance | Minor | $500–3,000 |
| Bathtub and shower · Dated appearance | Minor | $500–3,000 |
| Landscaping · Could be upgraded for curb appeal | Minor | $500–3,000 |
| Total estimated repair cost · 3 items | $1,500–9,000 |
Value-add ROI direction
- Both Paint interior walls — Fresh paint enhances curb appeal and interior aesthetics ↑
- Both Replace fencing — Upgraded fencing improves curb appeal and security ↑
- Both Replace kitchen cabinets — New cabinets improve functionality and aesthetics ↑
- Both Replace bathtub and shower — Modern fixtures enhance functionality and aesthetics ↑
ⓘ Cost ranges are severity-bucket heuristics (US national rule-of-thumb). Get contractor quotes + a written scope before underwriting a rehab budget.
Schools (NCES district)
- District
- Tucson Unified District (4403)
- NCES district ID
- 0408800
- Math proficiency
- 14% ▼ -17.00%
- Reading proficiency
- 23% ▼ -11.00%
- Median HH income
- $40,962
- Composite
- 15.78/100
- National rank
- #9270
- State rank
- #190 of 249 in AZ
Livability — Tucson
- Score
- 74/100
- State rank
- #17
- US rank
- #4502
Category grades
Schools grade is shown separately in the Schools card above.
Census & demographics
- Census place
- Tucson, AZ
- County
- Pima County · 1,012,107 people
- City population
- 839,336
- Metro
- Tucson, AZ
- Population (ZIP)
- 39,399
- Household income
- $62,090
- Rent vs Own
- Severe rent burden
- 1364.0
Population outlook (Pima County) Hauer SSP2
- Today (2025)
- 1,066,056 people
- By 2030
- 1,086,684 · +1.9%
- By 2040
- 1,117,160 · +4.8%
- By 2050
- 1,149,778 · +7.9%
- By 2075
- 1,271,480 · +19.3%
- By 2100
- 1,321,160 · +23.9%
Race, ethnicity, and origin ACS 2023
- Neighborhood character
- Diverse neighborhood (Simpson 0.62)
- Race & ethnicity
- White 53% Hispanic / Latino 31% Two or more races 16% Black 8% Asian 3% Native American 1%
- Hispanic origin (detail)
- Mexican 28%
- Common ancestry
- Romanian 2% Lithuanian 2% Slovak 2%
- Foreign-born
- 8% · Canada, Vietnam
- Languages at home
- 84% English-only · Spanish 13% Vietnamese 1%
Political lean MEDSL · Pima
- 2024 margin
- D (+15.2) · D 57.0% · R 41.8% · Other 1.2%
- 2008→2024 swing
- +9.1pp toward D · 2008: 6.1pp · 2024: 15.2pp
- All cycles
- 2024: D+15.2 2020: D+18.7 2016: D+13.5 2012: D+5.8 2008: D+6.1
Not yet ingested
- Civics
- —
Market trends
- HPI YoY
- ▼ -136.41%
- Current HPI
- 304.999
- Rent YoY
- ▼ -0.16%
- Metro
- Tucson, AZ
- State GDP YoY
- ▲ 4.54%
- F500 in state
- 20
Industry mix (Fortune 500 HQ in AZ)
| Industry | F500 HQs | Revenue |
|---|---|---|
| Technology | 2 | $13B |
|
||
| Mining / Metals | 1 | $23B |
|
||
| Environmental Services | 1 | $16B |
|
||
| Metals / Steel | 1 | $14B |
|
||
| Technology Distribution | 1 | $9B |
|
||
| Homebuilding | 1 | $8B |
|
||
Price history
1 event — show timeline
- 2026-05-01 Listed $39,000 ARMLS
Cash-flow waterfall
monthlySold comps — $/sqft
last 12 mo · ≤1 miLoading sold comps…