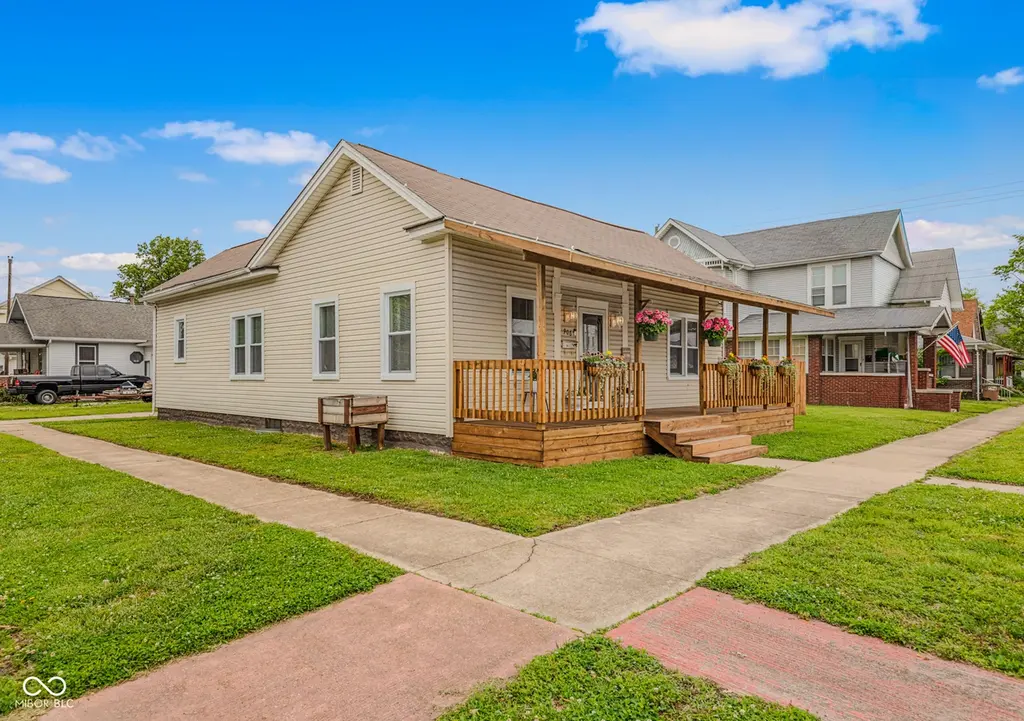
906 Sycamore St · Columbus, IN
Flood risk 1/10 · Minimal
- FEMA flood zone
- X (unshaded)
- Chance of flooding over 30 yrs
- 0.0%
- Est. flood insurance / yr
- $473 – $860
Fire risk 1/10 · Minimal
- Est. fire insurance / yr
- $717 – $1,331
Heat risk 4/10 · Minor
- Hot days now (above 103°F)
- 7 days/yr
- Hot days in 30 yrs
- 19 days/yr
Wind risk 2/10 · Minimal
- Chance of severe wind over 30 yrs
- 1.0%
Air-quality risk 2/10 · Minimal
- Unhealthy air days now
- 1 days/yr
- Unhealthy air days in 30 yrs
- 2 days/yr
Risk factors via First Street. Map © Google.
Why this score? — see what drove the D grade
The composite is a weighted blend of 9 inputs, each scored 0–100. Each bar is that input's sub-score; the figure is the points it added to the 100-point composite (weight × sub-score).
- Cash flow +14.3/30.0
- ARV discount +8.1/15.0
- DSCR +4.3/10.0
- Livability +4.0/5.0
- Schools +3.6/10.0
- Rent growth +3.3/5.0
- 1% rule +3.1/10.0
- Condition / age +2.5/5.0
- Appreciation +0.0/10.0
$199,900
🖨 Deal sheet (PDF) 📄 Offer letter ✓ Due diligence
Listing remarks
Big rooms, NEW WINDOWS, and historical character. With over 1500 square feet, this 3 bedroom home with a basement and 16x20 garage has space for everyone. The huge yard has a new wooden privacy fence and space for kids and pets or room to add your own garden or pool! Painted kitchen cabinets and new kitchen appliances (including a gas stove and dishwasher) + vinyl flooring. New carpet in the living room and bedroom. The new covered front porch has space for a swing and a table so that you can relax outside and even enjoy meals under your covered outdoor space. The sellers moved the laundry upstairs to the third bedroom, but it can easily be moved back to the basement if needed. The garage h
Key facts
- New windows
- 5,280 sq ft lot
- Garage
Tags
Property features AI
Exterior
- Parking: Detached garage with opener (1 car)
- Utilities: Public water; Municipal sewer connected
- Home design: Single-family residence; One level; East-facing
- Construction: Vinyl siding; Block and brick/mortar foundation
- Exterior features: Covered patio/porch; Full privacy fence; Corner lot with sidewalks
Interior
- Kitchen: Dishwasher; Microwave with hood; Gas oven; Refrigerator
- Bedrooms: 3 bedrooms on the main level
- Flooring: Hardwood floors
- Bathrooms: 1 full bathroom on the main level
- Heating & cooling: Forced air heating (natural gas); Central air conditioning
- Interior features: High ceilings; Hardwood floors; Unfinished basement
- Laundry & utility: Laundry on main level
Neighborhood map
What this means for you Summary
Snapshot
- This is a 3-bed/1.0-bath single-family listed at $200k.
Deal economics
- At list price, monthly cash flow is $36 ($432/yr) — positive.
- The deal already cash-flows at list — no discount required.
- To meet the 1% rule (rent ≥ 1% of price), the offer needs to be $161k (19.4% below list).
- Recommended offer: $161k (19.4% below list) — sets the bar for 1% rule.
- Cap rate 6.5% vs local median 3.5% in Columbus — top-decile yield for the area; either an underpriced asset or a hidden risk that comps aren't pricing in. Stress-test before assuming the spread holds.
Location & tenants
- Location reads 79/100 on livability (#24 in IN, #1,978 nationally) — a middle-class / working-renter tenant base. Strengths: crime A+, cost of living A+, housing A+; Watch: amenities D+, commute F.
- Bartholomew Consolidated School Corporation (urban): math 38% / reading 45% proficiency, ranked #119 of 301 in IN (top 40%) — families likely to look elsewhere, expect single-tenant / working-renter base with shorter leases.
- Zoned schools: Lillian Schmitt Elementary School (math 24% / reading 29%, grade F, #755 of 994 statewide, top 76%, 677 students, 74% FRL); Northside Middle School (math 32% / reading 49%, grade F, #117 of 330 statewide, top 36%, 904 students, 49% FRL); Columbus North High School (math 40% / reading 65%, grade C-, #102 of 369 statewide, top 28%, 2,224 students, 39% FRL) — zoned schools average 54% FRL vs 38% district-wide (16 pts higher); higher-poverty schools than district average — tighter screening recommended.
- Market conditions: Rents rising (+3.1%/yr); 345 active listings in the ZIP; 2 comparable units currently listed for rent nearby; solid renter incomes; 195 units permitted in Bartholomew County in 2024 (0 in 5+ unit buildings).
Forward outlook
- Local home prices are declining (-3.0%/yr); year-one equity from $1k of loan paydown is wiped out by about $6k of value loss. Plan a longer hold.
- Bartholomew County population projected at +22% by 2050 — long-run rental-demand tailwind backs the buy-and-hold thesis.
Negotiation context
- Only 8 days on market — expect competitive offers; lowballing is unlikely to land.
Risks & watch-outs
- Watch-outs: built in 1910 — expect roof / HVAC / electrical / plumbing capex.
Questions for the listing agent
- Built in 1910 — when were the roof, HVAC, electrical panel, plumbing, and water heater last replaced?
- Is there a deadline driving the sale (1031 exchange, divorce, estate, relocation)? That informs how much negotiation room exists.
- Schools are B-rated — typically a magnet for longer-tenancy family renters. What's the average tenant stay here, and is there a school-zone premium baked into asking?
- The area grade is low — what's the realistic commute time and amenity access for the typical tenant pool here? Any planned neighborhood developments (good or bad) we should know about?
- What's the average days-on-market for RENTAL listings here right now (not sales)? A rising rental-DOM trend means longer vacancies and softer asking-rent achievability than the comps imply.
- What's the recent tenant-quality profile in this submarket — average credit score on applications, eviction rate, late-payment / NSF rate, and stable-employment percentage? A property-management company in the area should have these aggregated.
- How much new for-sale + rental construction is in the pipeline within 1–3 miles? Heavy new supply typically softens prices + rents 12–24 months out; constrained supply supports both.
Investment metrics
- 1% rule
- 0.81% ✗
- Cap rate
- 6.51%
- Cash-on-cash
- 0.77%
- DSCR
- 1.03
- GRM
- 10.3
CMA / ARV
- ARV (on-the-fly)
- $202,404
- Comps found
- 12
Show comp detail 12 sales within ~0.75 mi
| Address | Dist | Beds/Ba | Sqft | Sold | Price | $/sf | Match |
|---|---|---|---|---|---|---|---|
| 1113 Union St | 0.26mi | 3/1.0 | 1,264 (+4%) | 7mo | $164,000 | $130 | 74 |
| 909 Pearl St | 0.05mi | 2/1.0 (-1) | 1,318 (+9%) | 11mo | $150,000 | $114 | 69 |
| 1516 Grand Ave | 0.52mi | 2/1.0 (-1) | 1,219 (+1%) | 12mo | $265,000 | $217 | 60 |
| 1327 Union St | 0.36mi | 3/2.0 | 1,308 (+8%) | 8mo | $251,500 | $192 | 59 |
| 1804 California St | 0.64mi | 3/1.0 | 1,120 (-8%) | 0mo | $125,000 | $112 | 57 |
| 1440 Sycamore St | 0.37mi | 2/1.5 (-1) | 1,133 (-6%) | 12mo | $162,500 | $143 | 55 |
| 1516 Sycamore St | 0.42mi | 2/1.0 (-1) | 1,280 (+6%) | 15mo | $66,250 | $52 | 53 |
| 1730 Union St | 0.62mi | 3/2.0 | 1,200 (-1%) | 15mo | $240,000 | $200 | 53 |
| 1509 Sycamore St | 0.43mi | 2/1.0 (-1) | 1,298 (+7%) | 12mo | $157,500 | $121 | 53 |
| 1726 California St | 0.60mi | 2/2.0 (-1) | 1,286 (+6%) | 2mo | $215,000 | $167 | 51 |
| 844 Cottage Ave | 0.56mi | 2/1.0 (-1) | 1,032 (-15%) | 0mo | $185,361 | $180 | 44 |
| 1718 Gilmore St | 0.69mi | 3/1.0 | 1,316 (+9%) | 15mo | $228,900 | $174 | 41 |
Match score weights: distance 35% · size 25% · config 20% · recency 20%. Top-matched comps best support the ARV.
Projected returns pro-forma
-3.0% appreciation · 3.15% rent growth · sell at horizon
- IRR
- -15.0%
- Equity multiple
- 0.47×
- Total profit
- $-29,922
- Equity at exit
- $29,806
- IRR
- -6.2%
- Equity multiple
- 0.60×
- Total profit
- $-22,364
- Equity at exit
- $17,284
Cash invested: $55,972 (down + closing). Projections, not guarantees.
Landlord ↔ Tenant lean methodology
- Overall (STATE)
- 90 Strongly Landlord-Friendly
- State Indiana
- 90 Strongly Landlord-Friendly · R+11
- County
- — inherits STATE
- City
- — inherits STATE
ZIP-level market 47201
- Rents YoY
- 3.1%
- Active inventory
- 345
- Price-to-rent
- 10.3×
Monthly cashflow live
- Estimated rent
- $1,612 medium interval (Pro) →
- Mortgage (P&I)
- −$1,048
- Tax from tax record
- −$106 /mo · $1,267/yr
- Insurance
- −$83
- HOA
- −$0
- Vacancy / Maint / Mgmt
- −$338
- Net cashflow
- $36
Break-even live
Sensitivity live
| Price | -10% $149 | -5% $93 | +0% $36 | +5% $-21 | +10% $-77 |
|---|---|---|---|---|---|
| Rent | -10% $-91 | -5% $-28 | +0% $36 | +5% $100 | +10% $163 |
| Rate | -1.0pp $137 | -0.5pp $87 | base $36 | +0.5pp $-16 | +1.0pp $-69 |
UW: 25.0% down · 7.5% · 30yr · 1.5% tax · 5.0% vac · 8.0% maint · 8.0% mgmt
Financing live
Cash to close
- Down payment
- $49,975
- Closing costs
- $5,997
- Reserves months
- —
- Total cash needed
- —
Loan-product check · same deal, 3 products live
Conventional
25% down · 7.5% · 30yr
- Down + closing
- —
- Monthly P&I
- —
- Monthly cashflow
- —
- DSCR
- —
- Eligible?
- —
Personal DTI + credit; lowest rate.
DSCR
20% down · 8.5% · 30yr
- Down + closing
- —
- Monthly P&I
- —
- Monthly cashflow
- —
- DSCR
- —
- Eligible?
- —
No personal income docs; deal must DSCR.
Hard money
10% down · 12.0% · 12mo
- Down + closing
- —
- Monthly P&I
- —
- Monthly cashflow
- —
- DSCR
- —
- Eligible?
- —
Short-term bridge; refi at stabilization.
Rent comps 2 comps
| Address | Beds | Baths | Sqft | Rent | $/sqft | DOM | Units | Dist |
|---|---|---|---|---|---|---|---|---|
| 725 Sycamore St Columbus, IN | 1.0–2.0 | 1.0–2.0 | 766 | $1,525 | $1.99 | 22d | 11 | 0.10mi |
| 1182 Quail Run Dr Columbus, IN | 1.0–3.0 | 1.0–2.0 | 967 | $1,600 | $1.65 | 45d | 16 | 1.33mi |
Listing history 2 events
-
2026-05-15status Pending
-
2026-05-06$199,900 Active
ⓘ Source: listings_history table (triggers on properties + properties_extension) + one-shot
backfill from property_details.listing_events for pre-trigger history.
Tax reassessment forecast IN · Partial reset (capped growth)
- Current annual tax
- $1,267 · $106/mo
- Projected year-2 tax
- $1,483 · $124/mo
- Expected delta
- +$216/yr (+$18/mo · 17.1%)
ⓘ Screening estimate from a state-policy table — verify with the county assessor before closing.
Climate risk First Street
- Flood 1/10 Low FEMA zone X (unshaded) · 0% chance over 30 yrs
- Wildfire 1/10 Low
- Heat 4/10 Moderate 7 d/yr ≥103°F today · 19 d/yr by 30 yrs out
- Wind 2/10 Low 100% chance of damaging wind over 30 yrs
- Air quality 2/10 Low 1 unhealthy d/yr today · 2 by 30 yrs out
Nearby sold comps map
Loading sold comps map…
Walkable amenities ~0.75 mi
Loading nearby amenities…
Taxation est. · year 1
- Rental income
- $19,339
- − Mortgage interest
- −$11,198
- − Property taxes
- −$1,267
- − Insurance
- −$1,000
- − Repairs & maintenance
- −$1,547
- − Management
- −$1,547
- − Depreciation
- −$5,815
- Taxable loss
- −$3,035
- Est. tax savings @ 24.0%
- +$728
- After-tax cash flow
- $1,160/yr
For passive investors: Depreciation is non-cash, so a rental often shows a tax loss while cash-flowing — sheltering income. Rental losses are passive: they offset passive income freely, and up to $25,000/yr can offset ordinary (W-2) income if you actively participate and your MAGI is under $100k (phasing out to $0 by $150k); unused losses carry forward. On sale, claimed depreciation is recaptured at up to 25%, and gains may owe capital-gains tax (a 1031 exchange can defer both). Figures are a year-1 estimate at your 24.0% rate — not tax advice; consult a CPA.
Schools (NCES district)
- District
- Bartholomew Consolidated School Corporation
- NCES district ID
- 1800360
- Math proficiency
- 38% ▼ -11.00%
- Reading proficiency
- 45% ▼ -7.00%
- Median HH income
- $54,685
- Composite
- 36.16/100
- National rank
- #4736
- State rank
- #119 of 301 in IN
Livability — Columbus
- Score
- 79/100
- State rank
- #24
- US rank
- #1978
Category grades
Schools grade is shown separately in the Schools card above.
Census & demographics
- Census place
- Columbus, IN
- County
- Bartholomew County · 74,100 people
- City population
- 74,100
- Metro
- Columbus, IN
- Population (ZIP)
- 47,900
- Household income
- $83,958
- Rent vs Own
- Severe rent burden
- 1455.0
Population outlook (Bartholomew County) Hauer SSP2
- Today (2025)
- 90,162 people
- By 2030
- 94,432 · +4.7%
- By 2040
- 102,659 · +13.9%
- By 2050
- 109,794 · +21.8%
- By 2075
- 123,419 · +36.9%
- By 2100
- 121,047 · +34.3%
Race, ethnicity, and origin ACS 2023
- Neighborhood character
- Predominantly White (75%)
- Race & ethnicity
- White 75% Hispanic / Latino 10% Asian 9% Two or more races 6% Black 2%
- Hispanic origin (detail)
- Mexican 8% Puerto Rican 1%
- Common ancestry
- Italian 3% Slovak 2% Serbian 1%
- Foreign-born
- 14% · Canada, China
- Languages at home
- 83% English-only · Spanish 8% Other Indo-European 5% Other Asian/Pacific 2%
Political lean MEDSL · Bartholomew
- 2024 margin
- Strong R (+27.3) · D 35.3% · R 62.7% · Other 2.0%
- 2008→2024 swing
- -16.1pp toward R · 2008: -11.3pp · 2024: -27.3pp
- All cycles
- 2024: R+27.3 2020: R+26.2 2016: R+33.3 2012: R+25.4 2008: R+11.3
Not yet ingested
- Civics
- —
Market trends
- HPI YoY
- ▼ -204.94%
- Current HPI
- 150.2246
- Rent YoY
- ▲ 3.15%
- Metro
- Columbus, IN
- State GDP YoY
- ▲ 2.90%
- F500 in state
- 18
Industry mix (Fortune 500 HQ in IN)
| Industry | F500 HQs | Revenue |
|---|---|---|
| Industrial Machinery | 2 | $37B |
|
||
| Healthcare | 1 | $177B |
|
||
| Pharmaceuticals | 1 | $45B |
|
||
| Metals / Steel | 1 | $18B |
|
||
| Agriculture | 1 | $17B |
|
||
| Packaging | 1 | $12B |
|
||
Price history
2 events — show timeline
- 2026-05-15 Pending — MIBOR as Distributed by MLS Grid
- 2026-05-06 Listed $199,900 MIBOR as Distributed by MLS Grid
Property tax history
-2.7%/yrLatest (2024): $1,267 · +11.2% YoY. Source: county tax records.
Cash-flow waterfall
monthlySold comps — $/sqft
last 12 mo · ≤1 miLoading sold comps…