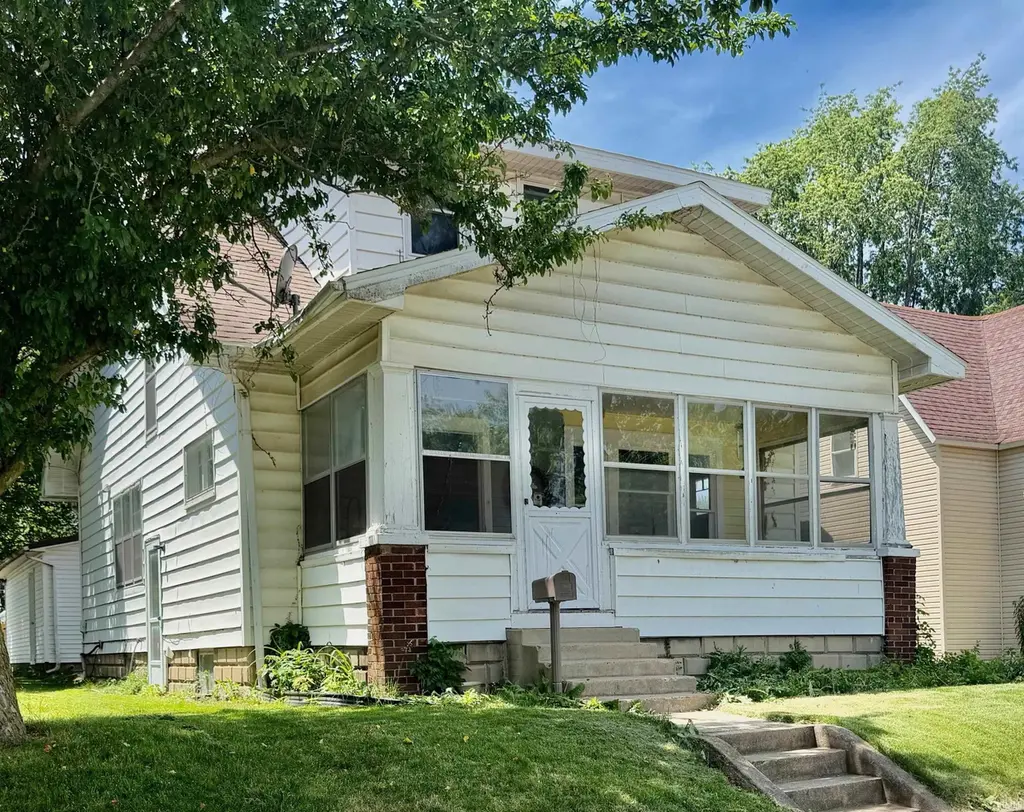
514 S Bluff St · Monticello, IN
Flood risk 1/10 · Minimal
- FEMA flood zone
- X (unshaded)
- Chance of flooding over 30 yrs
- 0.0%
- Est. flood insurance / yr
- $473 – $860
Fire risk 1/10 · Minimal
- Est. fire insurance / yr
- $717 – $1,331
Heat risk 3/10 · Minor
- Hot days now (above 101°F)
- 7 days/yr
- Hot days in 30 yrs
- 17 days/yr
Wind risk 2/10 · Minimal
- Chance of severe wind over 30 yrs
- —
Air-quality risk 2/10 · Minimal
- Unhealthy air days now
- 1 days/yr
- Unhealthy air days in 30 yrs
- 2 days/yr
Risk factors via First Street. Map © Google.
Why this score? — see what drove the C- grade
The composite is a weighted blend of 9 inputs, each scored 0–100. Each bar is that input's sub-score; the figure is the points it added to the 100-point composite (weight × sub-score).
- Cash flow +15.5/30.0
- ARV discount +15.0/15.0
- DSCR +4.8/10.0
- 1% rule +3.7/10.0
- Schools +3.6/10.0
- Livability +3.6/5.0
- Rent growth +2.5/5.0
- Condition / age +2.5/5.0
- Appreciation +0.0/10.0
$135,900
🖨 Deal sheet (PDF) 📄 Offer letter ✓ Due diligence
Listing remarks MLS
Delightful! Kick back and relax on the charming enclosed front porch or convenient back deck. High ceilings and playful kitchen make this one you don't want to miss. Generous off street parking and a 2 car garage. Hardwood floors in the living room and in several rooms upstairs, main level laundry and kitchen with nook. Full basement with access from both inside and outside. This 3 bedroom 2 bath home is ready for you. Room sizes rounded. Conventional, cash or 203k.
Key facts
- 7,405 sq ft lot
- 2 garage spots
- Built 1917
Property features AI
Exterior
- Parking: Detached asphalt driveway; Detached 2-car garage
- Utilities: Public water; Public sewer
- Home design: Single-family residence; Site-built home; Two stories
- Construction: Vinyl siding; Block foundation; Asphalt roof; Built as a site-built home
- Exterior features: Enclosed porch; Deck; Porch; Level, irregular-shaped lot
Interior
- Kitchen: Dishwasher; Refrigerator; Electric cooktop; Electric oven
- Bedrooms: Total of 7 rooms (bedroom count not specified)
- Flooring: Hardwood flooring
- Bathrooms: Two full bathrooms; One bathroom on the main level
- Heating & cooling: Natural gas heating; Central air; Ceiling fan(s) for additional cooling
- Interior features: Entrance foyer; Ceiling fans; Eat-in kitchen; Full unfinished basement; One fireplace
- Laundry & utility: Washer and dryer included; Main level laundry; Gas water heater
Neighborhood map
What this means for you Summary
Snapshot
- This is a 4-bed/1.0-bath single-family listed at $136k.
Deal economics
- At list price, monthly cash flow is $55 ($662/yr) — positive.
- The deal already cash-flows at list — no discount required.
- To meet the 1% rule (rent ≥ 1% of price), the offer needs to be $118k (13.0% below list).
- Recommended offer: $118k (13.0% below list) — sets the bar for 1% rule.
- Cap rate 6.8% vs local median 3.4% in Monticello — top-decile yield for the area; either an underpriced asset or a hidden risk that comps aren't pricing in. Stress-test before assuming the spread holds.
Location & tenants
- Location reads 71/100 on livability (#141 in IN) — a middle-class / working-renter tenant base. Strengths: cost of living A+, housing A+, health & safety A+; Watch: amenities F, commute F, employment F.
- Twin Lakes School Corporation (town): math 39% / reading 46% proficiency, ranked #116 of 301 in IN (top 38%) — families likely to look elsewhere, expect single-tenant / working-renter base with shorter leases.
- Zoned schools: Oaklawn Elementary School (math 47% / reading 42%, grade F, #379 of 994 statewide, top 41%, 348 students, 67% FRL); Roosevelt Middle School (math 38% / reading 47%, grade D-, #98 of 330 statewide, top 30%, 523 students, 67% FRL); Twin Lakes Senior High School (math 37% / reading 62%, grade D, #123 of 369 statewide, top 36%, 674 students, 59% FRL) — zoned schools average 64% FRL vs 41% district-wide (24 pts higher); higher-poverty schools than district average — tighter screening recommended.
- Market conditions: 225 active listings in the ZIP; 1 comparable units currently listed for rent nearby; 47 units permitted in White County in 2024 (0 in 5+ unit buildings).
Forward outlook
- Local home prices are declining (-3.0%/yr); year-one equity from $940 of loan paydown is wiped out by about $4k of value loss. Plan a longer hold.
- White County population projected at -19% by 2050 — secular population decline; favor cash flow + early exit over multi-decade hold.
Negotiation context
- It's been on market 21 days — a 2% lower offer ($134k) is reasonable based on typical stale-listing flexibility.
- 2 sale attempts since 8y ago; this cycle's ask has dropped $10k (7%) from the opening price — seller is motivated, your offer sets the floor, not the list.
- Current owner paid $88k; list at $136k implies a 54% gain — meaningful room to come down on a strong offer.
Risks & watch-outs
- Watch-outs: built in 1917 — expect roof / HVAC / electrical / plumbing capex.
Questions for the listing agent
- Built in 1917 — when were the roof, HVAC, electrical panel, plumbing, and water heater last replaced?
- Is there a deadline driving the sale (1031 exchange, divorce, estate, relocation)? That informs how much negotiation room exists.
- What's the average days-on-market for RENTAL listings here right now (not sales)? A rising rental-DOM trend means longer vacancies and softer asking-rent achievability than the comps imply.
- What's the recent tenant-quality profile in this submarket — average credit score on applications, eviction rate, late-payment / NSF rate, and stable-employment percentage? A property-management company in the area should have these aggregated.
- How much new for-sale + rental construction is in the pipeline within 1–3 miles? Heavy new supply typically softens prices + rents 12–24 months out; constrained supply supports both.
Investment metrics
- 1% rule
- 0.87% ✗
- Cap rate
- 6.78%
- Cash-on-cash
- 1.74%
- DSCR
- 1.08
- GRM
- 9.6
CMA / ARV
- ARV (on-the-fly)
- $209,436
- Comps found
- 12
Show comp detail 12 sales within ~0.75 mi
| Address | Dist | Beds/Ba | Sqft | Sold | Price | $/sf | Match |
|---|---|---|---|---|---|---|---|
| 523 S Bluff St | 0.04mi | 3/2.0 (-1) | 1,680 (-0%) | 10mo | $175,000 | $104 | 80 |
| 418 Cleveland St | 0.33mi | 3/1.5 (-1) | 1,632 (-3%) | 10mo | $107,700 | $66 | 64 |
| 415 W Jefferson St | 0.38mi | 4/2.0 | 1,812 (+7%) | 12mo | $180,000 | $99 | 56 |
| 209 Royalwood Dr | 0.73mi | 3/2.5 (-1) | 1,664 (-2%) | 0mo | $300,000 | $180 | 52 |
| 501 Mize Ct | 0.48mi | 3/2.5 (-1) | 1,836 (+9%) | 1mo | $310,000 | $169 | 51 |
| 510 N Illinois St | 0.74mi | 4/2.0 | 1,792 (+6%) | 1mo | $110,000 | $61 | 50 |
| 212 Miller Mnr | 0.63mi | 4/2.0 | 1,758 (+4%) | 16mo | $218,000 | $124 | 46 |
| 911 Ebony Dr | 0.63mi | 4/2.5 | 1,800 (+7%) | 9mo | $295,000 | $164 | 46 |
| 218 Dewey St | 0.57mi | 4/2.0 | 1,518 (-10%) | 9mo | $225,000 | $148 | 45 |
| 213 N Miller Manor Ct | 0.66mi | 3/2.0 (-1) | 1,632 (-3%) | 17mo | $254,500 | $156 | 41 |
| 141 E Pierce Cir | 0.73mi | 4/2.0 | 1,872 (+11%) | 5mo | $220,000 | $118 | 40 |
| 415 W Marion St | 0.61mi | 4/2.0 | 1,900 (+12%) | 12mo | $215,000 | $113 | 37 |
Match score weights: distance 35% · size 25% · config 20% · recency 20%. Top-matched comps best support the ARV.
Projected returns pro-forma
-3.0% appreciation · 3.0% rent growth · sell at horizon
- IRR
- -13.5%
- Equity multiple
- 0.51×
- Total profit
- $-18,525
- Equity at exit
- $20,263
- IRR
- -4.7%
- Equity multiple
- 0.69×
- Total profit
- $-11,680
- Equity at exit
- $11,750
Cash invested: $38,052 (down + closing). Projections, not guarantees.
Landlord ↔ Tenant lean methodology
- Overall (STATE)
- 90 Strongly Landlord-Friendly
- State Indiana
- 90 Strongly Landlord-Friendly · R+11
- County
- — inherits STATE
- City
- — inherits STATE
ZIP-level market 47960
- Home prices YoY
- -17.8%
- Active inventory
- 225
- Price-to-rent
- 9.6×
Monthly cashflow live
- Estimated rent
- $1,183 medium interval (Pro) →
- Mortgage (P&I)
- −$713
- Tax from tax record
- −$110 /mo · $1,321/yr
- Insurance
- −$57
- HOA
- −$0
- Vacancy / Maint / Mgmt
- −$248
- Net cashflow
- $55
Break-even live
Sensitivity live
| Price | -10% $132 | -5% $94 | +0% $55 | +5% $17 | +10% $-22 |
|---|---|---|---|---|---|
| Rent | -10% $-38 | -5% $8 | +0% $55 | +5% $102 | +10% $149 |
| Rate | -1.0pp $124 | -0.5pp $90 | base $55 | +0.5pp $20 | +1.0pp $-16 |
UW: 25.0% down · 7.5% · 30yr · 1.5% tax · 5.0% vac · 8.0% maint · 8.0% mgmt
Financing live
Cash to close
- Down payment
- $33,975
- Closing costs
- $4,077
- Reserves months
- —
- Total cash needed
- —
Loan-product check · same deal, 3 products live
Conventional
25% down · 7.5% · 30yr
- Down + closing
- —
- Monthly P&I
- —
- Monthly cashflow
- —
- DSCR
- —
- Eligible?
- —
Personal DTI + credit; lowest rate.
DSCR
20% down · 8.5% · 30yr
- Down + closing
- —
- Monthly P&I
- —
- Monthly cashflow
- —
- DSCR
- —
- Eligible?
- —
No personal income docs; deal must DSCR.
Hard money
10% down · 12.0% · 12mo
- Down + closing
- —
- Monthly P&I
- —
- Monthly cashflow
- —
- DSCR
- —
- Eligible?
- —
Short-term bridge; refi at stabilization.
Rent comps 1 comps
| Address | Beds | Baths | Sqft | Rent | $/sqft | DOM | Units | Dist |
|---|---|---|---|---|---|---|---|---|
| 1101 Foxwood Ct Monticello, IN | 1.0–3.0 | 1.0–2.0 | 969 | $1,183 | $1.22 | 15d | 7 | 1.32mi |
Listing history 16 events
-
2026-06-22days on market $135,900 Active 21 DOM
-
2026-06-21days on market $135,900 Active 20 DOM
-
2026-06-21days on market $135,900 Active 19 DOM
-
2026-06-18days on market $135,900 Active 17 DOM
-
2026-06-17days on market $135,900 Active 16 DOM
-
2026-06-16days on market $135,900 Active 15 DOM
-
2026-06-15pricedays on market $135,900 Active 14 DOM
-
2026-06-13days on market $145,900 Active 12 DOM
-
2026-06-12days on market $145,900 Active 11 DOM
-
2026-06-09days on market $145,900 Active 8 DOM
-
2026-06-08days on market $145,900 Active 7 DOM
-
2026-06-07days on market $145,900 Active 6 DOM
-
2026-06-07days on market $145,900 Active 5 DOM
-
2026-06-04days on market $145,900 Active 2 DOM
-
2026-06-02remarks 699-char remark
-
2026-06-02$145,900 Active 1 DOM
ⓘ Source: listings_history table (triggers on properties + properties_extension) + one-shot
backfill from property_details.listing_events for pre-trigger history.
Tax reassessment forecast IN · Partial reset (capped growth)
- Current annual tax
- $1,321 · $110/mo
- Projected year-2 tax
- $1,321 · $110/mo
- Expected delta
- $0/yr ($0/mo · 0.0%)
ⓘ Screening estimate from a state-policy table — verify with the county assessor before closing.
Climate risk First Street
- Flood 1/10 Low FEMA zone X (unshaded) · 0% chance over 30 yrs
- Wildfire 1/10 Low
- Heat 3/10 Moderate 7 d/yr ≥101°F today · 17 d/yr by 30 yrs out
- Wind 2/10 Low
- Air quality 2/10 Low 1 unhealthy d/yr today · 2 by 30 yrs out
Nearby sold comps map
Loading sold comps map…
Walkable amenities ~0.75 mi
Loading nearby amenities…
Taxation est. · year 1
- Rental income
- $14,196
- − Mortgage interest
- −$7,613
- − Property taxes
- −$1,321
- − Insurance
- −$680
- − Repairs & maintenance
- −$1,136
- − Management
- −$1,136
- − Depreciation
- −$3,953
- Taxable loss
- −$1,642
- Est. tax savings @ 24.0%
- +$394
- After-tax cash flow
- $1,056/yr
For passive investors: Depreciation is non-cash, so a rental often shows a tax loss while cash-flowing — sheltering income. Rental losses are passive: they offset passive income freely, and up to $25,000/yr can offset ordinary (W-2) income if you actively participate and your MAGI is under $100k (phasing out to $0 by $150k); unused losses carry forward. On sale, claimed depreciation is recaptured at up to 25%, and gains may owe capital-gains tax (a 1031 exchange can defer both). Figures are a year-1 estimate at your 24.0% rate — not tax advice; consult a CPA.
Schools (NCES district)
- District
- Twin Lakes School Corporation
- NCES district ID
- 1811580
- Math proficiency
- 39% ▼ -10.00%
- Reading proficiency
- 46% ▼ -5.00%
- Median HH income
- $48,963
- Composite
- 36.44/100
- National rank
- #4666
- State rank
- #116 of 301 in IN
Livability — Monticello
- Score
- 71/100
- State rank
- #141
- US rank
- #7278
Category grades
Schools grade is shown separately in the Schools card above.
Census & demographics
- Census place
- Monticello, IN
- Population (ZIP)
- 15,313
Population outlook (White County) Hauer SSP2
- Today (2025)
- 23,006 people
- By 2030
- 22,204 · -3.5%
- By 2040
- 20,441 · -11.1%
- By 2050
- 18,711 · -18.7%
- By 2075
- 14,989 · -34.8%
- By 2100
- 10,896 · -52.6%
Race, ethnicity, and origin ACS 2023
- Neighborhood character
- Predominantly White (92%)
- Race & ethnicity
- White 92% Hispanic / Latino 6% Two or more races 3%
- Hispanic origin (detail)
- Mexican 5%
- Common ancestry
- Romanian 4% Iranian 3% Lithuanian 2%
- Foreign-born
- 4% · Canada
- Languages at home
- 94% English-only · Spanish 4%
Political lean MEDSL · White
- 2024 margin
- Solid R (+45.0) · D 26.4% · R 71.4% · Other 2.2%
- 2008→2024 swing
- -36.7pp toward R · 2008: -8.3pp · 2024: -45.0pp
- All cycles
- 2024: R+45.0 2020: R+44.1 2016: R+42.9 2012: R+23.6 2008: R+8.3
Not yet ingested
- Civics
- —
Market trends
- HPI YoY
- ▼ -52.85%
- Current HPI
- 243.8468
- Rent YoY
- —
- Metro
- —
- State GDP YoY
- ▲ 2.90%
- F500 in state
- 18
Industry mix (Fortune 500 HQ in IN)
| Industry | F500 HQs | Revenue |
|---|---|---|
| Industrial Machinery | 2 | $37B |
|
||
| Healthcare | 1 | $177B |
|
||
| Pharmaceuticals | 1 | $45B |
|
||
| Metals / Steel | 1 | $18B |
|
||
| Agriculture | 1 | $17B |
|
||
| Packaging | 1 | $12B |
|
||
Price history
+65.8% since first listed3 events — show timeline
- 2026-06-01 Listed $145,900 IRMLS
- 2018-07-31 Sold (MLS) $88,000 IRMLS
- 2018-05-01 Listed $88,000 IRMLS
Property tax history
+10.0%/yrLatest (2024): $1,321 · +19.2% YoY. Source: county tax records.
Cash-flow waterfall
monthlySold comps — $/sqft
last 12 mo · ≤1 miLoading sold comps…